Diverse Deep Matrix Factorization With Hypergraph Regularization for Multi-View Data Representation
2023-10-21HaonanHuangGuoxuZhouNaiyaoLiangQibinZhaoSeniorandShengliXie
Haonan Huang,,, Guoxu Zhou,,, Naiyao Liang,Qibin Zhao, Senior,, and Shengli Xie,,
Abstract—Deep matrix factorization (DMF) has been demonstrated to be a powerful tool to take in the complex hierarchical information of multi-view data (MDR).However, existing multiview DMF methods mainly explore the consistency of multi-view data, while neglecting the diversity among different views as well as the high-order relationships of data, resulting in the loss of valuable complementary information.In this paper, we design a hypergraph regularized diverse deep matrix factorization(HDDMF) model for multi-view data representation, to jointly utilize multi-view diversity and a high-order manifold in a multilayer factorization framework.A novel diversity enhancement term is designed to exploit the structural complementarity between different views of data.Hypergraph regularization is utilized to preserve the high-order geometry structure of data in each view.An efficient iterative optimization algorithm is developed to solve the proposed model with theoretical convergence analysis.Experimental results on five real-world data sets demonstrate that the proposed method significantly outperforms stateof-the-art multi-view learning approaches.
I.INTRODUCTION
REAL-WORLD data usually can be described from multiple views or collected from various sources.For example,the same image can be represented by its color, texture, and edge; the same news is reported by different institutions.These heterogeneous features described by different data views are called multi-view data [1].Multi-view data learning has become one of the research hotspots in machine learning because it provides rich and insightful information of data to many real-world applications, such as bioinformatics [2], face recognition [3], and document mining [4].
In the last decade, massive approaches for multi-view data representation (MDR) have been proposed.When dealing with multi-view data, compared with traditional single-view methods which just concatenate multiple types of features in a big matrix, multi-view methods aim to systematically embed the rich information and multi-way interactions into the learning process [5], [6].Classical data representation methods include self-representation [7], spectral clustering [8], nonnegative matrix factorization (NMF), sparse coding [9], [10]and tensor factorization [11], [12].For instance, Gaoet al.[13] proposed a self-representation method with a common indicator matrix that guarantees the consistency of the clustering structure among different views.In [14], a tensor regularized self-representation [15], [16] is introduced to ensure low redundancy and explore the high order correlations underlying multiple views.The work in [8] develops a co-regularized spectral clustering method to obtain a consistent clustering result.In [17], Xuet al.added tensor nuclear norm minimization [18] on indicator matrices to control the consistency among different views.However, both self-representation methods and spectral clustering methods need to construct the symmetric affinity matrix, which makes it difficult for them to work on large-scale data sets.
Recently, NMF based methods have attracted extensive attention in MDR.Because this method has the ability to use the low-dimensional parts-based representation matrix, it can further improve the accuracy and scalability of clustering tasks [19], [20].Aiming to keep clustering solutions more comparable, Liuet al.[21] proposed a MultiNMF which constructs a consensus term to learn a common matrix across different views.In [22], a partially shared NMF method is presented to simultaneously consider the characteristics of multiview data (consistency and complementarity).Yanget al.[23]designed a uniform distribution multi-view NMF model to reduce distribution divergences between different views by jointly learning a latent consensus matrix.Although the above NMF-based methods often achieve promising clustering performance under certain conditions [24], they work in a onelayer formulation, which can not capture complex hierarchical information and implicit low-level hidden attributes contained in the original data.
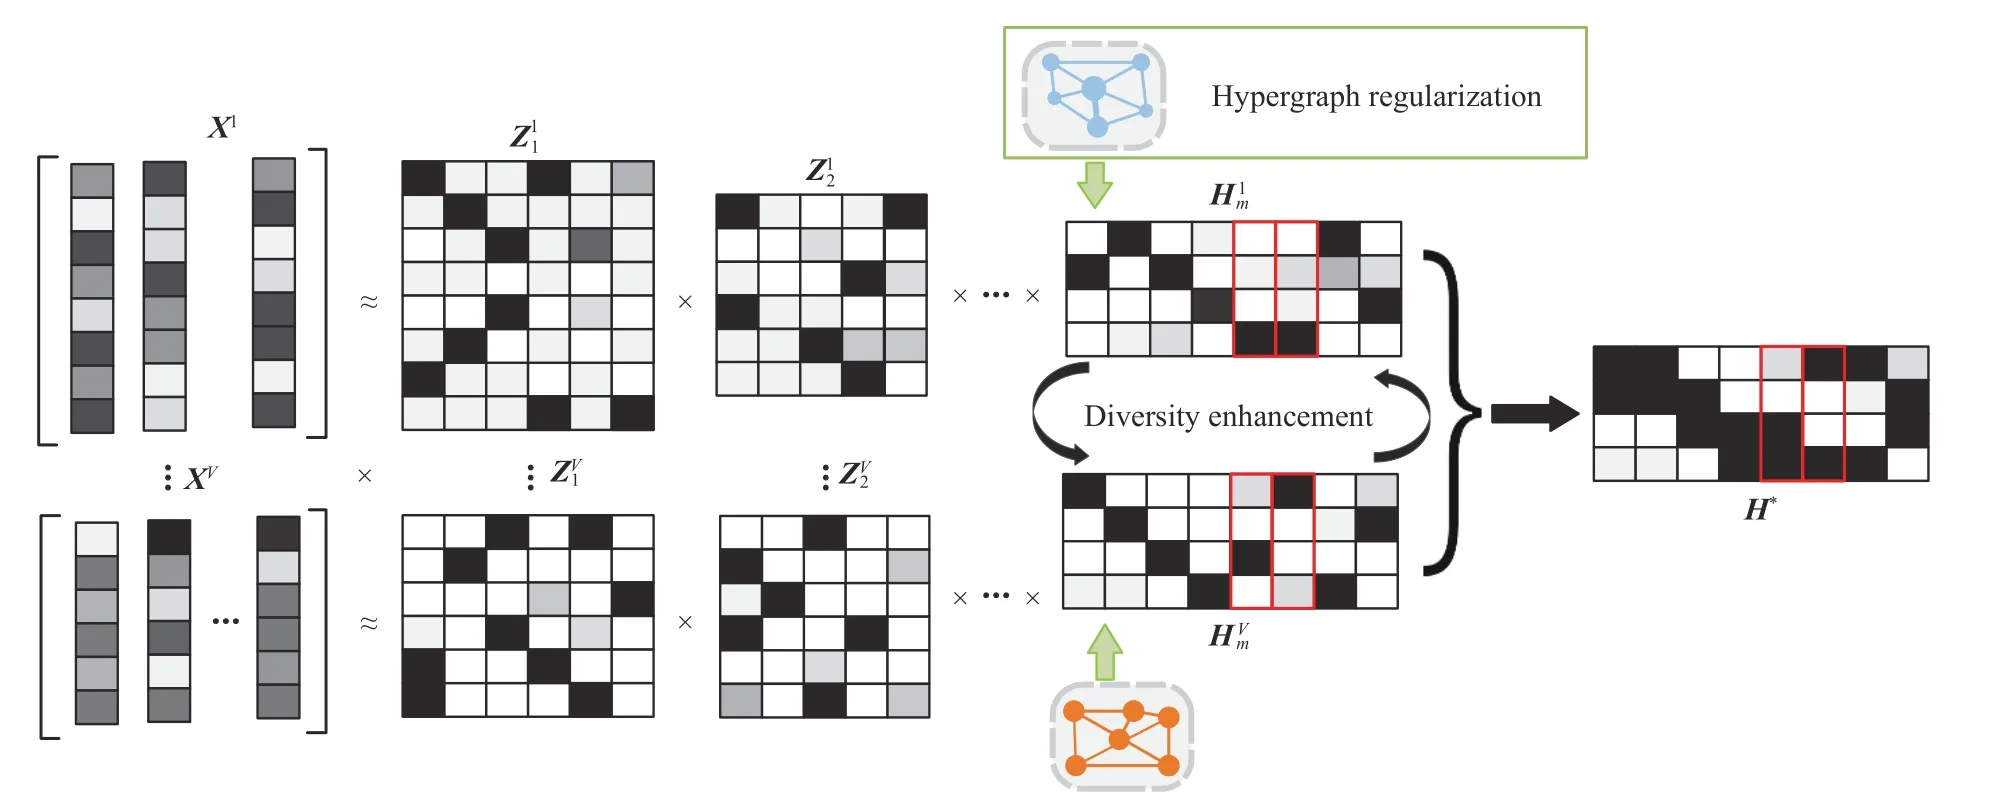
Fig.1.Illustration of the work flow of the proposed HDDMF.
Inspired by the advances of deep learning methods [25],Trigeorgiset al.[26] proposed a novel deep matrix factorization (DMF) model to learn hidden representations that allow themselves to utilize clustering interpretation according to unknown attributes of input data.Compared with the traditional NMF based method, DMFs have stronger data representation ability [27], which is favored by researchers and quickly extended to various scenarios: including community detection[28], remote sensing [29] and so on.Following this, Zhaoet al.[30] extended the one-view DMF to a multi-view version (MDMF) by directly fixing the common one-side factor among multiple views.A parameter-free MDMF is proposed in [31] to simplify the model structure and reduces the complexity.A partially shared deep matrix factorization model is proposed [32] to respect the consensus information and viewspecific features with partial label information.Moreover, the multi-layer decomposition technique is also applied to improve the ability of representation in other traditional shallow decomposition models.The method [33] based on concept factorization is developed to catch comprehensive multiview information.A novel deep multi-view concept learning method is presented [34] to model consistent and complementary information in a semi-supervised way.In [35], the authors designed a novel robust auto-weighted deep k-means multiview model which directly assigns the partition result.Recently, Huanget al.[36] presented a deep autoencoder-like NMF method to find a compact multi-view representation that considers complementary and consistent information simultaneously.
Motivation:Note that these DMF-based MDR methods only emphasize consensus among multiple views and ignore the diversity attribute, resulting in the loss of mutually complementary information in each indistinct view that influences performance.We consider introducing diversity constraints to ensure that the representation of each view has distinct information as much as possible, so as to discover the structural complementarity across different views.Some works have also pointed out the importance of diversity in multi-view learning [37], [38].On the other hand, existing methods usually fail to preserve the local manifold structure or only consider pairwise connectivity (e.g., MDMF [30]).In real-world applications, the relationship between data points should be more complex than simple pairwise.If this complex relationship is simply compressed into a pairwise relationship, it will inevitably lead to the loss of valuable information for learning tasks.Some researchers have also shown the advantages of high-order geometrical regularization (namely hypergraph regularization) in data representation [39], [40].
In this article, to address the above concerns, we propose a hypergraph regularized diverse deep matrix factorizationbased MDR method (HDDMF).As shown in Fig.1, each view data matrixXv(superscriptvdenotes thev-th view) is decomposed intombasis matrices(subscriptidenotes thei-th layer) denoting the multiple-layer factorization and one representation matrix.The diversity enhancement constraints are imposed on the final low-dimensional representation.As shown in the red box in Fig.1, if two samples are similar in the 1st view’s subspace, HDDMF enforces them to be complementary in theV-th view’s subspace.This approach ensures that diverse information among multiple views can be captured and more comprehensive learning can be achieved.By introducing the hypergraph embedding regularization, HDDMF preserves the high-order geometrical structure embedded in the high-dimensional feature space to explicitly model view-specific features.The hypergraph regularization and diversity constraint can play a good complementary balance; the hypergraph regular term can prevent the loss of internal geometric manifold caused by excessive diversity constraints, and help distinguish the representations of learning from different views and achieve more comprehensive learning.
The main contributions of HDDMF are summarized as follows.
1) Under the assumption of diverse information among multiple views of data, a diversity-enhanced deep matrix factorization-based multi-view representation learning model is established to explore the structural complementarity that exists inter-and intra-views.
2) Hypergraph regularization is performed to preserve the intrinsic geometrical structure, which can capture a high-order relation of the view-specific data locality and strengthen the model’s representation ability.
3) We develop an efficient algorithm for optimizing the HDDMF and demonstrate that it decreases the objective function of the HDDMF monotonically and converges to a stationary point.
The rest of this paper is organized as follows.In Section II,we give a brief introduction of some preliminaries on the NMF and DMF.In Section III, we describe the proposed HDDMF model formally.Section IV-A presents an efficient algorithm to solve the proposed problem, discusses the convergence proof and analyses the time complexity.In Section V, we report the extensive experimental results on five realworld data sets.Finally, Section VI concludes this paper.Table I summarizes the general notations in this article for the reader’s convenience.
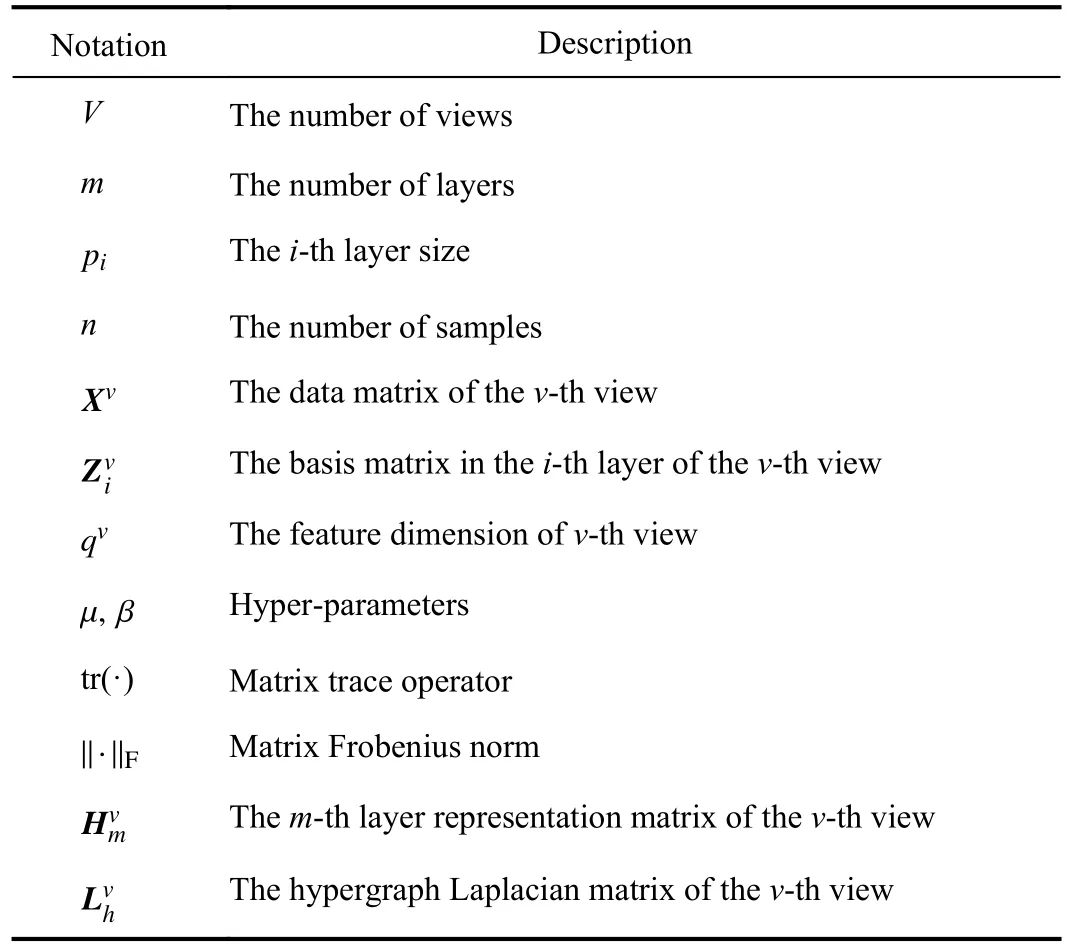
TABLE I NOTATION USED IN THIS PAPER
II.PRELIMINARIES
Non-negative matrix factorization (NMF) [41], [42] is designed to analyze the non-negative data.Mathematically,given a data matrixX, NMF aims to approximately decompose it into two non-negative matrices, i.e., a basis matrixZand a low-rank representation matrixH
Cuiet al.[31] extended NMF to semi-NMF by releasing the non-negative constraints of NMF on input data so that the model can deal with the mix-sign data.Semi-NMF can be considered as a soft version of k-means whereZdenotes cluster centroids andHdenotes cluster indicators for each data point.On the other hand, real-world data sets always consist of complicated and multi-level features.The shallow representation we learned may contain complex structural and hierarchical information.For example, a face image also contains information about posture, expression, clothing and other attributes, which are helpful in identifying the depicted characters.In order to extract a more expressive representation,Trigeorgiset al.[26] extended the semi-NMF to deep matrix factorization (DMF), by decomposing the data matrixXinto multiple factors, to learn the high-level representation
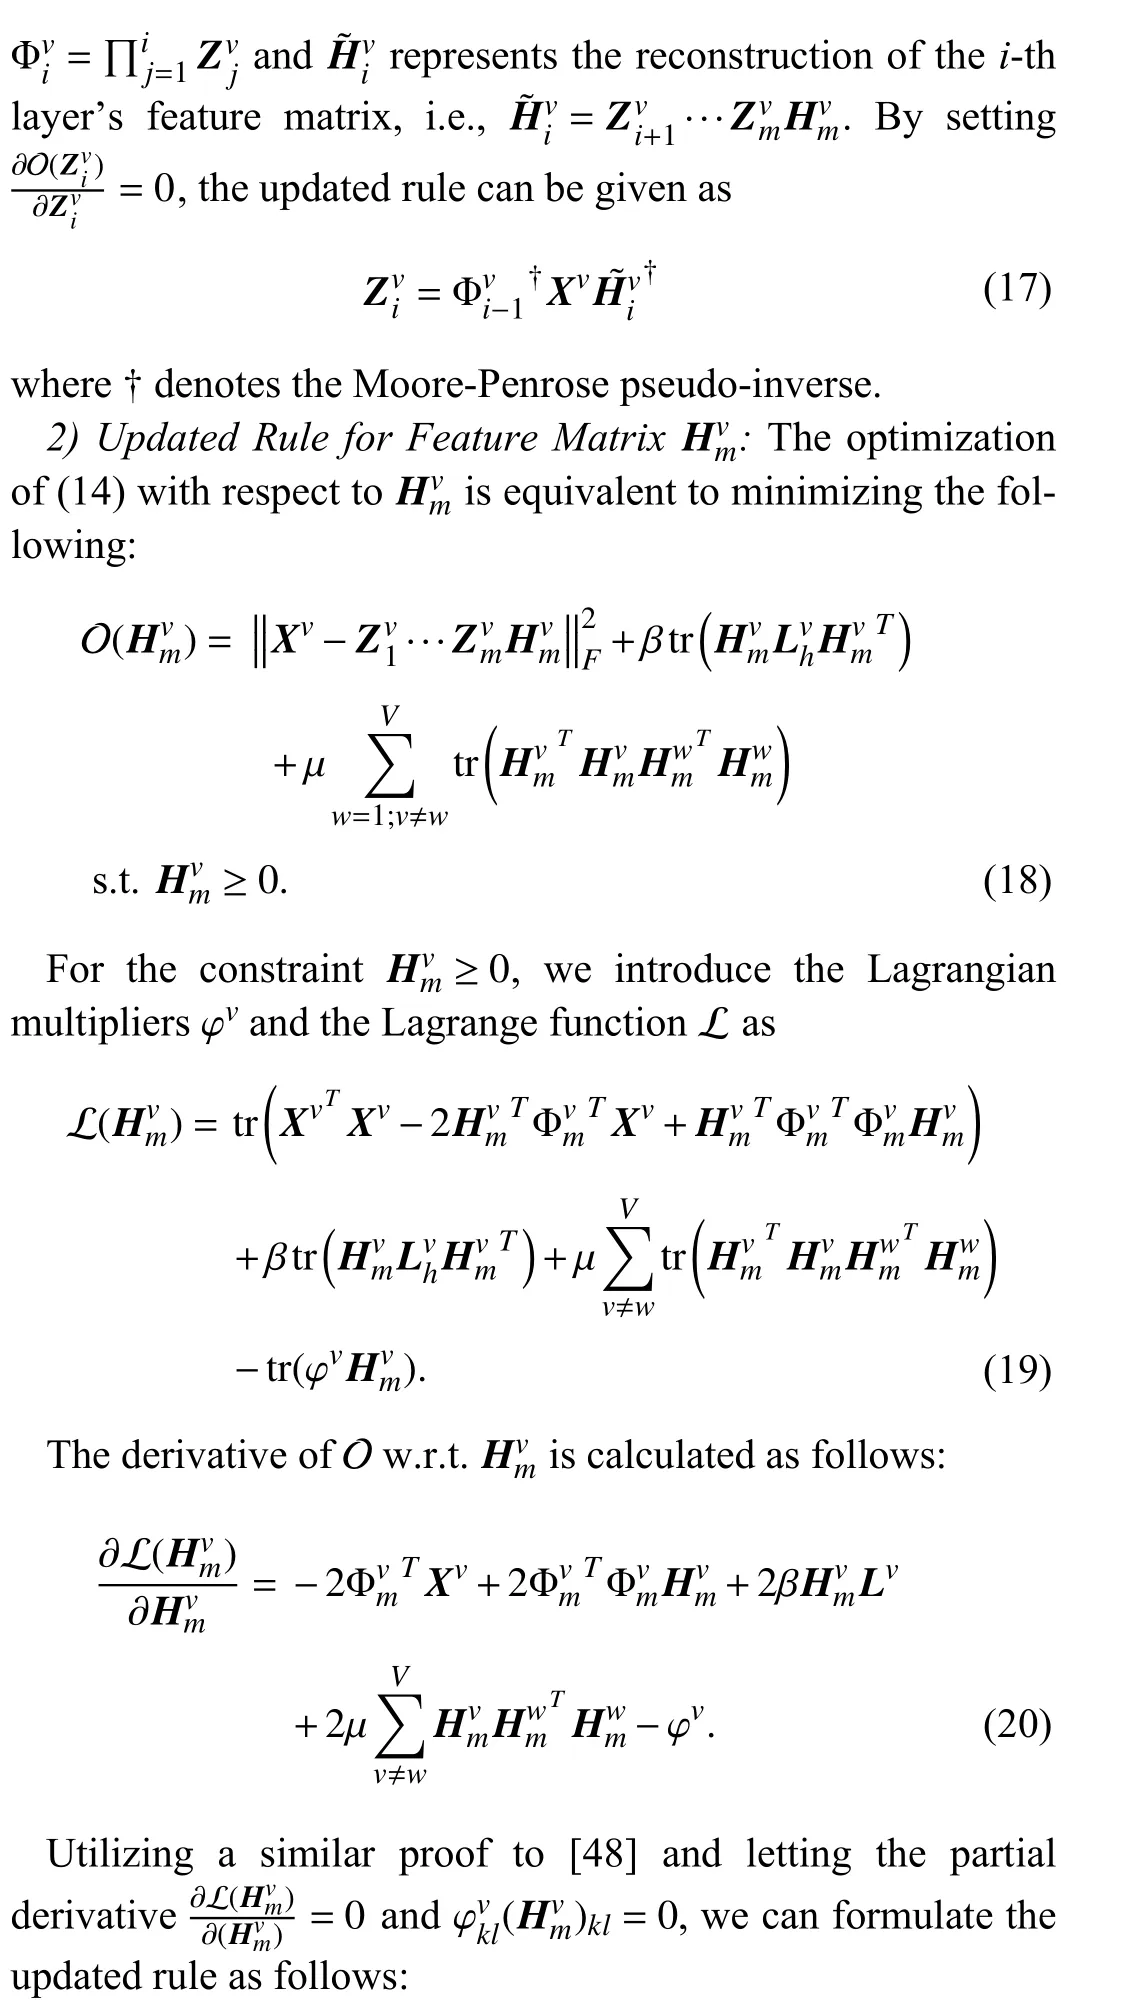
wheremis the number of layers, basis matricesZ1∈Rq×p1,...,Zm∈Rpm-1×pm, and representation matricesHm∈R+pm×n.In fact, the approximation in (2) corresponds to successive factorizations ofX
Thus, based on the Frobenius norm, the loss function of DMF can be written as
where //·//Fis the Frobenius norm.DMF can make up for the deficiency of the shallow NMF method because its multi-layer decomposition can capture the hierarchical structure of data to improve the performance of low-dimensional data representation and clustering.
In order to tackle the challenge of multi-view data, a general multi-view version of deep matrix factorization can be straightforwardly designed.Let us denote the input data matricesX={X1,X2,...,XV} withVviews, where the objective function can be expressed as
Because the method mentioned above only considers the specific attribute of each view data and cannot measure the diversity attribute of multi-view data, we call the method nondiverse deep matrix factorization (NdDMF).
III.HYPERGRAPH REGULARIZED DIVERSITY-ENHANCED DEEP MATRIX FACTORIZATION
In this section, we expect to find a new deep matrix factorization method, which can respect a high-order intrinsic geometrical structure and simultaneously utilize multi-view diversity information to create an intact final representation matrix.We first detail the two main components: 1) hypergraph function to discover high-order relationships among data; 2) learning to enhance multi-view diversity representation ability.The final objective function and its algorithmic solution are then presented.The proof on the convergence of the algorithm and the analysis of time complexity are included in the last subsections.
A. Hypergraph Regularization
We construct a hypergraphG=(V,E,W) to encode highorder relationships in data space.Vdenotes a finite set of vertices,Eis a family of hyperedgeeofVand∪=V.Wis made up ofw(e), which is defined as the weighting function to measure the weight of a hyperedge [43].The incident matrixRwith a size ofV×Eis used to define the relationship between the vertices and the hyperedges, whose entryr(vi,ei)is 1 ifvi∈eiand 0 otherwise.Therefore, the degree of each vertexd(vi) and the degree of a hyperedged(ei) can be calculated as
Similar to [44], the unnormalized hypergraph matrix can be defined as follows:
whereDVandDEare d(iag)onal matrices, which all correspond to thed(vi) anddej, respectively.Thus, the hypergraph regularization term can be formulated as
whereHdenotes the representation matrix andHidenotes thei-th data representation vector.The hypergraph is a generalization of a graph in which a hyperedge can connect any number of vertices, but the previous common graph edges can only represent pairs of vertices.Therefore, constructing hypergraphs rather than common graphs can respect high-order relationships among samples.
B. Diversity Measurement
To guarantee diversity between two views, the main idea is to control the orthogonality of data representation in two views.As illustrated in Fig.2(a), let us denote the indicator matrix asQvof thev-th view.To quantify the diversity between two views (vandw), we can minimize the following function [45], [46]:


For multi-view representation learning, directly constraining the orthogonality of the same sample representation vector from different views has weak interpretability.Because different views represent different heterogeneous features, it is difficult to achieve one-to-one correspondence with the representation column vector position.In addition, the relationships in the interior of the latent features can not be measured by the above DI term.To address the above concerns, we first defineQvas the inner product of thej-th row and thei-th column of the new representation matrixHv, i.e.,Qv=HvT Hv.Along this line, as shown in Fig.2(c), we design the diversity enhancement termDE(·) as follows:

Based on the property of the trace operation, we can reformulate (12) as a simple quadratic term:

DEterm ensures the orthogonality of the inner product of the representation matrix from different views.Each column vector ofQmatrix represents the similarity between the sample and other samples, which corresponds to the positions of different views and has strong interpretability.Particularly, if two learned feature pointshiandhjare very similar in thev-th view(i.e.,≈1),weexpectthatthey wouldlearncomplementaryfeaturesinthew-thview (i.e.,≈0).Inconclusion,theDEterm is essentially mining the diversity between sample pairs from different views, and can explore the structural complementary relationship that exists inter- and intra-views.
Finally, combining (5), (9), and (13), we can formulate the objective function O of our hypergraph regularized diversityenhanced deep matrix factorization as follows:

Fig.2.Illustration of the proposed diversity measure methods.
IV.OPTIMIZATION ALGORITHM
A. The HDDMF Algorithm


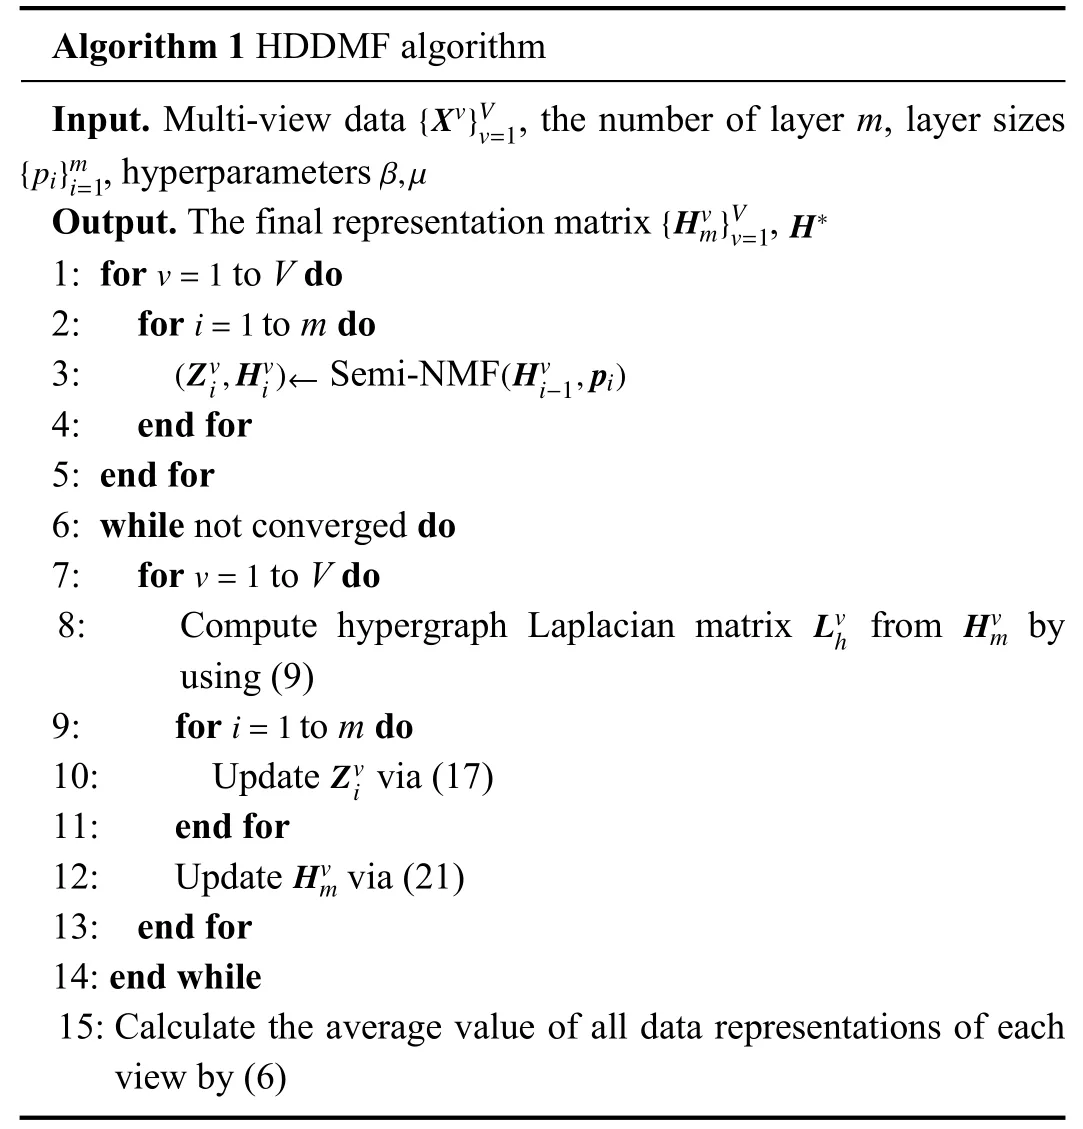
Algorithm 1 HDDMF algorithm{Xv}V Input.Multi-view data , the number of layer m, layer sizes, hyperparameters v=1{pi}m i=1 β,µ{Hvm}V v=1 H∗Output.The final representation matrix ,v=1 1: for to V do i=1 2: for to m do(Zvi,Hvi)← (Hvi-1,pi)3: Semi-NMF 4: end for 5: end for 6: while not converged do v=1 7: for to V do Lvh Hvm 8: Compute hypergraph Laplacian matrix from by using (9)i=1 9: for to m do Zvi 10: Update via (17)11: end for Hvm 12: Update via (21)13: end for 14: end while 15: Calculate the average value of all data representations of each view by (6)
B. Convergence of the Algorithm
In this section, we prove the convergence of the update rules(17) and (21).
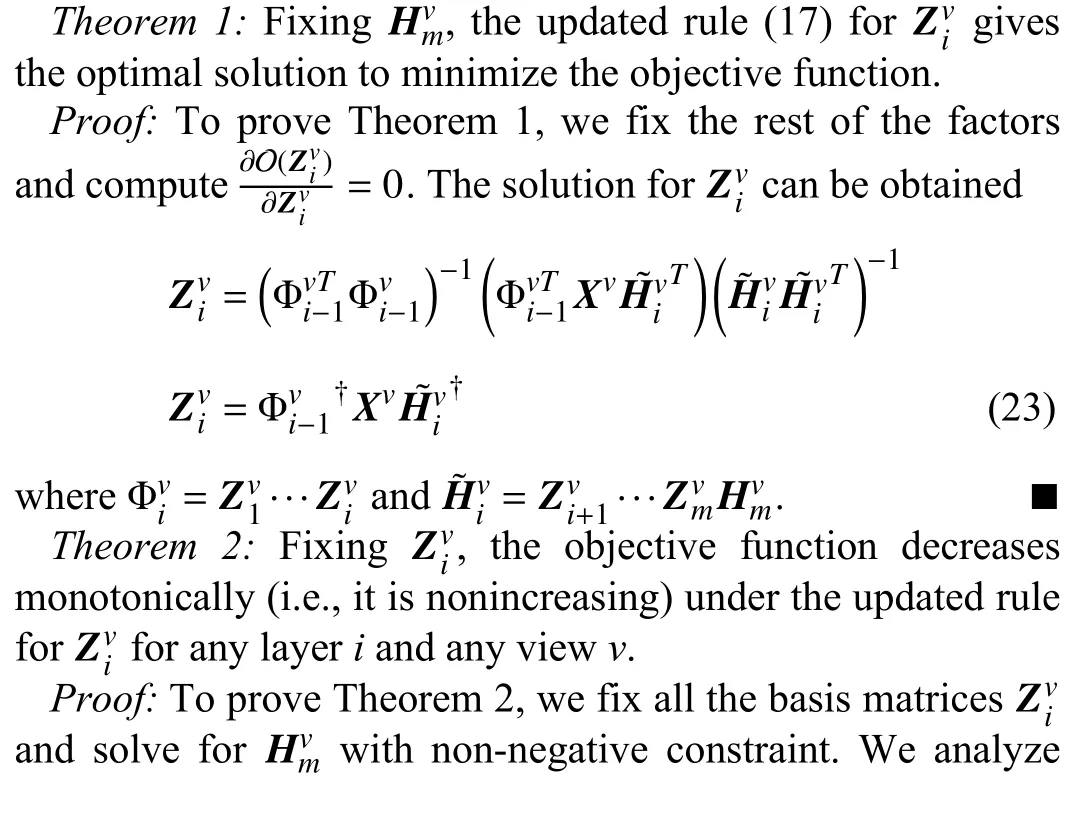

IfZis an auxiliary function, then O is a nonincreasing function under the updateG=argminG Z(G,G′).Therefore,, we have O(G)=Z(G,G)≥Z(G′,G)≥O(G′).Therefore, as in[48], we construct an appropriate auxiliary functionZwhich satisfies the requirements.

TABLE II STATISTICS OF DATA SETS USED IN EXPERIMENTS
As beenprovenbyAppendix,Zissucha functionfor Oand satisfiesthenecessaryconditions.Inaddition,Z(G,G′)isa convex function forGand its global minimum is
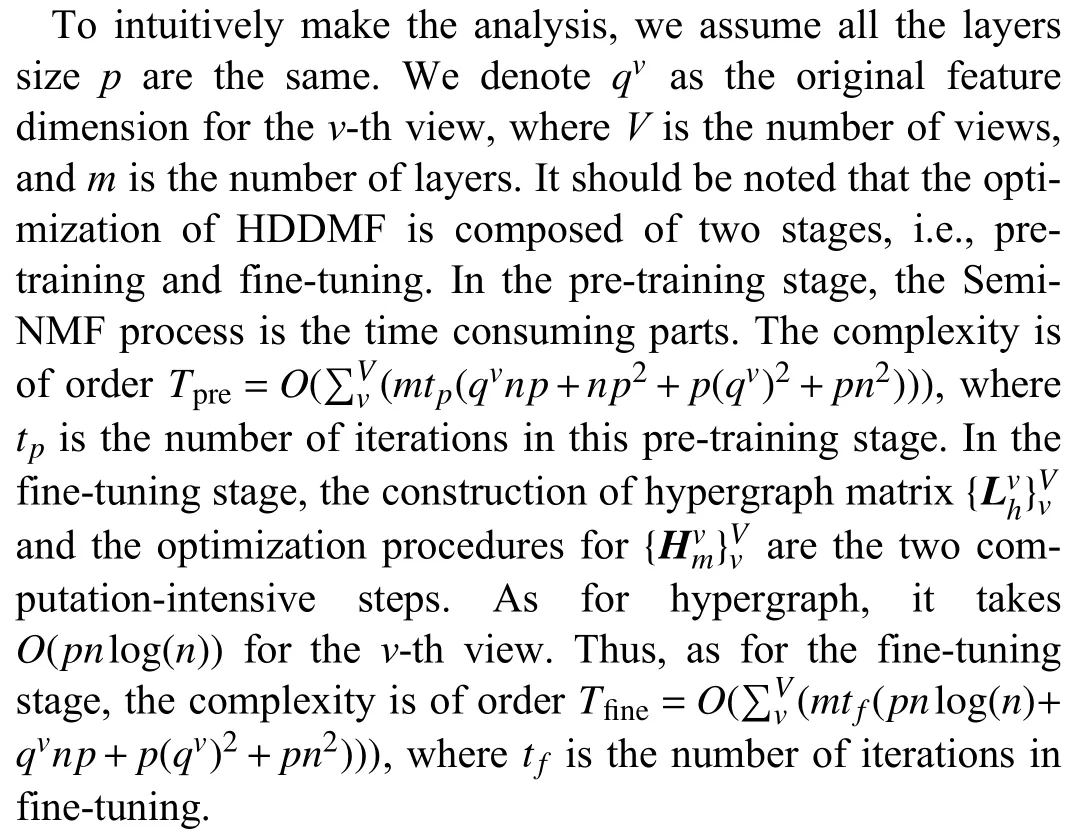
C. Time Complexity Analysis
V.EXPERIMENTAL RESULTS AND ANALYSIS
A. Experimental Setup
The data sets and evaluation measures we used are described as below:
1)Data Sets: The Prokaryotic data set consists of 551 prokaryotic samples with three view: textual features and two types of genomic representations.
Caltech101-71https://www.vision.caltech.edu/datasets/[50] is a subset of Caltech101, which consists of 1474 images of 7 widely used categories, i.e., Windsor-Chair, Motorbikes, Dolla-Bill, Snoopy, Garfield, Stop-Sign, and Face.Following [51], we extracted 6 features, i.e.,Gabor, Wavelet moments, CENTRIST, HOG, GIST and local binary pattern (LBP) features.Their dimensions are 48, 40,254, 1984, 512 and 928, respectively.
ORL2https://cam-orl.co.uk/facedatabase.htmlconsists of 400 facial images from 40 different individuals.In order to construct the multi-view data sets, similar to [40], we extract three types of features include intensity of dimension 4096, LBP of dimension 3304 and Gabor of dimension 6750.
Extended YaleB3http://vision.ucsd.edu/~leekc/ExtYaleDatabase/ExtYaleB.html[52] contains 650 images of 10 human subjects under 65 different poses/illumination conditions.There are three types of features (intensity, LBP, Gabor) of this data set.
STL104https://www-cs-faculty.stanford.edu/~acoates/stl10/[53] is an image data set including 10 categories,i.e., bird, airplane, cat, truck, car, dog, monkey, ship, deer, and horse.Then we sample 1300 from each category and build intensity, HOG features and LBP features as three views.
We summarize the important statistical details of the data sets in Table II.
2)Evaluation Measures: To evaluate our method’s performance, the following metrics are adopted: accuracy (ACC),normalized mutual information (NMI), Purity, adjusted rank index (AR), F-score, Precision, and Recall.Since each metric penalizes different properties in the clustering, we report all metrics results for a comprehensive evaluation.
B. Compared Methods
Next, we compare our proposed method with the following state-of-the-art clustering methods:
1)Multi-View NMF(MultiNMF)[21]: This is a classical multi-view NMF method, which constructs a joint consensus matrix learning process and obtains meaningful and comparable clustering results.We set the only parameter λ to0.01 according to the recommendation of the original paper.
2)Locality Preserved Diverse NMF(LP-DiNMF)[38]:This is a shallow NMF method, which maintains the local geometry structure and diversity across multiple views simultaneously.We search for the parameters from{0.0001,0.001,0.01,0.1,1,10,100,1000}as suggested.
3)NMF With Co-Orthogonal Constraints(NMFCC)[54]:Based on LP-DiNMF, NMFCC additionally imposes orthogonal constraints on the learned basis matrices and the representation matrices.We empirically set the parameter{α, β, µ, γ}to { 0.01, 0.1, 0.1, 0.1} for all data sets as the authors advised.
4)2CMV[55]: A recently proposed factorization-based multi-view model using CMF and NMF, which could exploit the consensus and complementary information for multi-view data.We set the parameters {λ,δ,} to {70,1} as the paper recommended.
5)Multi-View Deep Matrix Factorization(MDMF)[30]:This approach extends the deep semi-NMF from single-view to multi-view by fixing the shared one-sided final representation among multiple views.Two hyper-parameters γ and β are set to 0.5 and 0.1, as the authors recommended.
6)Self-Weighted Multi-View DMF(SMDMF)[31]:SMDMF is a hyper-parameters-free version of MDMF, which can obtain an appropriate weight for each view automatically.
7)Partially Shared DMF(PSDMF)[32]: recently proposed a partially shared structure which can discover viewspecific and common features among different views.The parameters µ is set to 0.1 and β is set to 0 in order to carry out the experiment of the unsupervised scene.
8)Non-Diverse DMF(NdDMF): NdDMF is implemented by using deep semi-NMF [26] (as shown in (5)) for each view,and then clustering the combination of final representation through spectral clustering.We also conduct a hypergraphregularized version (called HNdDMF) to investigate the effectiveness of manifold regularization.
9)Our Methods: We carry out two versions of hypergraph regularized diversity-induced DMF.The first version is combing the common diversity constraint as described in (11)(called HDDMF-DI).The second version is HDDMF which contains the diversity enhancement technique as described in(13).Then we apply spectral clustering on the learned final representation to obtain the clustering results.
It should be noted that LP-DiNMF, NMFCC, MDMF, HNd-DMF, HDDMF-DI and HDDMF all need to construct the Laplacian graph matrix by using the k-nearest-neighbor (k-NN) where the parameterkis set to the number of data categories, as suggested in [38].Our source code is available at https://github.com/libertyhhn/DiverseDMF.
C. Parametric Sensitivity
1)Influence of the Number of Layers: To investigate the influence of model depth on clustering results, we applied HDDMF method with depth varying from 1-layer to 4-layer,and the layers sizes are set as [50], [50 100], [50 100 150] and[50 100 150 200].The clustering results with different numbers of layers are shown in Fig.3.Although different data sets have different performance, no matter in ACC or NMI, we can observe that the clustering performance of the multi-layer model is better than the single-layer model on all five data sets.This verifies that the multi-layer model can explore the implicit hierarchical information, which is beneficial for clustering.With the increase of the number of layers, the clustering effect of the model may decline (e.g., Prokaryotic),because the model has been in the state of over-fitting.Therefore, we adopt a suitable layer structure for each data set to carry out the subsequent experiments.Specifically, we configure a 2-layer structure for the Prokaryotic, Extended YaleB and STL10 data sets, a 3-layer structure for ORL, and a 4-layer structure for Caltech101-7.
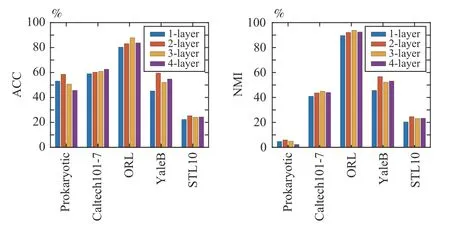
Fig.3.The clustering results ACC and NMI with different number of layers on five data sets.
2)Influence of the Manifold Regularization and Diversity Constraint: To analyze the influence of modules in (14), we focus on two important parameters β and µ.β controls the contribution of the hypergraph regularization in the learned final representation matrices.µ measures the degree of diversity in representation among different views.According to the grid search strategy, they are both chosen from the same range[0.0001,0.001,0.01,0.1,1].In Fig.4, we show the experiment results of parameter tuning, in terms of ACC and NMI on the Prokaryotic, Caltech101-7, ORL, Extended YaleB and STL10 data sets, respectively.From the figure, we can observe that when β is set to a relatively large value and µ is set to a relatively small value, HDDMF can achieve the best results in most cases.
D. Performance Comparison
In order to make a fair comparison among all competitors,we directly use the source code provided by the authors for experimental verification, and search for the best parameters according to the suggestions of the original papers.All programs run within MATLAB (R2018b) on a server with Intel(R) Xeon(R) E5-2640 @2.40 GHz CPU and 128 GB RAM, under the Linux operating system.For each method, we run it with ten initializations and record the results’ mean and standard variance, referring to the experimental setup in [30].The clustering performance comparison on five multi-view data sets are reported in Tables III-VII.For all these metrics,a higher value denotes better clustering performance and the highest values are in boldface.Note that, the Multi-NMF, LPDiNMF, NMFCC and 2CMV all require that only non-negative data can be processed.Thus, they can not handle data sets with negative pixels (e.g., Prokaryotic and Caltech101-7).And results of above non-negative methods on Prokaryotic and Caltech101-7 are not available.From these tables, we can make the following observations:

Fig.4.ACC and NMI changes with the alterations of µ and β on data sets.
1) In general, the proposed HDDMF achieves the best results on all data sets, except the NMI and AR metrics on the Prokaryotic data set.Take the STL10 data set as an example;our method improves around 1.6%, 2.3%, 2.43%, 1.78%,1.33%, 1.35% and 2.73% with respect to seven metrics over the second-best method MDMF.This is mostly because our proposed method uses three aspects in one unified model:a) structural complementarity of representation from different views; b) high-order relationship among samples; c) deep representation to discover hierarchical information.
2) The deep matrix factorization-based MDR methods(MDMF, SMDMF, PSDMF, and the proposed HDDMF(-DI))show better results than single-layer matrix factorizationbased MDR methods (MultiNMF, LP-DiNMF, NMFCC and 2CMV) in most cases.The reason may be that through depth factorization, the model can eliminate some adverse factors and keep identity information in the final representation.
3) It can be seen that the clustering performance of the models with diversity constraints is much better than that without diversity constraints.Take the ORL data set as an example,compared with the non-diverse method HNdDMF, the methods with diversity constraints (HDDMF-DI and HDDMF)improve performance more than 4% in terms of all metrics.This indicates that diversity-induced techniques could discover mutually complementary information among multiple views and are more conducive to clustering.
4) It is clear to see that the HDDMF outperforms the HDDMF-DI in all data sets.Take Caltech101-7 data as an example; in terms of ACC and NMI, the leading margins of HDDMF are about 3% and 7% over HDDMF-DI, respectively.This indicates that, exploiting diverse attributes between samples and views at the same time can help to further improve the representation ability of the model to achieve accurate learning.
5) On the Extended YaleB data, HNdDMF achieves better performance than NdDMF.The reason is that the high-order manifold regularization can preserve the local geometrical structure of original data in the subspace learned by the model.
E. The Convergence of the Algorithm
The HDDMF objective function is solved by the proposed iterative optimization method (Algorithm 1).We have theoretically proven its convergence property in Section IV-B.To experimentally show the convergence of the HDDMF, we record the objective value (14) in each iteration.The convergence curves on the ORL, Caltech101-7, Extended YaleB and STL10 data sets are shown in Fig.5.We can observe that the objective function value drops sharply and gradually meets the convergence status after about 500 iterations.
F. Visualizations for Embedding Results
Visualizations for embedding results in the Caltech101-7,Extend YaleB, and ORL data sets are demonstrated in Figs.6-8, respectively.Here, the learned embedding representation matrices are projected onto a two-dimensional subspace using t-SNE [56].Note that we only compare the DMF-based methods in Caltech101-7 because there are negative pixels.We then directly concatenate the features from different views to the original data space.It can be observed that our proposed HDDMF has a clearer cluster structure compared to the original data space, the two NMF-based methods, and the other two DMF-based methods.
VI.CONCLUSION
In this article, we propose a novel deep multi-view data representation model HDDMF by minimizing the orthogonality quantification term to capture the diversity of the underlying representation structure, and integrating the hypergraph regularization to preserve the local manifold structure embedded in a high-dimensional latent space.To solve the optimization problem of our method, a new algorithm is designed and the theoretical analysis of convergence property is provided,where the proposed algorithm converges to a stationary point of the objective function.Extensive experimental results on five real databases show that the proposed methods outperform state-of-the-art multi-view learning approaches on the clustering challenge.Considering that there are nonlinear rela-tionships usually hidden in multi-view data [57], in future works, we will extend HDDMF to nonlinear version to discover nonlinear information and improve the learning ability of the model.

TABLE III RESULTS ON THE PROKARYOTIC DATA SET (MEAN ± STANDARD DEVIATION)

TABLE IV RESULTS ON THE CALTECH101-7 DATA SET (MEAN ± STANDARD DEVIATION)

TABLE V RESULTS ON THE ORL DATA SET (MEAN ± STANDARD DEVIATION)
APPENDIX
To proveZ(G,G′) is an auxiliary function of O (G), we first introduce the Lemma 1 as in [58]:
Lemma 1: For any non-negative matricesQ∈Rn×n,P∈Rk×k,S∈Rn×k,S′∈Rn×k, whereQandPare symmetric,the following inequality holds:
From the O (G) (as in (28)) and theZ(G,G′) (as in (30)), we can obtain the following inequality by utilizing the above Lemma 1:
To obtain lower bounds for the three remaining terms, we

TABLE VI RESULTS ON THE EXTENDED YALEB DATA SET (MEAN ± STANDARD DEVIATION)

TABLE VII RESULTS ON THE STL10 DATA SET (MEAN ± STANDARD DEVIATION)

Fig.5.Iteration number versus the objective value of HDDMF.
utilize the inequalityz≥1+logz,∀z>0, and get
Thus, from (33) to (38), we haveZ(G,G′)≥O(G), andZ(G,G′)=O(G).
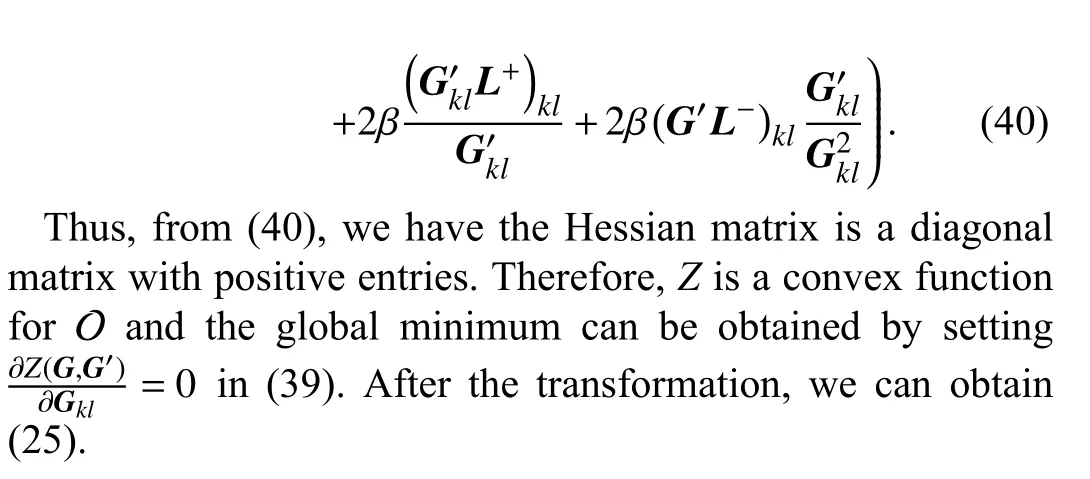
Next, we take the first derivative ofZ(G,G′) (as in (30)) onGto find the minimum ofZ(G,G′) and get
Taking the second derivative ofZ(G,G′) onG, we have
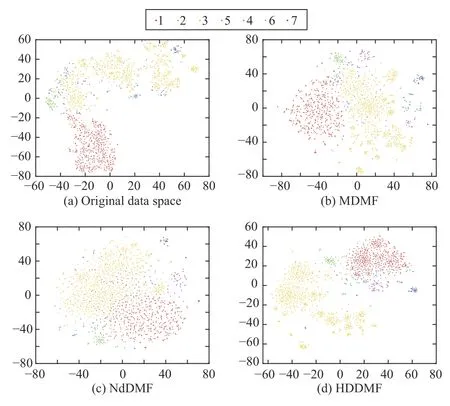
Fig.6.Visualization of the embedding results on the Caltech101-7 data set.

Fig.7.Visualization of the embedding results on Extend YaleB data set.
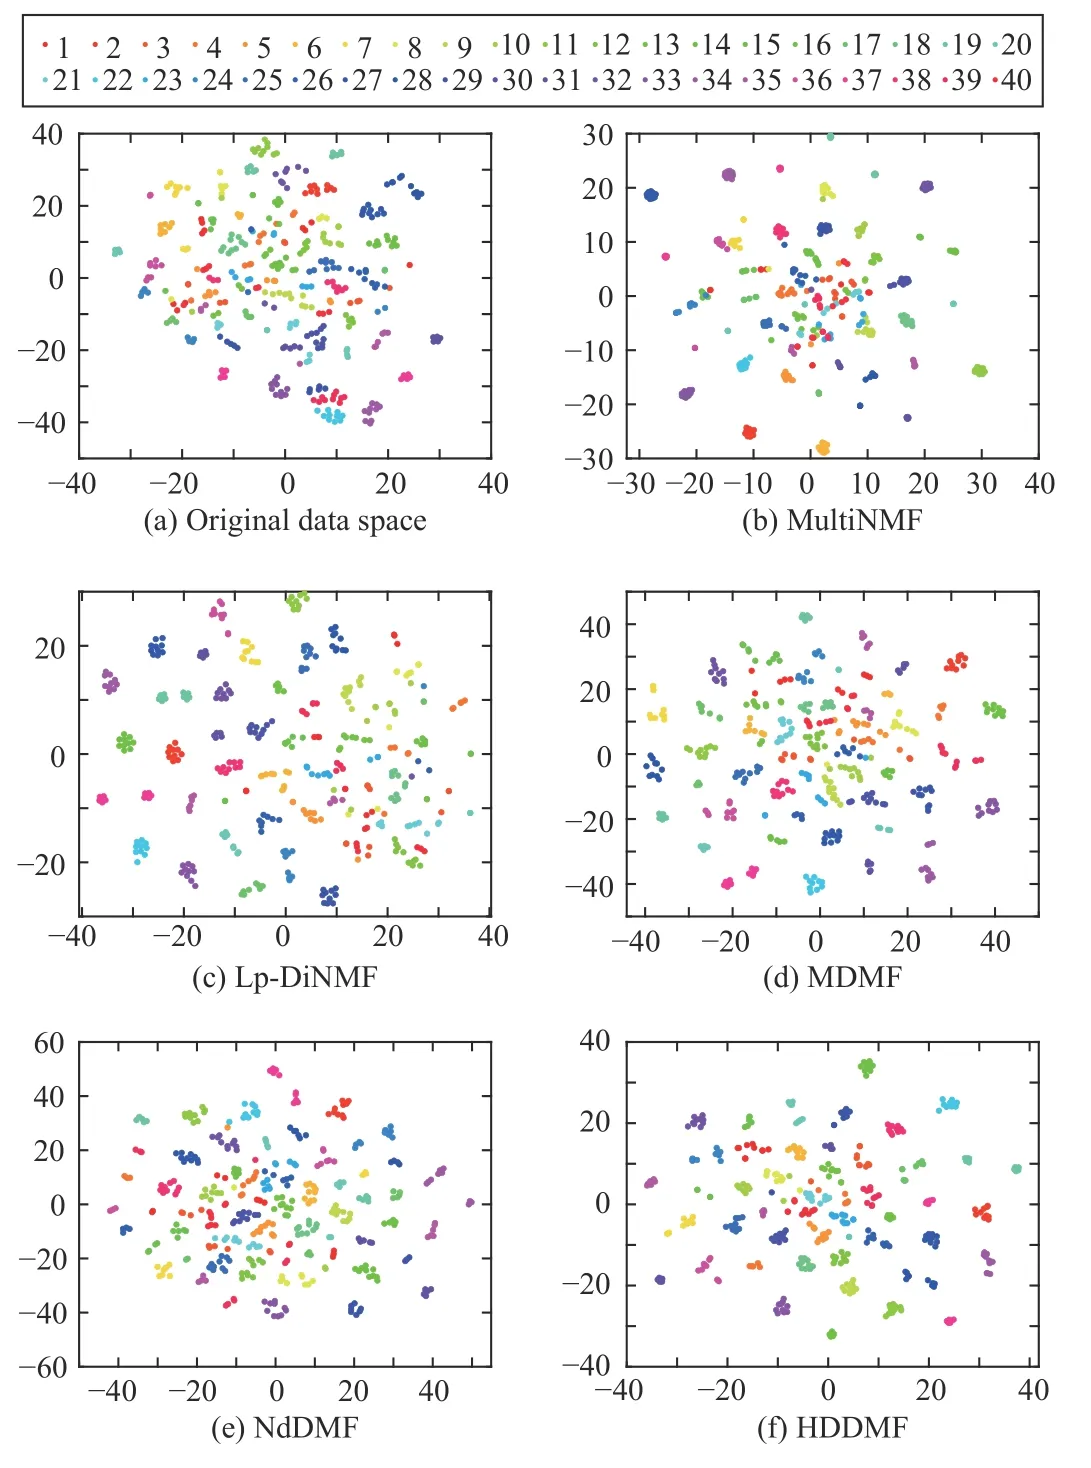
Fig.8.Visualization of the embedding results on ORL data set.
杂志排行
IEEE/CAA Journal of Automatica Sinica的其它文章
- Regularization by Multiple Dual Frames for Compressed Sensing Magnetic Resonance Imaging With Convergence Analysis
- A Range-Based Node Localization Scheme for UWASNs Considering Noises and Aided With Neurodynamics Model
- Intelligent Electric Vehicle Charging Scheduling in Transportation-Energy Nexus With Distributional Reinforcement Learning
- A Model Predictive Control Algorithm Based on Biological Regulatory Mechanism and Operational Research
- Disturbance Observer-Based Safe Tracking Control for Unmanned Helicopters With Partial State Constraints and Disturbances
- Can Digital Intelligence and Cyber-Physical-Social Systems Achieve Global Food Security and Sustainability?
