Spatio-temporal variations in trends of vegetation and drought changes in relation to climate variability from 1982 to 2019 based on remote sensing data from East Asia
2023-10-16ShahzadALlAbdulBASlTMuhammadUMAlRTyanAliceMAKANDAFahimUllahKHANSiqiSHlNlJian
Shahzad ALl ,Abdul BASlT ,Muhammad UMAlR ,Tyan Alice MAKANDA ,Fahim Ullah KHAN ,Siqi SHl,Nl Jian
1 College of Chemistry and Life Sciences,Zhejiang Normal University,Jinhua 321004,P.R.China
2 Department of Agriculture,Hazara University,Mansehra 21120,Pakistan
3 Department of Computer Science,University of Peshawar,Peshawar 25000,Pakistan
4 Faculty of Geo-Information Science and Earth Observation (ITC),University of Twente,Enschede 7500 AE,Netherlands
Abstract Studying the significant impacts on vegetation of drought due to global warming is crucial in order to understand its dynamics and interrelationships with temperature,rainfall,and normalized difference vegetation index (NDVI). These factors are linked to excesses drought frequency and severity on the regional scale,and their effect on vegetation remains an important topic for climate change study. East Asia is very sensitive and susceptible to climate change. In this study,we examined the effect of drought on the seasonal variations of vegetation in relation to climate variability and determined which growing seasons are most vulnerable to drought risk;and then explored the spatio-temporal evolution of the trend in drought changes in East Asia from 1982 to 2019. The data were studied using a series of several drought indexes,and the data were then classified using a heat map,box and whisker plot analysis,and principal component analysis. The various drought indexes from January to August improved rapidly,except for vegetation health index(VHI) and temperature condition index (TCI). While these indices were constant in September,they increased again in October,but in December,they showed a descending trend. The seasonal and monthly analysis of the drought indexes and the heat map confirmed that the East Asian region suffered from extreme droughts in 1984,1993,2007,and 2012 among the study years. The distribution of the trend in drought changes indicated that more severe drought occurred in the northwestern region than in the southeastern area of East Asia. The drought tendency slope was used to describe the changes in drought events during 1982–2019 in the study region. The correlations among monthly precipitation anomaly percentage (NAP),NDVI,TCI,vegetation condition index (VCI),temperature vegetation drought index (TVDI),and VHI indicated considerably positive correlations,while considerably negative correlations were found among the three pairs of NDVI and VHI,TVDI and VHI,and NDVI and TCI. This ecological and climatic mechanism provides a good basis for the assessment of vegetation and drought-change variations within the East Asian region. This study is a step forward in monitoring the seasonal variation of vegetation and variations in drought dynamics within the East Asian region,which will serve and contribute to the better management of vegetation,disaster risk,and drought in the East Asian region.
Keywords: climate change,drought severity,vegetation dynamics,heat mapping,TVDI,spatial correlation,East Asia
1.Introduction
Drought is one of the worst natural disasters worldwide(Wilhit 2000;Kalisaet al.2020). It is defined as abnormally low rainfall leading to changes in vegetation(Bayarjargalet al.2006). Especially at large scales,changes in vegetation can be efficiently monitored using remote sensing technology (Zhanget al.2019;Rastogiet al.2020). NDVI can be used not only to study the spatio-temporal changes of vegetation,but also to reflect the responses of vegetation to climate change (Chenet al.2014;Duet al.2015). According to the intergovernmental panel on climate change (IPCC),worldwide droughts will rise in terms of severity and frequency due to climate change (IPCC 2013). The fifth report of the IPCC states that since 1880,the average worldwide temperature has risen by 0.85°C (IPCC 2013). Low vegetation levels and drought have continuously influenced the ecological,agricultural,and socio-economic sectors,with severe global environmental and socio-economic consequences(Rastogiet al.2020). Asia has severe drought events that are generally more intense and frequent than elsewhere,with considerable local variations,particularly in East Asia (Liuet al.2020;Maximilianet al.2020). The continental climate in East Asia exhibits large spatial and temporal variability (Wanget al.2015). This area mainly experiences less rainfall from October to April (Zribiet al.2016),while more rainfall occurs from July to September,with August being the wettest month (Blakeleyet al.2020).
Since the 1980s,the climate in most of Asia has tended to be humid and warm (Shi and Yu 2003). There are significant differences in topographic and climatic changes in East Asia (Chen and Huang 2017). The northwestern part of Eastern Asian has vast mountainoases-deserts with a fragile ecological environment that is sensitive to climate change (Sunet al.2015;Dilinueret al.2021). Furthermore,with global warming,the surface air temperature has increased significantly in the past few decades,and the warming trend in East Asia is more pronounced (Guanet al.2021). East Asia mainly includes northern Mongolia and parts of northwestern China;it is covered by deserts,plains,and grasslands,and is heavily influenced by the East Asian summer monsoon(Taoet al.2021). Previous studies have reported that in the 21st century,global warming has led to significantly increased drought frequency and intensity levels (Jainet al.2009;Liet al.2019). Therefore,at a regional level,we needed to monitor drought in terms of both the spatial and temporal scales (Haoet al.2012). Furthermore,remote sensing technology can be used for spatiotemporal vegetation and drought monitoring (Conget al.2017). Earlier research work has associated changing vegetation dynamics with climate change (Rousvelet al.2013;Xuet al.2014). It is well known that (intra-seasonal)climate change in East Asia coupled with population variations can lead to changes within the composition,diversity,and structure of vegetation dynamics (Kaptureet al.2015). In the past,meteorological assessments through climate variables such as the monthly percentage of precipitation anomalies (PA) have been used for assessing seasonal variations in the trends of vegetation changes (Tsiliniet al.2014). East Asia is a geologically unique region that is sensitive to global warming and climate change (Zhanget al.2020). Extraordinary heat waves and droughts have occurred in East Asia over the past two decades. Warming and droughts have reached a tipping point,and this change is irreversible in the East Asian climate (Leeet al.2012). However,knowledge gaps due to inadequate practical research on drought and its influence on vegetation may hinder our understanding of the regional climate change impacts on ecosystems(Blakeleyet al.2020). Agriculture is the sector most vulnerable to drought (Meashoet al.2019). Thus,studying drought hazards is essential for understanding their impacts on several vegetation and agro-ecosystems(Zhao and Ma 2019). Satellite remote sensing technology has proven to be an effective and consistent tool for effectively characterizing the spatio-temporal evolution of droughts (Wanget al.2019). Remote sensing is an important method for monitoring drought events because of its useful benefits in diverse weather conditions (Conget al.2017). Among the many remote sensing techniques based on drought indices,the vegetation condition index(VCI) is supported by the NDVI (Kogan 1995),and the temperature condition index (TCI) is based upon the land surface temperature (LST) (Songet al.2014). There are two suitable drought indices for monitoring drought duration and intensity,and its impact on vegetation trends (Kogan 1998). The VCI and vegetation health index (VHI) are the most appropriate for observing the effects of large-scale droughts on vegetation,including agricultural drought,which has a positive relationship with crop yields (Salazaret al.2008). Thermal stress on the surface also led researchers to develop an LSTbased TCI (Koganet al.2004;Jenteset al.2016). In addition,combining VCI and TCI is better than using them individually,and they both contributed to the development of the VHI (Bhuiyanet al.2006). Carlsonet al.(1994)reported a new drought index,the vegetation water supply index (VSWI),based upon the division of NDVI and LST.Sandholtet al.(2002) reported a TVDI based on the triangular space of NDVI and LST.
Climate change is a great concern in East Asia. With the proposed global warming likely to increase drought frequency,effective drought monitoring methods are critical and can be used to implement policies in a timely manner. Therefore,the main objectives of the paper were: (1) to evaluate the performance of the widely used drought indices NDVI,NVSWI,VCI,TVDI,VHI,and NPA in different growing seasons,so that these indicators can be used to study drought with greater confidence;(2)to study the effect of drought on seasonal variations of vegetation in relation to climate variability,and determine which growing seasons is most vulnerable to drought risk;and (3) to explore the spatio-temporal evolution of the trend in drought changes in East Asia from 1982 to 2019.
2.Study region and data analysis
2.1.Study region
The study region is located in the northeastern part of the Asian continent,covering an area of about 5 125 000 km2.East Asia ranges from 5 to 55°N and 70 to 140°E,with an elevation of 1 103 m (3 619 feet) and a barometric pressure of 89 kPa. The East Asian region includes Mongolia,China,North Korea,South Korea,and Japan.This region includes a variety of climatic zones,including arid,tropical,subtropical,temperate,continental,water,and arid regions. The main vegetation covers over East Asia consist of crops,short grass,evergreen trees,deciduous trees,tall grass,evergreen shrubs,deciduous shrubs and mixed trees. The average annual precipitation is 256 mm,with more than 56% in summer and less than 4% in winter. The average temperature in summer reaches above 17°C,and the average temperature in winter drops below–7°C (Yanget al.2011).
2.2.Remote sensing data and processing
The GIMMS NDVI3g bimonthly dataset has been calibrated to minimize various interferences,such as sensor degradation,volcanic eruptions,and loss of calibration,and thus it can be used to identify continuous vegetation activity trends (Aliet al.2019). Continuous monthly mean temperature and precipitation data were obtained from the NASAs MERRA-2 with a spatial resolution of 0.5°×0.5°. The NASA’s MERRA dataset was rescaled to 0.0833°×0.0833°,the same as the available NDVI resolution. The temperature was taken at 2 m above the ground,while the digital elevation model was derived from the ASTER GDEM.
Temperature vegetation drought index (TVDl)In this study,the NOAA AVHRR NDVI3g and LST datasets were used with a spatial resolution of 0.0833° from 1982 to 2019 at 15-day intervals. For study areas with multiple climate zones,TVDI can be used to monitor drought and vegetation trends (Liuet al.2020). TVDI was calculated by the following formula:
where LSTminrepresents the wet edge with the minimum LST value,LSTmaxrepresents the dry edge with the maximum LST value,while LST represents per month land surface temperature of the same month during 1982–2019(Fig.1):

Fig.1 A conceptual land surface temperature (LST)–normalized difference vegetation index (NDVI) trapezoid.
Among the parameters,a1,b1,a2,and b2are the coefficients of the wet and dry edge equations calculated by linear regression. According to Abbaset al.(2014),the TVDI was further classified into five levels,as shown in Table 1.
Drought vegetation indexesAccording to Carlsonet al.(1994),the VSWI was calculated by the following formula:
According to Conget al.(2017),the NVSWI was calculated by the following formula:
where VSWImaxand SWIminare the maximum and minimum values of VSWI for each pixel. The NVSWI value was further classified into five levels,as shown in Table 2.
According to Carlsonet al.(1994),the VCI was determined by the following formula:
where NDVIminand NDVImaxare the minimum and maximum NDVI of the same month during 1982–2019(Table 3).
The TCI was determined by the following formula(Kogan 1990):
where LSTmaxand LSTminare the maximum and minimum land surface temperatures,while LSTiwas calculated from each pixels per month of LST during 1982–2019.
The VHI was calculated by the following equation between 1982 and 2019.
where the monthly VCI and TCI are for eachipixel,jmonth andkyear.
Monthly precipitation anomaly percentage (NAP)TheNAP refers to the rainfall deficit as compared with the mean value for the same period,and was calculated according to Conget al.(2017):

Table 1 Drought categories for temperature vegetation drought index (TVDI)
where PA is preciation,P is the current rainfall,andis the average precipitation during the same period.
The NAP could be derived using the equation below,with values ranging from 0 to 1.
where PAmaxand PAminare the maximum and minimum values of the PA.
Drought tendency rateTo determine whether the drought increased or decreased in East Asia from 1982 to 2019,the drought trend was based on the monthly NVSWI values:
wherenis the length of the time series,iis the year,and Fiis the frequency of drought in theith year. The frequency of droughts is increasing if the slope is positive,while the degree of drought is increasing if the slope is negative.
Heat map (HM) analysis and principal component analysis (PCA)HM analysis was used for analyzing the associations between different vegetation and drought index categories (NDVI,VHI,VCI,NVSWI,TVDI,TCI and NAP) with a yearly time scale by using Software R Language 4.0.1. In order to compare the trends in vegetation and drought changes in relation to climate variability from 1982 to 2019,the PCA was carried out using R Language 4.0.1. The PCA technique is used to identify environmental factors of spatiotemporal variables(components) that can explain as much of the variance in multidimensional data as possible. PCA was used here to determine how each drought and vegetation index,or groups of these indices,relate to an interim assessment of the service using R Language 4.0.1 (Abbaset al.2014).
Spatial correlation analysisTime series for all variables were used for the correlation study (rxy),as this helps in assessing whether extreme climates lead to extreme vegetation activity.
wherexis the forecaster climate andyrepresents the drought indices.
3.Results and discussion
3.1.Study of vegetation dynamics
Precipitation,temperature,and NDVI values across East Asia were calculated as their maximum,mean,and minimum values using AVHRR NDVI and NASA’s MERRA precipitation and temperature data from 1982 to 2019. Fig.2 shows the spatial patterns of maximum,minimum,and means of NDVI,rainfall,and temperature over the entire time period. The maximum NDVI values confirmed that the coverage of crop growing and farming is generally situated in the southeastern region of East Asia (Fig.2-A1–A3). Agricultural areas are located in the northeastern to southeastern part of East Asia,indicating higher NDVI activity. The AVHRR NDVI data are often used as consistent indicators of terrestrial vegetation growth trends (Wanget al.2001).The maximum,mean and minimum temperatures are shown in Fig.2-B1–B3. The temperature map shows that the temperature is the highest in the southeastern region of East Asia,while,the temperature in the northwestern region of East Asia is relatively low. At low temperatures,transport from the root to the shoot andvice versaare reduced (Dracupet al.1980).Furthermore,the maximum,mean and minimum precipitation values recorded by NASA MERRA for the entire 37 year period of 1982–2019 are shown in Fig.2-C1–C3. The rainfall map shows that most of the rainfall occurred in the southeastern region of East Asia,while the northwestern region of East Asia is relatively dry and has very little rainfall. Thus,understanding and characterizing the vegetation dynamics relative to the drought patterns is essential for building a base for local drought predictions associated with climate models and downscaled multi-model projections (Swainet al.2011).
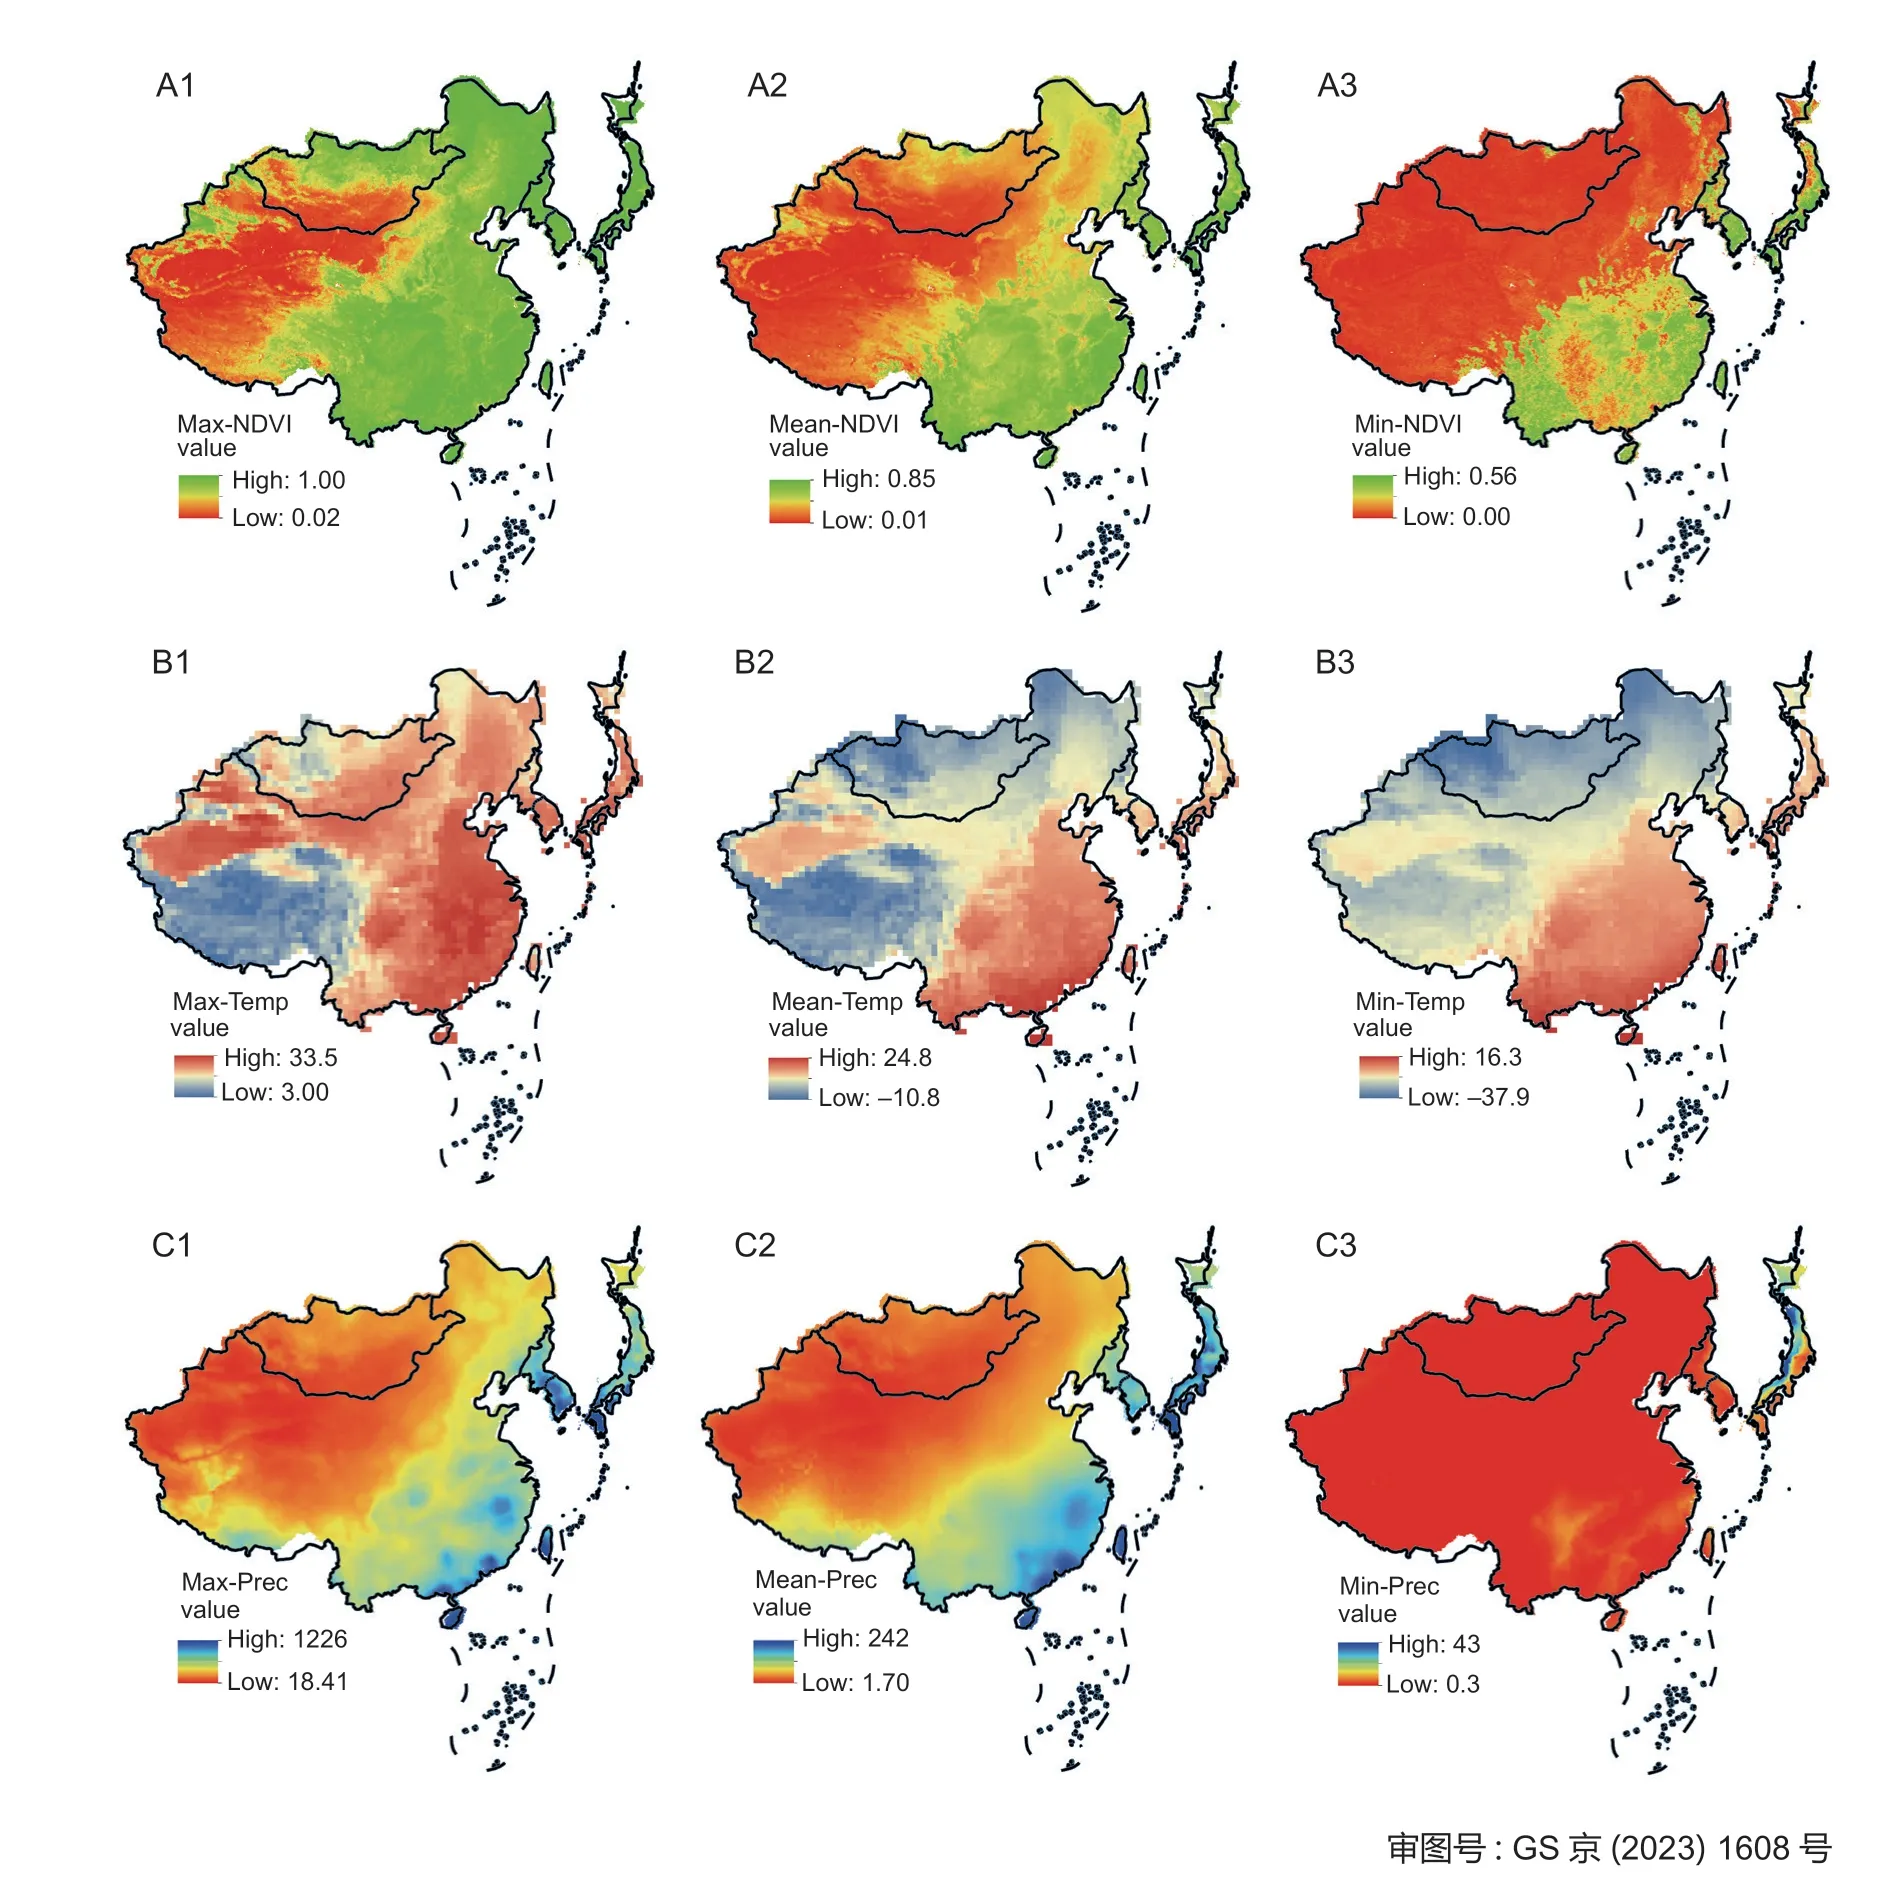
Fig.2 Maximum,mean and minimum normalized difference vegetation index (NDVI;A1–A3),temperature (°C;B1–B3) and precipitation (mm;C1–C3) values over East Asia during 1982–2019.
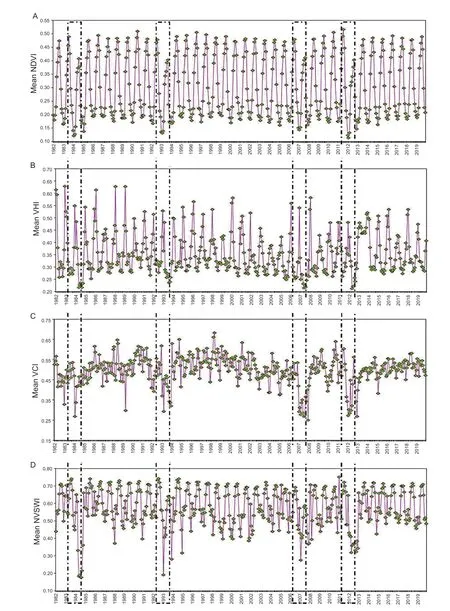
Fig.3 Variations in monthly normalized difference vegetation index (NDVI;A),vegetation health index (VHI;B),vegetation condition index (VCI;C) and normalized vegetation supply water index (NVSWI;D) over East Asia for the period of 1982 to 2019.
3.2.Monthly NDVl,VHl,VCl,NVSWl,TVDl,TCl and NAP variations
To analyze vegetation dynamics and variations in drought changes from a historical perspective,the monthly NDVI,VHI,VCI,NVSWI,TVDI,TCI,and NAP values were calculated from 1982 to 2019. The drought and vegetation indices are shown in Figs.3 and 4,respectively. Among the present vegetation indices,NDVI,VHI and VCI are the most commonly used methods for studying vegetation dynamics from remote sensing data (Raynoldset al.2012). The values of NDVI,VCI,NVSWI,TVDI,TCI,and NAP rose steadily from January to June,continued to rise after June,and remained unchanged in August. The NDVI values do not reflect non-drought or drought environments in a particular region,but the severity of drought can be calculated by the correlation between NDVI and LST(Eltahir and Pal 1996). After August,except for the VHI and TCI indices,the other indices rose further until September,then stalled and eventually declined. This dynamic trend might be the consequence of variations in vegetation due to its responses to rainfall and temperature. A gradient of surface circumstances such as temperature is caused by major changes in LST,which can play a vital role in atmospheric variations (Crowet al.2010). Monthly values of NDVI,VHI,VCI,NVSWI,TVDI,TCI and NAP indicate that East Asia experienced severe droughts in 1982,1993,2007 and 2012,as the years of greatest drought stress. Very low values (≤0.20) of NDVI,VHI and TCI affected most of the East Asian region(Fig.4). Several previous studies have used NDVI,VHI and VCI to assess changes in drought and vegetation variations (Vicente-Serranoet al.2013;Conget al.2017). The vegetation growth pattern and drought trend of East Asian vegetation areas are different from other floral regions. In desert areas,rainwater is the restrictive feature for crop growth,while in forest areas temperature and solar radiation are the restrictive features. The monthly VCI,NDVI,NVSWI,TVDI,TCI and NAP values rose rapidly from April to October. These findings are consistent with those reported by Aliet al.(2019). The monthly VCI,NDVI,NVSWI,TVDI,TCI,and NAP values became constant in September,improved in October,and in December they presented descending trends.The monthly VHI,VCI and NDVI values in June explain several events that affect vegetation changes prior to early May. VCI is an important vegetation index that can be used to study the effect of drought on agriculture(Aminet al.2011). The start of May has enough rainfall and warmth to promote vegetation growth in East Asia.The months of June and July usually have the highest temperatures with low rainfall,which becomes a limiting factor for plant growth. Since there is low rainfall with high temperatures,and particularly in the northwest region of East Asia,these factors are responsible for the wilting of plants in the dry season. Variations in the monthly drought indices are also related to human activities that can lead to vegetation degradation.

Fig.4 Variations in monthly temperature vegetation drought index (TVDI;A),temperature condition index (TCI;B) and monthly precipitation anomaly percentage (NAP;C) over East Asia for the period of 1982 to 2019.
3.3.Heat mapping analysis
On the basis of the heat map analysis,two key groups of seven vegetation and drought indexes (NDVI,VHI,VCI,NVSWI,TVDI,TCI,and NAP) were categorized as the first group (G1) and the second group (G2),which are presented in Fig.5. This study categorized the two key groups according to the similarity index between several drought indices and the driest year during the study period of 1982–2019. The G1group includes the most severely dry years such as 1984 and 2012,which show very low values of NDVI,VHI,VCI,NVSWI,TVDI,TCI,and NAP. In contrast,the G2group includes the least dry years of the different selected drought indices (Fig.5).Only years 1993 and 2007 were used as the maximum(n=6) of the recognized vegetation and drought indexes,such as NDVI,VHI,VCI,NVSWI,TVDI,and TCI,followed by 1984 and 2012 as the driest years,which were used for the seven vegetation and drought index categories,such as NDVI,VHI,VCI,NVSWI,TVDI,TCI,and NAP.
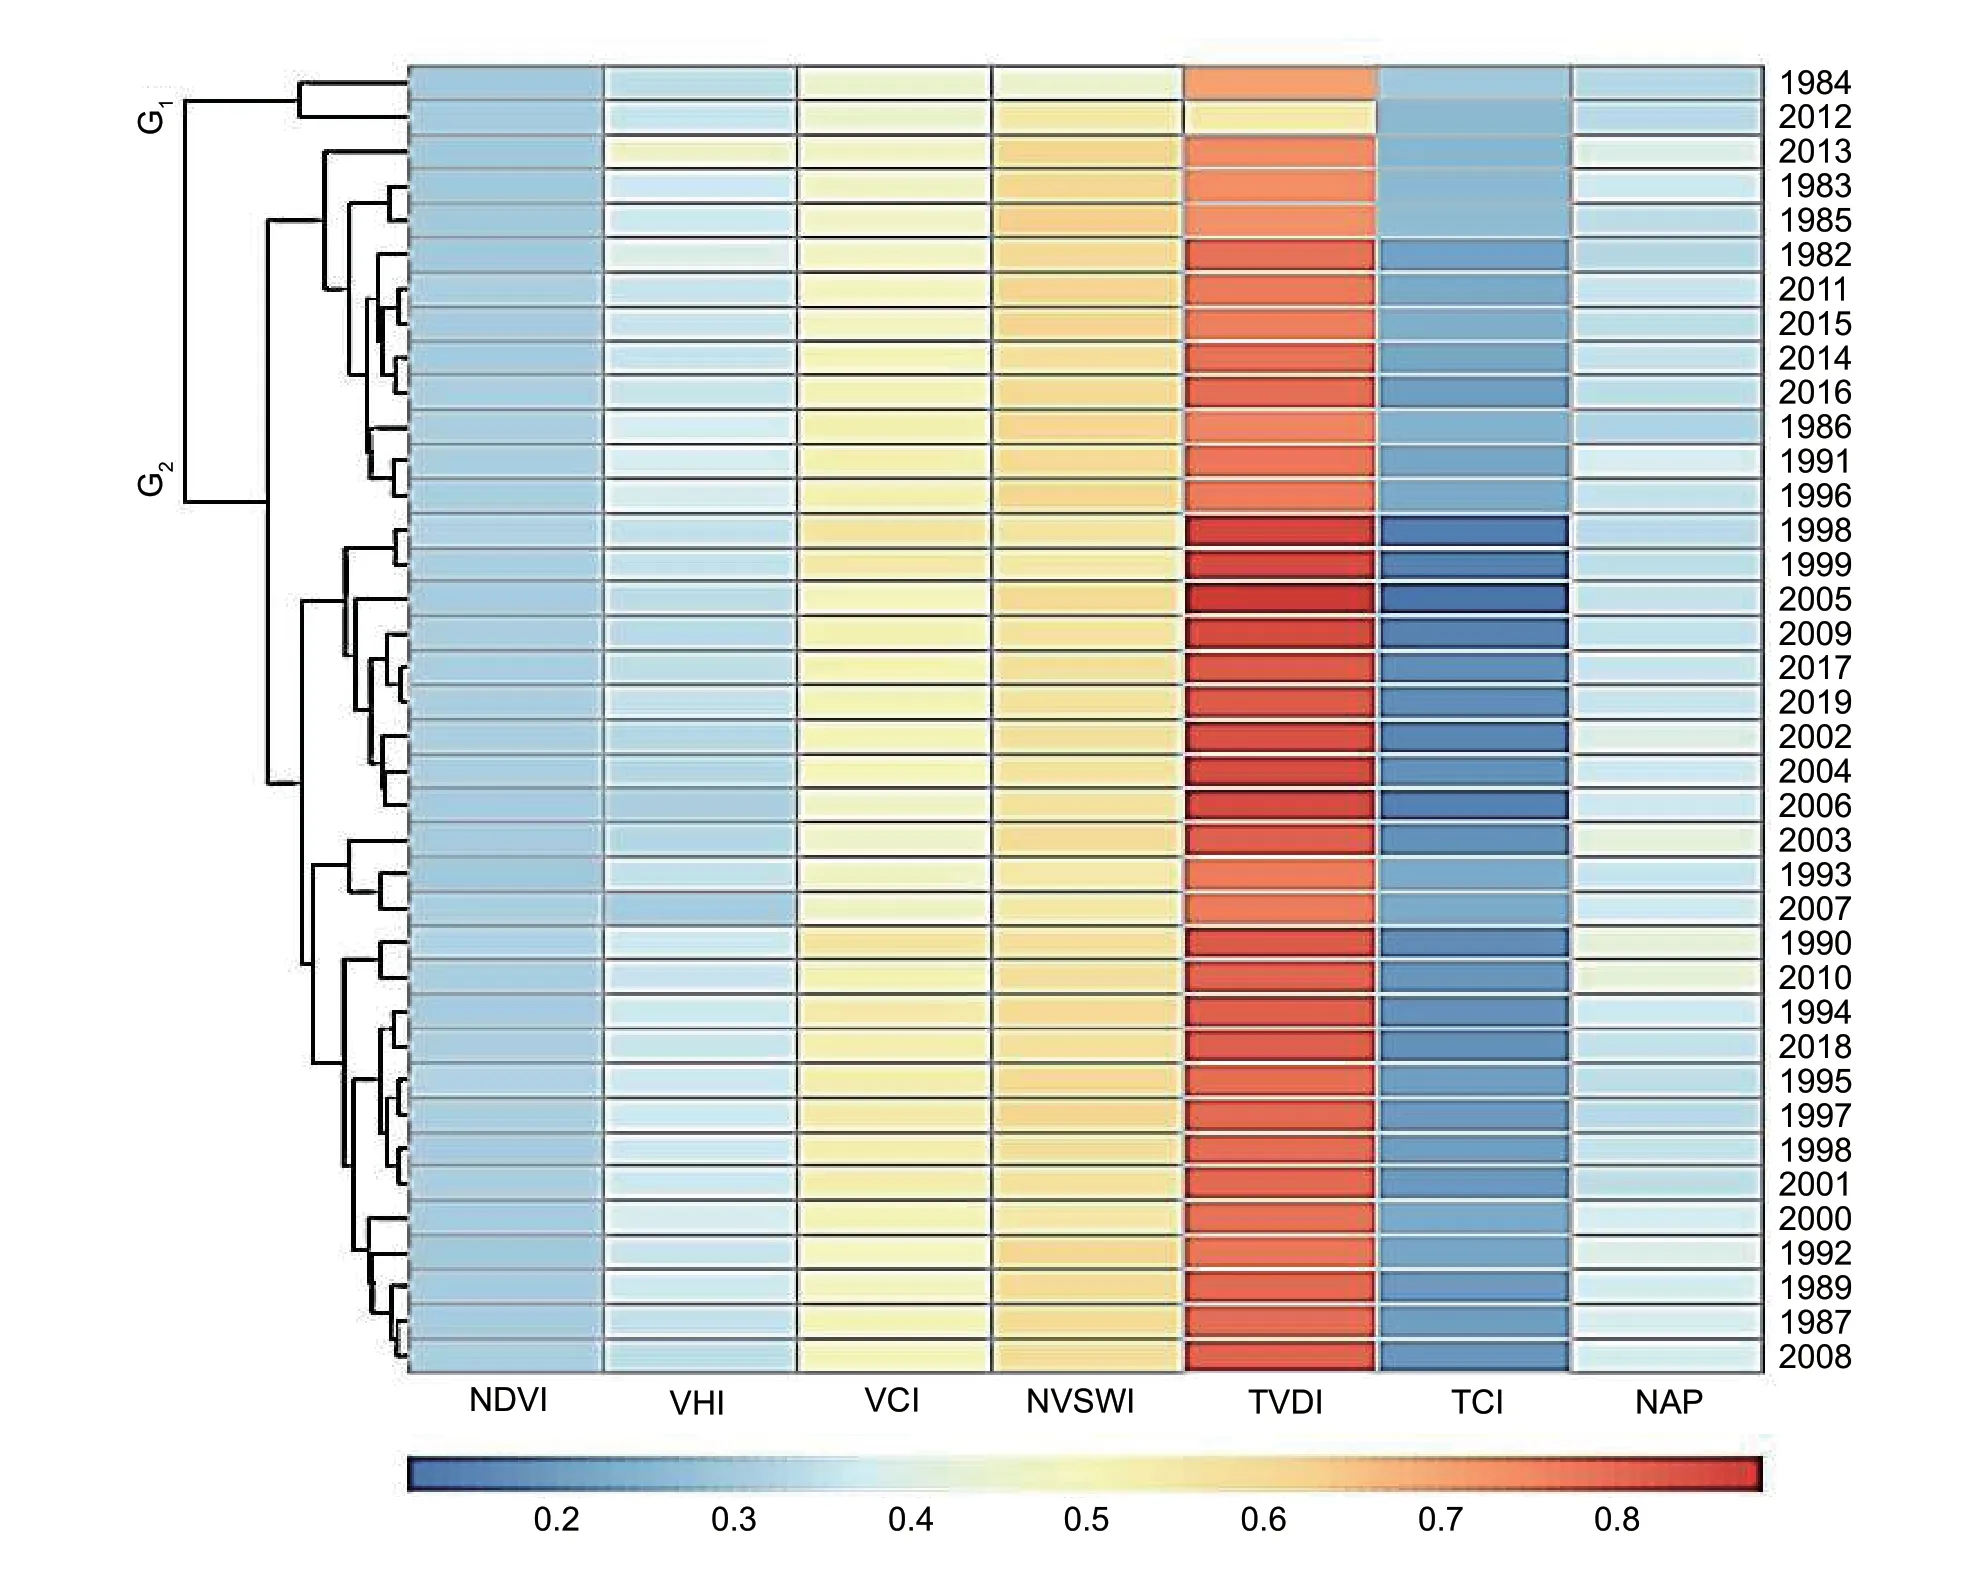
Fig.5 Heat map of the drought indexes obtained by the normalized difference vegetation index (NDVI),vegetation health index(VHI),vegetation condition index (VCI),normalized vegetation supply water index (NVSWI),temperature vegetation drought index(TVDI),temperature condition index (TCI) and normalized monthly precipitation anomaly percentage (NAP). G1,the first group;G2,the second group.
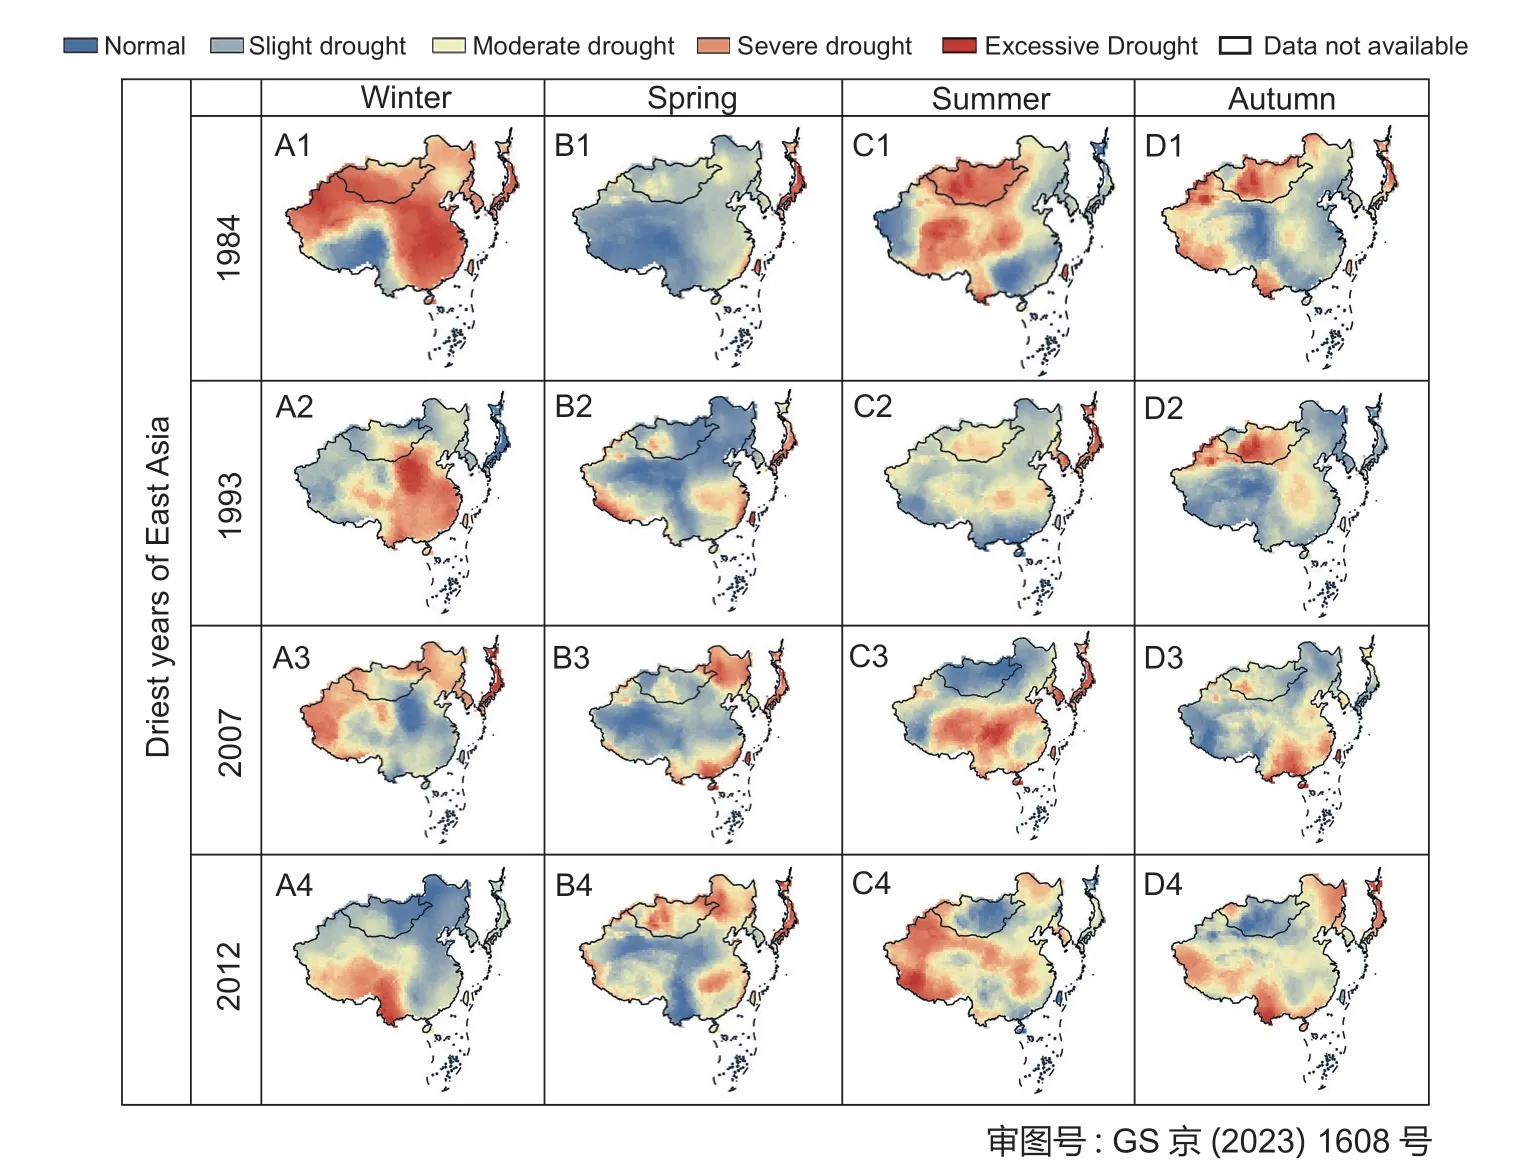
Fig.8 Spatial distribution of seasonal average temperature vegetation drought index (TVDI) values over East Asia during the years 1984,1993,2007,and 2012. A1–A4,winter (December,January and February). B1–B4,spring (March,April and May). C1–C4,summer (June,July and August). D1–D4,autumn (September,October and November).

Fig.9 Spatial distribution of seasonal average monthly precipitation anomaly percentage (NAP) values over East Asia during the years 1984,1993,2007,and 2012. A1–A4,winter (December,January and February). B1–B4,spring (March,April and May).C1–C4,summer (June,July and August). D1–D4,autumn (September,October and November).
3.4.Evaluation of the seasonal averages of NDVl,NVSWl,TVDl,and NPA in East Asia
The classification scheme of Rouseet al.(1974) was used during this study to define the drought trends. The NDVI,NVSWI,and TVDI values were divided into five categories (Tables 1–3): excessive,severe,moderate,mild and normal drought (Figs.6–9). The seasonal averages of the four extreme drought years (1984,1993,2007,and 2019) were selected to monitor trends in seasonal drought and vegetation changes. The NDVI is a numerical notation for vegetation assessment,originally used by Jainet al.(2010),and the NDVI values ndicate drought or non-drought climates. The drought severity can be expressed by determining the deviation between the present NDVI and the normal situation (Rouseet al.1974). In the current study,we used monthly NDVI to examine the seasonally averaged NDVI. The NDVI has zero values,indicating low vegetation,which is associated with arid regions. The NDVI,NVSWI,TVDI,and NPA seasonal values were also determined to classify the East Asian region. The mean NDVI was produced seasonally during the study period,showing severe arid regions in the northwestern part of East Asia.Zhaoet al.(2018) also confirmed that East Asia has a severe drought during winter. However,monsoon rains start in summer,providing sufficient soil moisture for plant growth,and there is no water shortage in autumn,except in Mongolia and the northwestern part of China.During the East Asian summer,the NDVI,NVSWI,TVDI,and NPA were at their maximum values. From spring to summer,the distribution of NDVI,NVSWI,TVDI,and NPA values showed an improving trend,while the autumn season again showed higher values compared with the winter season in East Asia. The TVDI and NVSWI indicated that drought intensified in different seasons in the north and south of East Asia,while the NPA indicated exactly the opposite,which might be the effect of the high LST values. Due to the irregular patterns of rainfall,the distribution of NPA is also not uniform. The NVSWI and TVDI maps show that East Asia is very dry in the winter and autumn seasons. In fact,many studies have used VSWI to monitor drought (Jainet al.2010;Abbaset al.2014). The NVSWI,normalized based on the VSWI,is a more objective indicator than the original VSWI (Abbaset al.2014). Many studies also used the NVSWI to study vegetation dynamics (Jacksonet al.2010;Huanget al.2017). The NVSWI is usually based on the VSWI,which is suitable for use over a large area (Songet al.2014).The NDVI,NVSWI,NAP,and TVDI indices are the most acceptable as the test indicators. The reasonably cooler temperature in spring can also adversely affect vegetation growth (Zhanget al.2016). Therefore,trends in drought and vegetation changes are closely related to fluctuations in the spatial distributions of rainfall,NDVI and temperature over the East Asian region.
3.5.Drought change trend and distribution in East Asia during 1982–2019
Figs.3 and 4 show the distribution and frequency of occurrence of droughts during 1982–2019 in East Asia,and they show no obvious regularity. Fig.10 shows the distribution of drought slopes in the East Asian region.Over the past 37 years,drought levels have declined in eastern Mongolia,southeastern China,North Korea,South Korea,and Japan. However,most of southwestern Mongolia and northwestern China were more frequently affected by drought from 1982 to 2019. In addition,the drought frequency in East Asia from 1982 to 2019 was determined using NVSWI data (Fig.11). The drought frequency was the highest in 1993 (85.9%),followed by 1982 (84.2%),which was consistent with 1993 being the year with both the least rainfall and the worst drought.The least frequent occurrence of drought was in 2010(69.9%),possibly due to higher precipitation. The slope of the fitted line was negative with a value of–0.0022,which indicates that the drought frequency from 1982 to 2019 generally showed a decreasing trend. The time lag is expected to be different in each of the climate zones due to their unique main vegetation types with different capacities for water storage (Abbaset al.2014).The trend of drought frequency shows that it was the highest in 1982,1993,2007,and 2012 (Fig.11),which is consistent with the results in Figs.3 and 4. Derived indices have been shown to be highly correlated with the spatiotemporal monitoring of drought (Huanget al.2015). Overall,drought trends are closely related to vegetation changes in East Asia. Liet al.(2019) found that the drought in southern Mongolia was more severe than that in eastern Mongolia,which is consistent with the results shown in Fig.11. Our results are consistent with the study of Conget al.(2017),which also found that a declining trend of drought occurred in the northeastern region of China.

Fig.11 Frequency of drought occurrence in East Asia for the period of 1982 to 2019.
3.6.PCA and correlation analysis
PCAThe four principal component counts characterize the total variance from the data (Fig.12). The first component (PC1) represents a vector inn-dimensional space that is linked to the largest change in the vegetation and drought indexes. In the data set analyzed here,the PC1 represented a vector that accounts for 54.4% of the total variance,while the second component (PC2) represented a vector that reflects the largest change of 16.7% of the total variance in the same parameter plane. Component load graphs show numerous groupings of NDVI,NVSWI,and NAP;TVDI and VCI;and VHI and TCI. Fig.13 shows theR2values among NDVI,VHI,NPA,TVDI,TCI,VCI,and NVSWI. Zribiet al.(2016) mentioned that dry-land regions are one of the more sensitive regions to climate change,and the increases in temperature,ET,and developing human activities will intensify the risk of land degradation. Therefore,it is necessary to understand the correlations between the vegetation and climate elements (Vicente-Serranoet al.2010;Lehneret al.2017).
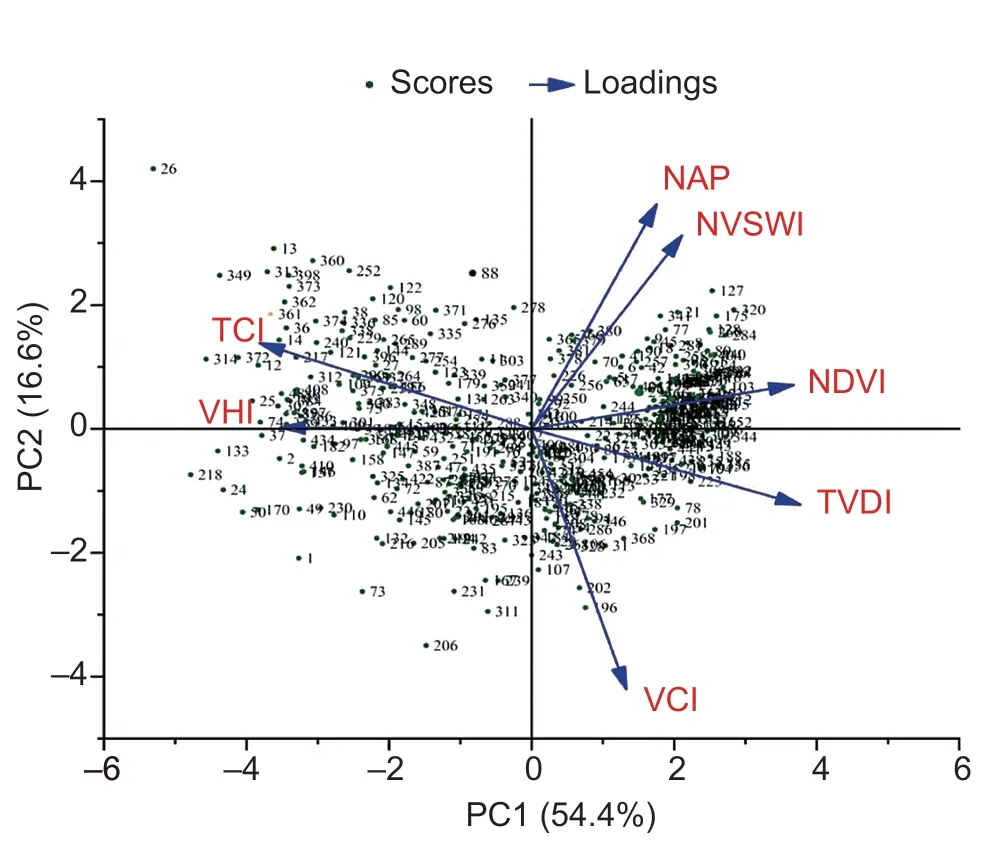
Fig.12 Principal component (PC) analysis of the drought indexes. VHI,vegetation health index;NDVI,normalized difference vegetation index;NAP,normalized monthly precipitation anomaly percentage;TVDI,temperature vegetation drought index;VCI,vegetation condition index;TCI,temperature condition index;NVSWI,normalized vegetation supply water index.
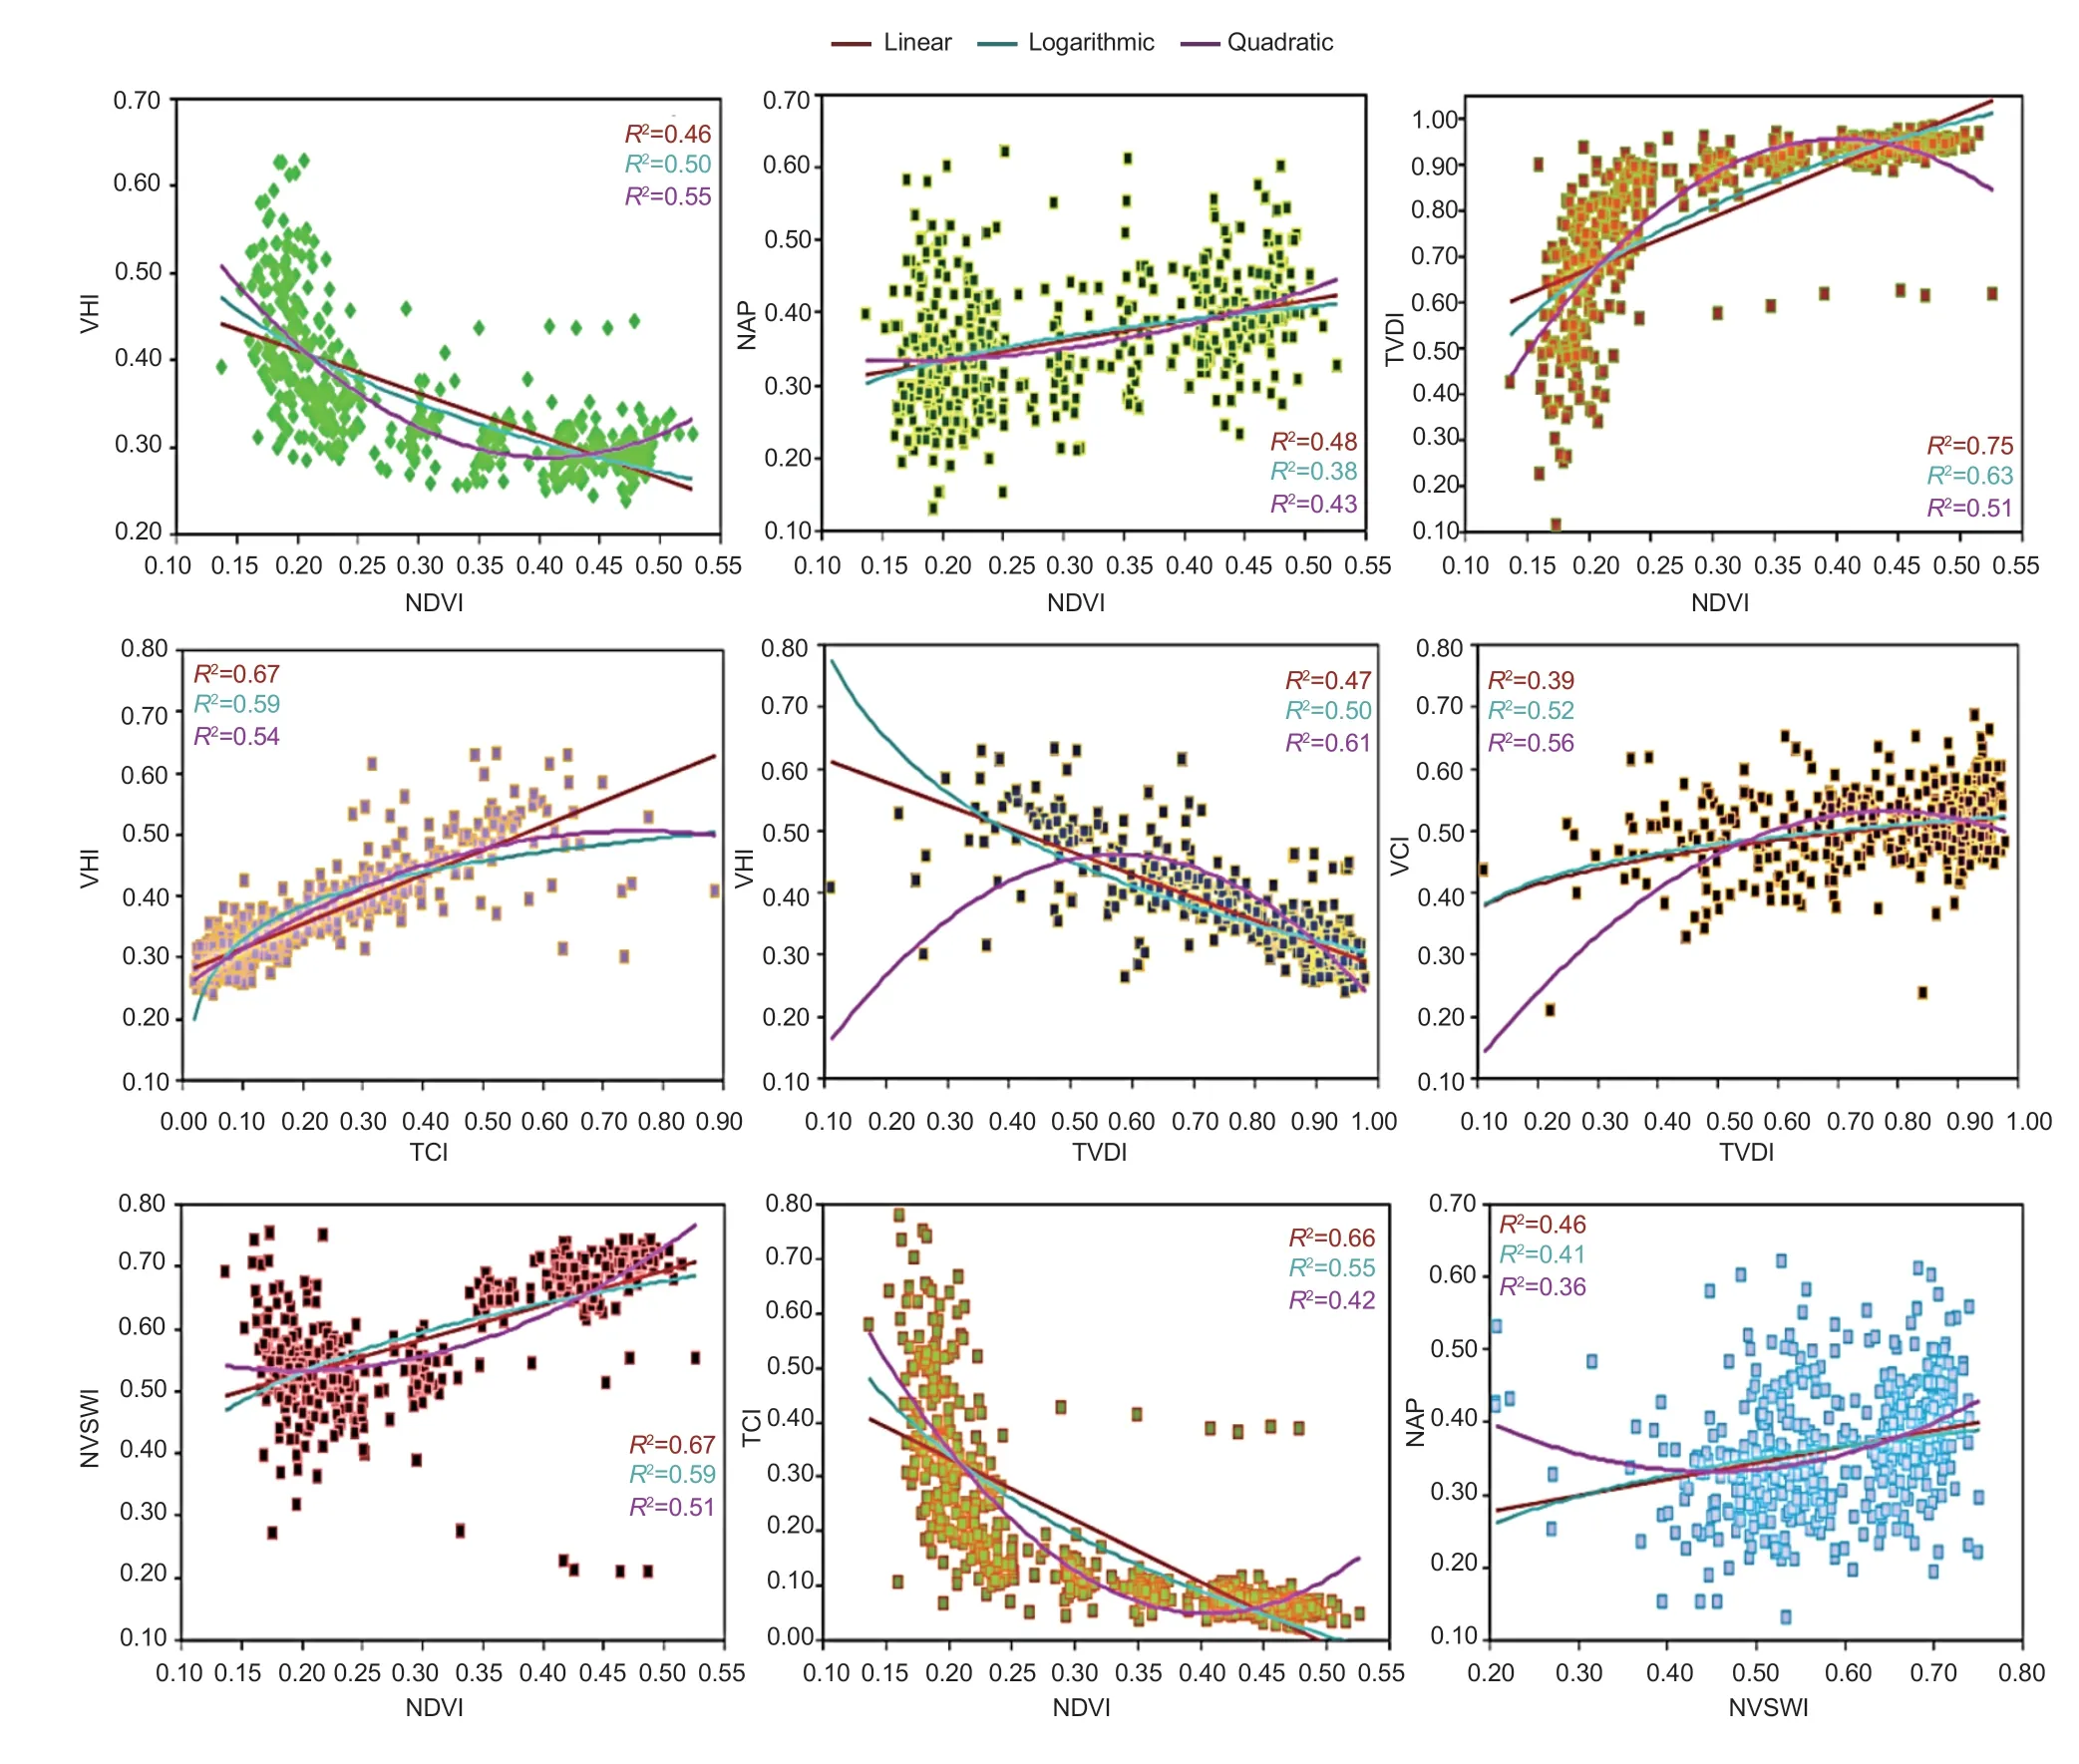
Fig.13 Regression relationships of the drought indexes. NDVI,normalized difference vegetation index;VHI,vegetation health index;NAP,normalized monthly precipitation anomaly percentage;TVDI,temperature vegetation drought index;VCI,vegetation condition index;NVSWI,normalized vegetation supply water index;TCI,temperature condition index.
Correlation analysisThere is a nonlinear relationship between the indices,so a “goodness-of-fit” test was used to find a suitable nonlinear model (Onyuthaet al.2017;Kalisaet al.2019). The “goodness of fit” test results showed that logarithmic and quadratic are the most suitable nonlinear models. Therefore,both non-linear and linear models were used to calculate the relationship between the various drought indices. A highR2value was obtained for the quadratic correlation among the NDVI with VHI,and TVDI with either VHI or VCI,which gaveR2values of 0.55,0.61,and 0.56,respectively. For linear models,highR2values of 0.48,0.75,0.67,0.66,0.65,and 0.46 were obtained for correlations among NDVI with NAP,TVDI,NVSWI and TCI;VHI with TCI;and NVSWI with NAP. Overall,the non-linear model showed the best fitting (Fig.13). The pairs of the NDVI and NAP,NDVI and TVDI,TCI and VHI,TVDI and VCI,NDVI and NVSWI,and NVSWI and NAP indexes were considerably positively correlated. However,the NDVI and VHI,TVDI and VHI,NDVI and TCI,vegetation and drought indexes were significantly negatively correlated.
4.Conclusion
The remote sensing data were examined by several vegetation and drought indices,such as NDVI,NVSWI,TVDI,and NAP,to monitor the impacts of vegetation and drought on seasonal vegetation variations over the East Asian region from 1982 to 2019. Except for VHI and TCI,the other indices such as NDVI,NVSWI,TVDI,and NAP rose rapidly from January to August,were stable in September,recovered in October,and showed descending trends in December. Monthly and seasonal analyses of NDVI,NVSWI,TVDI,and NAP,and heat maps confirmed that East Asia suffered severe droughts in the study years 1984,1993,2007,and 2012. The drought frequency slope was used to describe the variation in drought events from 1982 to 2019. Most of the northwestern region of East Asia suffers from drought during the winter season.During the summer season,our results suggest that the northern region of East Asia is more prone to drought than the southern regions. The variation of the drought trend was apparent among the different parts of the region,and the overall frequency of drought was decreasing from 1993 to 2019. These findings are important for future planning purposes,and serve as a basis for the mitigation of future drought risk events. Therefore,it is essential to mention that the proposed methodology could be adapted,for other regions,with appropriate adjustments.
Acknowledgements
This work was supported by the Basic Research Project of Zhejiang Normal University,China (ZC304022952),the China Postdoctoral Science Foundation Funding(2018M642614),and the Natural Science Foundation Yo uth Pr oject o f Sh a nd o ng Prov in ce,Chin a(ZR2020QF281).
Declaration of competing interest
The authors declare that they have no conflict of interest.
杂志排行
Journal of Integrative Agriculture的其它文章
- The association between the risk of diabetes and white rice consumption in China: Existing knowledge and new research directions from the crop perspective
- Linking atmospheric emission and deposition to accumulation of soil cadmium in the Middle-Lower Yangtze Plain,China
- Genome-wide association study for numbers of vertebrae in Dezhou donkey population reveals new candidate genes
- Are vulnerable farmers more easily influenced? Heterogeneous effects of lnternet use on the adoption of integrated pest management
- lnfluences of large-scale farming on carbon emissions from cropping:Evidence from China
- Optimizing water management practice to increase potato yield and water use efficiency in North China