Linking atmospheric emission and deposition to accumulation of soil cadmium in the Middle-Lower Yangtze Plain,China
2023-10-16TANGLiliFUBominWUYangCAIFuchenMAYibing
TANG Li-li,FU Bo-min,WU Yang ,CAI Fu-chen,MA Yi-bing
National Observation and Research Station of Coastal Ecological Environments in Macao,Macao Environmental Research Institute,Macau University of Science and Technology,Macao SAR 999078,P.R.China
Abstract Cadmium (Cd) is one of the most toxic heavy metals in the environment. Atmospheric deposition has been found to be the main source of Cd pollution of soil on a large scale in China,and identification of the relationships between anthropogenic emission,atmospheric deposition,and Cd accumulation in soil is important for developing ways to mitigate Cd non-point pollution. In this study,the relationship between atmospheric emission,atmospheric deposition,and soil Cd accumulation in the Middle-Lower Yangtze Plain in China was investigated using datasets of atmospheric emission,deposition,and soil accumulation from the literatures published between 2000 and 2020. The results showed that the soil Cd accumulation rate in the study area exceeded the national average (4.0 µg kg–1 yr–1) and continued to accumulate in recent decades,although the average accumulation rate decreased from 9.45 µg kg–1 yr–1 (2000–2010 period) to 8.86 µg kg–1 yr–1 (2010–2020 period). The contribution of atmospheric deposition flux to Cd increment in the soil was in the range of 22–29%,with the atmospheric deposition flux decreasing from 0.54 mg m–2 yr–1 (2000–2010) to 0.48 mg m–2 yr–1 (2010–2020),both values being greater than the national average. Atmospheric Cd deposition and emission were highly correlated in a provincial administrative region,which is close to a ratio of 1.0. Emission factors may be in a state of dynamic change due to the influences of new Cd emission control technologies and environmental policies.As the main sources of Cd emissions,dust,and smoke emissions per ton of non-ferrous metal production decreased by 64.7% between the 2000–2010 and 2010–2020 periods. Although new environmental policies have been instigated,atmospheric emission of Cd is still excessive. It was hoped that the findings of this work would provide a scientific basis for the rational control of atmospheric emissions and Cd pollution of soil.
Keywords: cadmium,soil accumulation,atmospheric emission,atmospheric deposition
1.Introduction
Soil is one of the fundamental resources for food crop production and human survival (Dhaliwalet al.2020;Xieet al.2020). As a consequence of industrialization,heavy metals enter the soil in different ways,which results in heavy metal contamination and impacts soil functioning(Kruminset al.2015;Zhaoet al.2019). Among heavy metals,cadmium (Cd) is the greatest threat to the safety of food crops (Wagner 1993;Fenget al.2019). The content of Cd in the soil is still increasing in China. According to the input–output balance of soil Cd concentration reported by Luoet al.(2009),Cd needs a shorter time (50 years)to reach theSoil Environmental Quality-Risk Control Standard for Soil Contamination of Agricultural Land(GB 15618-2018 2018) (0.3 mg kg–1when pH≤7.5) than other heavy metals which need at least 389 years. Studies of the accumulation characteristics of Cd in soil are necessary to better prevent and control soil Cd pollution.
Atmospheric deposition is the main large-scale source of Cd in soil in China (Huet al.2016;Ni and Ma 2018;Penget al.2019). Luoet al.(2009) and the same group(Ni and Ma 2018) studied the contribution of atmospheric deposition of Cd to the soil input–output balance from 1999 to 2015,and found it accounted for 34.8 to 77.1%of total Cd input. The variation was due to other input sources to the soil declining sharply over the period while atmospheric deposition increased slightly. Wanget al.(2021) found that higher Cd input flux from atmospheric deposition resulted in higher Cd bioavailability in soil and more Cd accumulation in rice,and that the newly deposited Cd contributed 7.35 to 41.23% in rice tissues.As a large amount of Cd accumulates in crops,they provide substantial Cd for human consumption (Wagner 1993;Fenget al.2019).
The sources of Cd in the atmosphere are divided into anthropogenic and natural sources (Nriagu 1979;Wuet al.2020). Anthropogenic sources,including fossil fuel combustion,mining activities,metal smelting,and other industrial activities,are considered to be the main sources of Cd in the atmosphere (Shiet al.2012;Wuet al.2013;Chenget al.2014;Chenet al.2019;Luet al.2019;Penget al.2019). The anthropogenic sources of Cd have a certain spatial heterogeneity,which is affected by the level of economic development and industrial structure (Penget al.2019). Nationally in China,coal combustion is the main source of Cd in the atmosphere (Shaoet al.2016;Chenet al.2019). However,in active mining regions with serious Cd pollution,non-ferrous metal smelting has been found to be the largest source of Cd emissions to the atmosphere,especially in Central and eastern China(Pacyna and Pacyna 2001;Tianet al.2015). In addition,the Cd emission inventories in China have shown that non-ferrous metal smelting discharged the most Cd into the atmosphere in industrial cities (Tianet al.2015;Shaoet al.2016;Luet al.2019;Zhanget al.2019;Wuet al.2020). For example,in Hunan,large amounts of Cd were found to be released into the environment during the production of non-ferrous metals,resulting in farmland soil pollution (Shiet al.2019). Such pollution often leads to excessive Cd in rice crops (Bruset al.2009;Huet al.2016;Liu Xet al.2016).
In recent years,the improvement of environmental awareness and industrial emission reduction technology has affected the heavy metal emissions of various industrial activities (Chenget al.2015). Especially after 2010,a series of policies were promulgated to reduce the contaminants in the atmosphere in China.Although there was no direct strict limit on Cd emissions in these policies,Cd emissions decreased,along with emissions of other contaminants. As reported by Liuet al.(2021),the emissions of 11 heavy metals were reduced by 20.1% from 2012 to 2015. Despite this,soil Cd contamination has not been effectively controlled(Huet al.2020). This may be due to the lack of understanding of the relationships between emissiondeposition and deposition-soil accumulation. Emission can affect the deposition of Cd,and the Cd concentration in soil increases with deposition timescales (Pandey and Pandey 2009;Ni and Ma 2018;Fenget al.2019).Therefore,it is necessary to investigate the relationship between atmospheric deposition and Cd emissions at the same temporal and spatial scales,as well as explore the increasing trend of soil Cd concentrations. The Middle-Lower Yangtze Plain (MLYP) has vast and fertile farmland areas and is one of the main rice-producing areas in China. The area includes Hunan,Hubei,Jiangxi,Anhui,Jiangsu,Zhejiang provinces,and Shanghai Cty. With the acceleration of industrialization and urbanization,this area has become an area with a fragile ecological environment(Houet al.2014). It has been reported that the area has suffered from serious heavy metal pollution,especially from Cd,and 10% of rice exceeds the health standard for Cd (Liu Zet al.2016). To date,the temporal and spatial variation characteristics of Cd in the atmospheric emission–atmospheric deposition–soil accumulation system in the MLYP have not been investigated.
In this study,the MLYP was taken as the research area. The aims of the study were: (1) to find the causes of temporal and spatial variation in Cd levels in soil by collating Cd concentration data in the literature in soil samples taken in the last 20 years;(2) to analyze the various characteristics of atmospheric deposition fluxes in 2000–2010 and 2010–2020 by collecting Cd atmospheric deposition flux data recorded in the literature in the last 20 years;(3) to estimate the atmospheric emissions of Cd to better analyze the temporal and spatial variation characteristics of atmospheric deposition;and (4) to analyze the interconnection between atmospheric emission,deposition and soil accumulation of Cd. It was hoped that this work would provide a scientific basis for the prevention and control of Cd soil pollution,and supply a reference for the formulation of Cd reduction policies.
2.Materials and methods
2.1.Concentration of Cd in soil
To examine the effect of atmospheric deposition on soil Cd accumulation,data on Cd concentrations in soil were collected. As shown in Appendix A,the soil data were derived from the upper layer (0–20 cm) of soils far from pollution areas. Other data screening procedures are referred to Huet al.(2020). The data were gathered from scientific databases,including the CNKI database,Wanfang database,ISI Web of Science,Google Scholar,and Science Direct databases. Details of the data sources are listed in Appendix B.
The retrieval time was divided into two periods,2000–2010 and 2010–2020,and the arithmetic mean was calculated for each region for each period. The data belonged to which period were determined by the sampling year of the research papers,and if an article did not specify the sampling year,data were allocated the year of publication year minus 2. The soil Cd concentration data for 1990 are from Weiet al.(1990),and the data for 2005 and 2015 are represented by the average value of soil Cd concentration recorded in relevant articles published in 2000–2010 and 2010–2020,respectively.
The inputs of Cd deposition to agricultural soils were calculated as follows:
whereφis the input of Cd to agricultural soil from atmospheric deposition per year (mg kg–1yr–1);ADFis the atmospheric deposition flux of Cd (mg m–2yr–1),andMis the mass per square meter at a depth of 0–20 cm (kg m–2).Mis calculated as follows:
whereρis the density of soil (g cm–3). According to Zhu(1983),the soil bulk density of the general tillage layer is 1.05–1.35 g cm–3,so the median soil bulk density used here is 1.2 g cm–3;Vis the depth of soil (0.2 m);1 000 is a conversion unit. The value ofMin the study was calculated as 240 kg m–2. The impact of atmospheric dust on the mass of soil per square meter (kg m–2) can be ignored because its impact was not within the range of significant figures of soil mass in this study. The particles deposited from the atmosphere to soil were small and had little influence on Cd deposition. Therefore,the impact of atmospheric dust onMis not considered.
The average annual Cd concentration increase in soil was calculated as follows:
whereCiis the average annual Cd concentration increase in the soil (mg kg–1yr–1),CmandCcare used as the average concentrations of Cd in 2000–2010 or 2010–2020 or the background value (mg kg–1). WhenCmwas the period of 2000–2010,Ccwas the background value;whenCmwas the period of 2010–2020,Ccwas the period of 2000–2010.
2.2.Atmospheric deposition
Examination of the temporal and spatial transformation characteristics of the atmospheric deposition of Cd was focused on the agricultural areas in MLYP. Atmospheric deposition data from non-polluted farmland areas were collected from scientific databases. The sources of atmospheric deposition data are listed in Appendix C,but no suitable deposition data for Jiangxi Province were collected. The screening procedures for atmospheric deposition flux data are given in Appendix D. The collected data were divided into two periods,2000–2010 and 2010–2020,and the arithmetic mean was calculated for each region for each period.
2.3.Atmospheric emission
The industrial dust emission sources of Cd consist of coal combustion,non-ferrous metal smelting,iron and steel smelting,municipal solid waste combustion,construction,biomass burning,liquid fuel,brake,and tire wear(Appendix E) (Shaoet al.2013;Chenget al.2014;Tianet al.2015;Liuet al.2021).
Cd in coal is released into the environment during coal combustion despite the use of various dust removal devices. From Shaoet al.(2013) and Chenget al.(2014),the calculation formula for Cd emissions from coal combustion is as follows:
whereE(t) is the annual atmospheric emission of Cd (g);Cj(t) is the average concentration of Cd in coal (mg kg–1);Aj(t) is the amount of annual coal consumption (t);Fjis the fraction of Cd in flue gas (%);PPM(j)(t) andPFGD(j)(t)are the fractions removed by the existing dust collectors and flue gas desulfurization devices (%),respectively;tis the statistical year,andjis the industrial sector of coal combustion. The detailed data,including each factor,are from Shaoet al.(2013) and Tianet al.(2015).
The emission of Cd from other sources was estimated by the following equation (Liuet al.2021):
whereAiis the annual production output or consumption of industrial producing processes (t),including non-ferrous metal smelting,iron,and steel smelting,construction material production,etc.;Fiis the assumed average emission factor (g t–1);tis the statistical year,andiis the specific emission source. The detailed data for each source and factor are listed in Appendices F and G.
The Cd emissions from brake and tire wear were estimated by the following equation,which is from Tianet al.(2015):
wherePi,jis the number of vehicles in listj(private car and civil car) in regioni;Mjis the average annual mileage driven by vehicles in listj;EFj,kis the emission factor of TSP for brake or tirekby vehicles in listj;andCkis the average concentration of Cd in brake or tirek.
2.4.Uncertainty analysis
To gain insight into the uncertainty of soil Cd concentration,emission,and deposition estimates,an uncertainty analysis was performed using the Monte Carlo simulation. Due to the regional characteristics of Cd concentrations in deposition and soil,it was assumed that soil heavy metal concentration and deposition approximately follow a log-normal distribution with a coefficient of variation of 20% (Chenet al.2019;Huanget al.2020). While the Cd emission was calculated based on industrial dust emission sources,the parameters used in estimating the emission followed a normal distribution with a coefficient of variation of 10% in performing the Monte Carlo simulation (Tianet al.2012;Chenget al.2014). A total of 10 000 Monte Carlo simulations were performed to obtain the mean and 95% confidence interval.
3.Results and discussion
3.1.Characteristics of Cd in soil
Temporal and spatial variations in soil Cd concentration in 1990,2005,and 2015 are shown in Fig.1,and the detailed soil Cd concentrations are shown in Table 1. In 1990,the background concentration in 1990 of Cd in soil was lower than 0.2 mg kg–1in the seven MLYP regions(including Shanghai City). The soil Cd concentration in Hubei Province had the highest background value(0.172 mg kg–1). From 2000 to 2010,the soil Cd concentration in Hunan Province increased rapidly,surpassing that in Hubei Province,reaching and even exceeding 0.5 mg kg–1in 2000–2010 period with an accumulation rate of 29.2 µg kg–1yr–1from 1990 to 2005.Soil Cd concentrations in other regions increased but did not exceed 0.3 mg kg–1,and had accumulation rates of 3.87–8.73 µg kg–1yr–1between 2000 and 2010. From 2010 to 2020,soil Cd concentrations in the seven regions further increased to 0.258–0.727 mg kg–1,which was 2–5 times greater than in 1990 and 1–2 times greater than in 2000–2010 period. The increase in soil Cd concentrations in the MLYP regions far exceeded the national average increase rate of 4.0 µg kg–1yr–1(Luoet al.2009;Ni and Ma 2018). Even Shanghai City,Hunan and Hubei provinces had soil Cd concentrations that exceeded 0.3 mg kg–1(the farmland criterion of GB 15618-2018(2018) when pH≤7.5),faster than the 50 years expected by Luoet al.(2009).
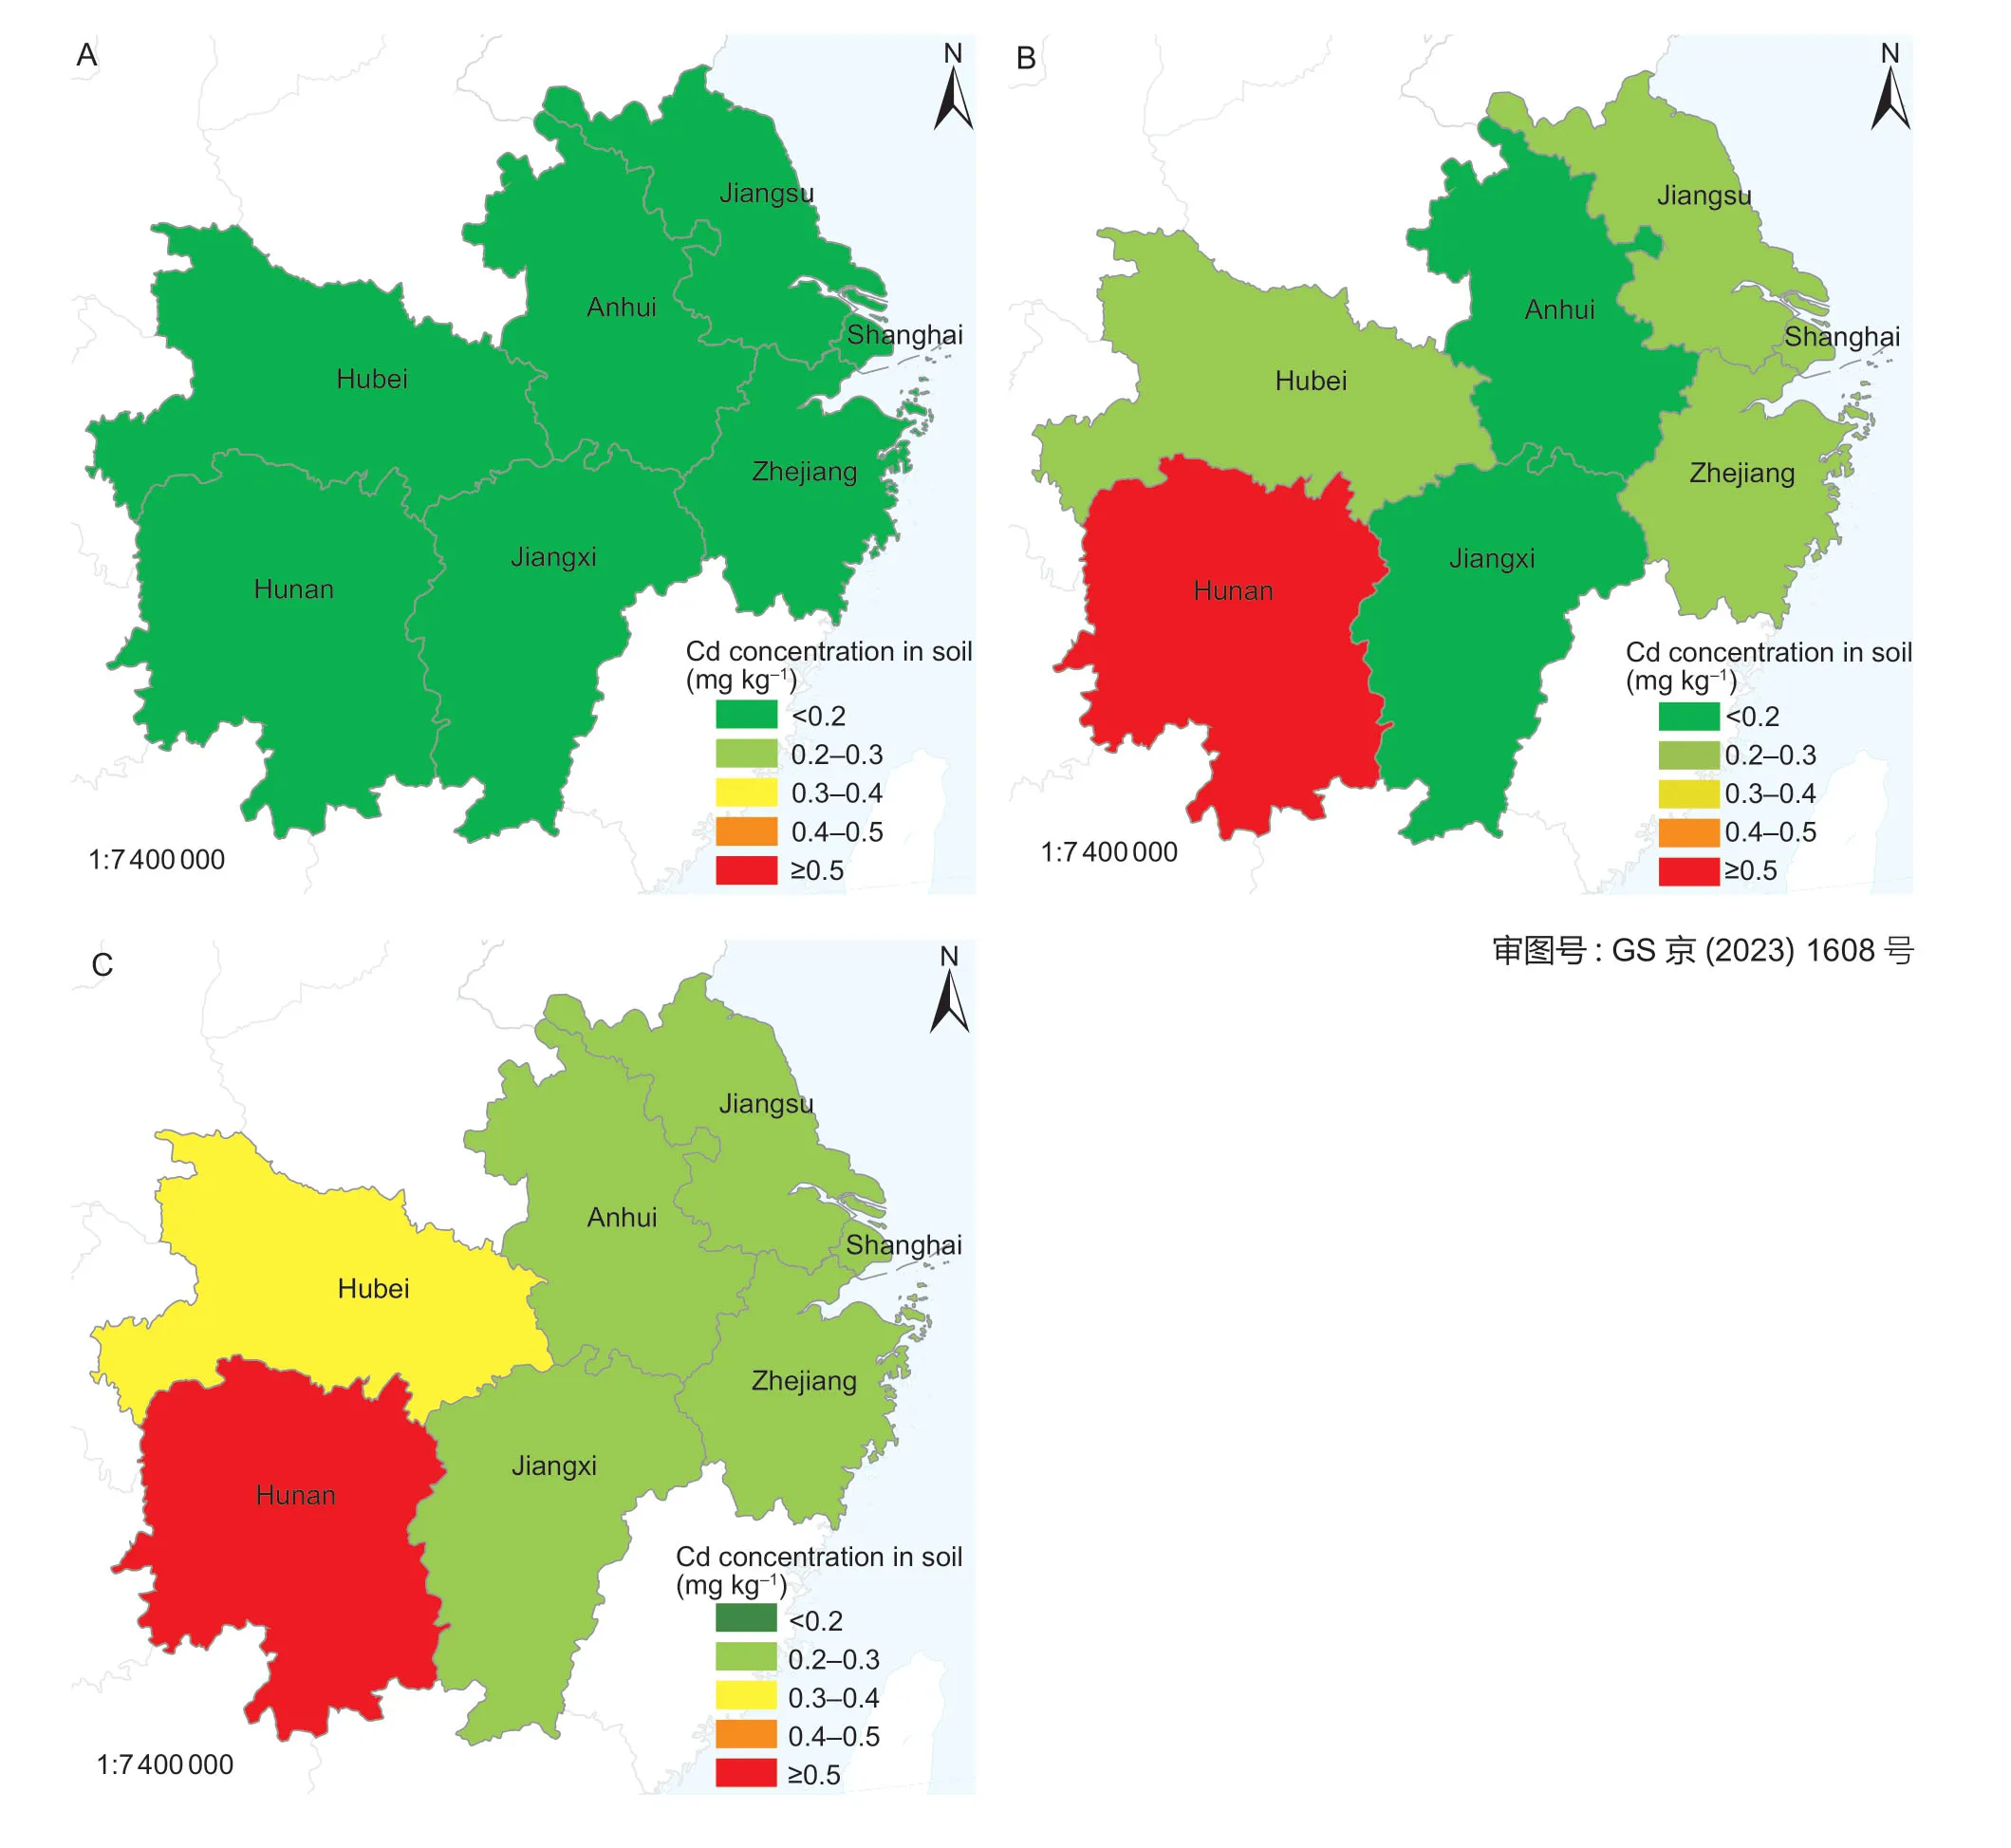
Fig.1 Soil Cd concentrations in seven regions in the Middle-Lower Yangtze Plain,China in different years.A,1990.B,2000.C,2015.
3.2.Characteristics of Cd in atmospheric deposition
The atmospheric deposition fluxes of the seven MLYP regions for each period are shown in Table 2. Insufficient samples were available for Shanghai City and Jiangxi Province,and atmospheric depositions for these regions are therefore not discussed in this study. The average atmospheric deposition of Cd in China from 1999 to 2015 was 0.41 mg m–2yr–1(Ni and Ma 2018). The deposition of Cd in Hunan Province,1.77 mg m–2yr–1in 2000–2010 period and 0.86 mg m–2yr–1in 2010–2020 period,was much higher than for China as a whole,while that for the remaining four provinces was lower. The Cd atmospheric deposition fluxes for Zhejiang,Jiangsu,and Anhui provinces in 2010–2020 period were similar to the 2000–2010 period,while the deposition fluxes for Hunan and Hubei provinces decreased significantly in 2010–2020. However,the Cd deposition for Hunan Province still exceeded the national average deposition level. In the study area,the average atmospheric deposition flux decreased from 0.54 mg m–2yr–1(2000–2010 period) to 0.48 mg m–2yr–1(2010–2020 period),which was caused mainly by the significant reduction in individual regions such as Hunan Province. However,Cd deposition for the MLYP regions is likely to be still higher than the national average atmospheric deposition fluxes,which ranged from 0.40 to 0.41 mg m–2yr–1for the periods between 1999–2006 and 2006–2015 (Luoet al.2009;Ni and Ma 2018).
3.3.Characteristics of Cd in atmospheric emission
Table 1 Average Cd concentrations in soil for the periods 2000–2010 and 2010–2020 and the annual contributions of atmospheric deposition fluxes to soil Cd concentrations in seven regions in the Middle-Lower Yangzte Plain,China1)
The atmospheric emissions of Cd were estimated by multiplying industrial production outputs or consumption with emission factors. The emission factors of nonferrous metal smelting are given in Pacyna and Pacyna(2001),and emission factors of other sources are given in Tianet al.(2012). The emission factors would be expected to decrease over time due to the development of industrial technology and the strict restriction of emissions. The emission factors of non-ferrous metal smelting activities,which contributed the most emissions,were modified to decrease by 64.7% in 2010–2020(Appendix G;details mentioned in Section 3.5). The atmospheric emissions of Cd in the seven regions showed an upward trend from 2000 to 2010 and then flattened or slightly decreased subsequently (Fig.2).The results indicate that the atmospheric emissions of Cd were not effectively controlled,especially in the non-ferrous metal industry which accounted for a large proportion of the emissions. The contributions of different industrial activities in each region to Cd emissions are shown in Table 3. Atmospheric Cd emissions decreased from 158.84 t yr–1in 2000–2010 period to 94.44 t yr–1in 2010–2020 period in Hunan Province and from 20.54 t yr–1in 2000–2010 period to 8.82 t yr–1in 2010–2020 period in Shanghai City. To reduce the Cd pollution risk,Hunan Province has taken a series of measures to reduce Cd emissions,but despite this,emissions were much higher than in other regions. The Cd emissions changed only slightly in the other five regions,indicating that the total amount of Cd emissions had not been effectively controlled. Except for coal combustion,Cd emissions from various industrial activities changed significantly in the two periods (Table 3). Although Cd emissions from non-ferrous metal smelting decreased,this industry still provided the largest source of Cd emissions in the MLYP regions. Therefore,more stringent policies need to be formulated to control Cd emissions from non-ferrous metal smelting industries.More emission reduction control should also be practiced in coal combustion and iron and steel smelting industries.

Fig.2 Annual Cd emission to the atmosphere from human activities in seven regions in the Middle-Lower Yangtze Plain in China (statistical data were missing in 2012).
3.4.The contribution of atmospheric deposition to Cd accumulation in soil
The input of Cd from atmospheric deposition to soil as calculated by eq.(1) was shown in Table 1. The annual contribution of Cd atmospheric deposition to soil was 1.31–7.38 µg kg–1from 2000 to 2010 and 1.27–3.60 µg kg–1from 2010 to 2020. Jiangsu,Zhejiang,and Anhui provinces had stable inputs over the period. The cumulative contribution of atmospheric deposition to Cd in soil decreased significantly in Hubei and Hunan provinces,from 1.63 to 0.96 µg kg–1yr–1and 7.38 to 3.60 µg kg–1yr–1,respectively,which followed the reduction in atmospheric deposition in the two provinces.
To further investigate the relationship between Cd atmospheric deposition and Cd concentration in soil,regression analysis was conducted (Fig.3). In the periods of 2000–2010 and 2010–2020,the coefficients of determination between atmospheric deposition fluxes and soil accumulation were 0.950 and 0.973,respectively,showing a close relationship between the two parameters. The linear slopes between atmospheric deposition fluxes and soil accumulation of Cd were 0.249 and 0.222,respectively,indicating that atmospheric deposition accounted for 24.9 and 22.2% of the increase in soil Cd concentrations in the periods from 2000 to 2010 and 2010 to 2020,respectively. Based on the average deposition fluxes and the average soil increment in Cd concentrations for all of the MLYP regions (calculated by deposition fluxes/soil increment),the contribution of Cd from deposition to soil increment was 29.1% from 2000 to 2010 and 21.7% from 2010 to 2020. The difference in results between the two calculation methods may be because the Cd in soil was mainly from sources other than deposition in Hunan from 2000 to 2010. Therefore,the contribution of Cd from deposition to the soil increment was 25 to 29% from 2000 to 2010 and approximately 22% from 2010 to 2020. However,this was opposite to the trend for the national contribution values (34.8% from 1999 to 2006 and 77.1% from 2006 to 2015) (Luoet al.2009;Ni and Ma 2018). The reason for the discrepancy may be that the study area is mainly a rice-producing area,and other sources of Cd,such as sewage irrigation,account for a large proportion of Cd inputs. Previous studies have shown that the main source of Cd in the farmland in the Yangtze River Delta is irrigation water(Houet al.2014;Shaoet al.2016). Therefore,there was a certain deviation between this study and the national contribution of atmospheric Cd deposition.

Fig.3 The correlation between the increased Cd in soil from atmospheric deposition and from total sources in the Middle-Lower Yangzte Plain,China.
3.5.The relationship between atmospheric emission and deposition
Non-ferrous metal smelting is the main source of Cd emissions to the atmosphere,and the emission factors of non-ferrous metal smelting for Asia are given in Pacyna and Pacyna (2001). The ratio of atmospheric deposition fluxes and emissions per unit area is shown in Table 4.From 2000 to 2010,the average ratio of atmospheric deposition fluxes and emissions was 1.34,which meant that the atmospheric deposition exceeded emissions by 34%. Among all regions,Hunan has the highest ratio of2.36,indicating great heterogeneity in deposition. This deviation may be related to the emission factors used in estimating emissions,leading to the underestimation of emissions. Further,due to the lack of sufficient reduction measures in the production process (Wen and Li 2014),the actual emissions of Cd were more than estimated.In addition,the distribution of Cd deposition is mostly of anthropogenic origin,disobeying a normal distribution,which may lead to deviation in the average Cd deposition estimate. The atmospheric Cd deposition was mostly affected by the cities with a large number of non-ferrous metal industries in Hunan,such as Chenzhou City. In order not to be affected by extreme values,the data around non-ferrous metal industries were not used,which led to an underestimate of deposition. The uncertainty analysis shows that the average ratio of 95% confidence interval was 0.97–5.30,indicating great uncertainty.After excluding Hunan,the average ratio of atmospheric deposition fluxes and emissions was 1.87,suggesting that the estimated emissions in the other four regions were equal to deposition. In addition,the uncertainty analysis showed that there was greater uncertainty of Cd atmospheric deposition in Anhui and Hunan provinces,leading to an increase in the uncertainty of the ratio. Cd in the atmosphere is in dynamic balance at the province level scale,i.e.,input equals output. The vertical transport processes of Cd were the emissions from various sources and wet or dry deposition,while the horizontal transport processes depended on meteorological conditions. Longdistance transportation across the regions would influence atmospheric deposition. However,the horizontal migration distance of Cd is not very great. For example,in a zinc-smelting area,more than 80% of atmospheric Cd was deposited within 10 km of the smelters (Xieet al.2014). Therefore,it is considered that within a provincial administrative region,the amount of horizontal transportation can be ignored,which means that the emissions are equal to the deposition in a province. The emissions of Cd estimated by the Asia smelter emission factors were reasonable for the MLYP regions in 2000–2010,except for Hunan. It is necessary to conduct a
more accurate analysis of the industrial structure and environmental protection levels of non-ferrous metal smelters in Hunan Province to obtain more accurate Cd emission data.
Table 3 Cd emission from human activities for seven regions for the periods 2000–2010 and 2010–2020 in the Middle-Lower Yangzte Plain,China
When the emission factors of 2000–2010 were applied to the calculation of non-ferrous metal smelter Cd emissions in 2010–2020,the ratio of atmospheric deposition fluxes and emissions per unit area in the MLYP regions ranged from 0.38 to 0.76,which showed a large overestimation in Cd emissions. Since 2010,a series of policies have been implemented to eliminate some enterprises with backward production procedures and promote advanced technology,such as the New Environmental Protection Law,the Clean Air Action Plan,and the Battle for Blue Sky Protection (Dinget al.2019;Zhanget al.2019). The emission factors are expected to change with the implementation of these policies and the development of industries. Cd emissions from nonferrous metal smelting activities mainly occur in a particlebound form in industrial dust and smoke from smelting processes (Liuet al.2022). The mass proportion of Cd on the droplet or particle was assumed to have remained unchanged. It was presumed that the emission factors of non-ferrous metal smelting industries decreased with the dust emissions per ton of non-ferrous metals smelted.The average industrial dust emissions per ton of nonferrous metals production in 2010–2020 accounted for 64.7% of Cd emissions in 2000–2010 (Fig.4). The emission factors were modified by multiplying them by 35.3%,based on the emission factors of non-ferrous metal smelting in 2000–2010. The average ratio of atmospheric deposition fluxes and emissions per unit area calculated after modifying the emission factors in the MLYP regions was 1.14 (0.98 excluding Hunan Cd emission),and Hunan Province always had the highest ratio of 1.94. The uncertainty range of its ratio was also around 1.0. Therefore,the modified emission factors of non-ferrous metal smelting were reasonable for the MLYP regions in 2010–2020. However,it is necessary to accurately adjust the emission factors based on the industrial structure and industrial emission level.
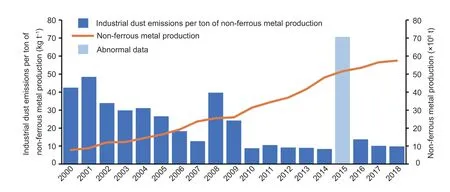
Fig.4 Non-ferrous metal production and industrial dust emissions per ton of non-ferrous metal production (data sources are listed in Appendix F).
Based on the relationship between atmosphericdeposition and emission,Cd emission factors have decreased over time because of many industrial measures and emission reduction policies. For example,the release of the “AirPollutionPreventionandControlAction Plan” in 2013,indicated that the PM2.5concentration in the MLYP region must be reduced by 20% in the next five years and it played a role in the emission reduction of various emission sources (Wanget al.2016;Dinget al.2019;Zhanget al.2019). More environmental policies were issued in the Yangtze River Delta from 2015 to 2017,which led the air quality score to improve by 49.46–63.64% in Zhoushan,Shanghai,and Nantong (Yanget al.2019). The proportion of clean energy consumption increased steadily,from 3.8% in 1997 to 14.6% in 2017,reducing the pollution caused by non-clean energy consumption (Wang and Lee 2022). On the other hand,non-ferrous metal smelting is the main source of Cd in the atmosphere in the MLYP region (Chenget al.2014;Shiet al.2018). China has issued several non-ferrous metal smelting environmental policies since 2014,resulting in the shift of China’s total non-ferrous metals output from rapid growth (2002–2014) to slow growth (2015–2019)(Jianget al.2021). In 2016,China implemented special atmospheric emission standards in “2+26” cities (Chenet al.2020). However,although the emission factors of non-ferrous metal smelting decreased,the total emissions of Cd did not change due to the increase in non-ferrous metal production. Up to now,there has been no policy related to the strict limitation of Cd emissions,and it is necessary to put forward stringent emission measures to control the Cd concentration in the atmosphere.
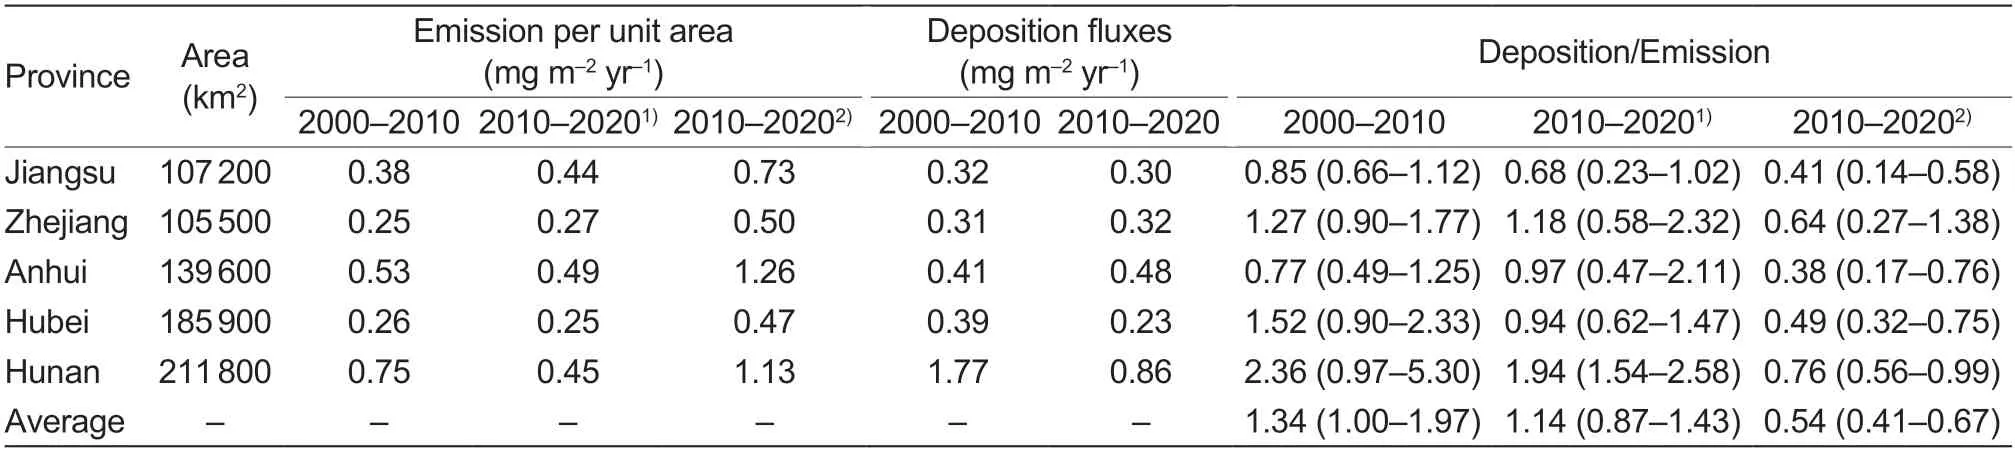
Table 4 Correlations between atmospheric deposition and emissions of Cd for five regions in the Middle-Lower Yangzte Plain,China
3.6.Association of atmospheric Cd emission and deposition with Cd accumulation in soil
The contribution of atmospheric Cd deposition to Cd accumulation in soil was 25–29% in 2000–2010,and 22% in 2010–2020 with soil Cd concentrations increasing at rates of 0.80–7.93 µg kg–1yr–1. Despite ignoring the output of soil Cd and the influence of other Cd sources,the contribution of atmospheric deposition to soil accumulation reached 0.3 mg kg–1(the farmland criterion of GB 15618-2018 2018,pH≤7.5) after about 94 years (relative to soil background values in 1990).It is necessary to reduce the Cd concentration in the atmosphere. Therefore,there is an urgent need to develop atmospheric environmental standards for Cd to reduce its entry into the soil from atmospheric sources,to avoid affecting crop health and endangering human life.
According to the quantitative and uncertainty analysis between atmospheric deposition fluxes and emission per unit area,the ratio of atmospheric Cd emission and deposition is approximately 1.0. Therefore,the fluxes of atmospheric deposition can be determined according to the accumulation rate of Cd in soil.
4.Conclusion
The temporal and spatial variation characteristics of atmospheric emissions,deposition,and soil accumulation of Cd in the MLYP regions of China,as well as their relationships,were analyzed in the present study.The interconnection between atmospheric emission,deposition,and soil accumulation was maintained in an equilibrium state. The atmospheric Cd deposition contributed 22–29% of the increment in soil Cd concentration. The study has shown that atmospheric emission of Cd in the region has not been effectively mitigated. Although environmental policies,such as the implementation of the New Environmental Protection Law,and the Clean Air Action Plan,have been issued for the Yangtze River Delta to eliminate PM2.5,the atmospheric emission of Cd is still too high. Therefore,to achieve a reduction in the emissions of Cd,it is necessary to not only reduce the concentration of particulate matter but also control the total amount of Cd in the atmosphere.Up to now,there has been no policy that strictly limits Cd emissions,so relevant agencies should strengthen the prevention and control of Cd contamination,to further reduce the contribution of atmospheric deposition to Cd accumulation in soil.
Acknowledgements
This work was supported by the Science and Technology Development Fund,Macau SAR,China (0159/2019/A3,001/2022/NIF and 0008/2022/AFJ) and the Special Fund Project for Science and Technology Innovation Strategy of Guangdong Province,China (2019B121205004).
Declaration of competing interest
The authors declare that they have no conflict of interest.
Appendicesassociated with this paper are available on https://doi.org/10.1016/j.jia.2023.05.016
杂志排行
Journal of Integrative Agriculture的其它文章
- The association between the risk of diabetes and white rice consumption in China: Existing knowledge and new research directions from the crop perspective
- Genome-wide association study for numbers of vertebrae in Dezhou donkey population reveals new candidate genes
- Are vulnerable farmers more easily influenced? Heterogeneous effects of lnternet use on the adoption of integrated pest management
- lnfluences of large-scale farming on carbon emissions from cropping:Evidence from China
- Spatio-temporal variations in trends of vegetation and drought changes in relation to climate variability from 1982 to 2019 based on remote sensing data from East Asia
- Optimizing water management practice to increase potato yield and water use efficiency in North China