Linkage between the Asian-Pacific Oscillation and winter precipitation over southern China: CMIP6 simulation and projection
2023-10-11QiweiFanBotaoZhou
Qiwei Fan ,Botao Zhou
a Collaborative Innovation Center on Forecast and Evaluation of Meteorological Disasters/Key Laboratory of Meteorological Disaster, Ministry of Education/Joint International Research Laboratory of Climate and Environment Change, Nanjing University of Information Science and Technology, Nanjing, China
b Jiuquan Meteorological Bureau of Gansu Province, Jiuquan, China
Keywords: CMIP6 Evaluation and projection Asian-Pacific Oscillation Winter precipitation Atmospheric circulations
ABSTRACT Based on the simulations of 30 CMIP6 models,this paper evaluates their performance in simulating the linkage between the winter Asian-Pacific Oscillation(APO)and precipitation over southern China(SC).Results show that 12 out of the 30 models can reproduce well the observed inverse relationship featuring a positive APO phase corresponding to a decrease in SC precipitation.Associated with the positive APO phase,an anomalous anticyclonic circulation dominates the southern part of Asia in the upper troposphere,and an anomalous cyclonic circulation prevails particularly in the lower troposphere of the South China Sea and the Malay Archipelago.Accordingly,the East Asian westerly jet(EAWJ)shifts northward,and low-level northeasterly anomalies appear over SC,which yield anomalous descending motion and water vapor flux divergence in SC,respectively,hence decreasing the in-situ precipitation.Using the ensemble of the 12 models,the future relationship between the winter APO and SC precipitation under the SSP5-8.5 scenario was further projected.The projection indicates that the APO connection with SC precipitation will still be significant,but weakened slightly,during the second half of the 21st century as compared to the present.Such a weakening may result from the weaker linkage between SC precipitation and the meridional displacement of the EAWJ.
1.Introduction
The Asia-Pacific Oscillation (APO),as a dominant mode of atmospheric variability that features a seesaw pattern in the uppertropospheric temperature between Asia and the North Pacific (Zhao et al.,2007),plays important roles in East Asian atmospheric circulations and climate anomalies(Zhao et al.,2007;Zhou et al.,2008,2010;Zhou and Zhao,2010;Zhao et al.,2010,2012;Fang et al.,2014;Hua et al.,2019;Lin et al.,2021).For instance,the positive phase of summer APO corresponds to a strengthened South Asian high,deepened North Pacific trough,and northward shift of the East Asian westerly jet(EAWJ)in the upper troposphere,concurrent with a strengthening of the Asian low and the North Pacific subtropical high as well as a northward displacement of the western Pacific subtropical high (WPSH) in the lower troposphere,which decreases summer precipitation from the Yangtze River valley to southern Japan while increasing it in North China (Zhao et al.,2007).During the winter season,a positive APO phase is accompanied by northeasterly anomalies over southern China(SC) in the lower troposphere,resulting in anomalous divergence of water vapor flux and inducing decreased SC precipitation (Liu et al.,2013).
Given the importance of the APO in the East Asian climate system,it is necessary to understand the APO-associated climate regime in the context of global warming,and several efforts have thus far been devoted to this issue using climate models (e.g.,Chen et al.,2013;Huang et al.,2013;Zhang et al.,2016;Zhou,2016;Zhou and Xu,2017;Zhou et al.,2018;Fan and Zhou,2022).For instance,based on CMIP5 simulations,Zhou et al.(2018) indicated that the present linkage between summer APO and the South Asian high,North Pacific trough,Asian low,and North Pacific subtropical high will maintain during the second half of the 21st century in a warmer world,while its connection with East Asian summer precipitation will decrease significantly.Recently,CMIP6 simulations have been issued and analyzed (e.g.,Eyring et al.,2016;Jiang et al.,2020;Yang et al.,2021;Zhu et al.,2021).Under the CMIP6 scenario of high greenhouse gas emissions (i.e.,SSP5-8.5),the winter APO is projected to weaken during the second half of the 21st century with respect to the present climate (Fan and Zhou,2022).However,the future relationship of the winter APO with East Asian atmospheric circulations and precipitation remains unknown.Thus,we are motivated to address the following questions in this study:(1) How well do the state-of-the-art CMIP6 models perform in simulating the relationship between the APO and SC precipitation during winter?(2)How will their relationship change in the future against the background of a weakened APO?
2.Data and methods
The results of the historical simulations and SSP5-8.5 experiment from 30 CMIP6 models (Table 1) were employed in this study.The historical simulation represents the present-day climate and the SSP5-8.5 experiment denotes a high energy-intensive,socioeconomic developmental path with the radiative forcing peaking at 8.5 W m-2by 2100(Eyring et al.,2016;Gidden et al.,2019).
To validate the performance of the CMIP6 models,the precipitation data from the Climatic Research Unit with a 0.5◦× 0.5◦horizontal resolution(Harris et al.,2020)and the NCEP–NCAR reanalysis datasets on a 2.5◦×2.5◦grid(Kalnay et al.,1996)were used as the observation.As the horizontal resolutions of the datasets vary,we interpolated all the data onto a 1◦×1◦grid using the bilinear interpolation method.In this study,the evaluation period was 1965–2014 and the projection period was 2015–2099.Winter refers to December–January–February.The linear trends of the data were removed before analysis,and statistical significance was assessed using Student’st-test.
Referring to Fan and Zhou(2022),the winter APO index is defined as the difference of upper-tropospheric temperature (300–200 hPa) between Asia (20◦–40◦N,80◦–150◦E) and the Pacific (5◦–35◦N,170◦–100◦W).The winter SC precipitation index(SCWP)is measured as the area-averaged precipitation over the region of 22◦–30◦N and 105◦–120◦E (green frame in Fig.1(e)).The EAWJ index is represented by the difference in 200-hPa zonal winds between the region of 15◦–25◦N and 110◦–115◦E and the region of 30◦–40◦N and 110◦–115◦E(Mao et al.,2007).To simply characterize the transport of meridional moisture across the region from the South China Sea to SC,an index(SCSV)was constructed by the 850-hPa meridional winds averaged over the region of 5◦–18◦N and 108◦–120◦E,similar to in Li et al (2021).
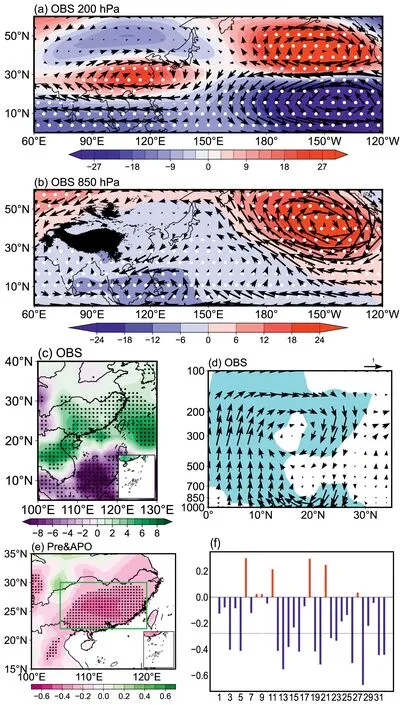
Fig.1.Regressions of (a) 200-hPa geopotential height (shading;units:m)and horizontal winds(vectors;units:m s-1),(b)850-hPa geopotential height (shading;units: m) and horizontal winds(vectors;units:m s-1),(c)water vapor flux divergence at 925 hPa(units: 10-4 kg m-2 s-1),and (d) meridional wind (units: m s-1)and vertical velocity(units:10-2 Pa s-1)along 110◦–115◦E against the APO index during the winter of 1965–2014.(e) Correlations between the winter APO index and precipitation during 1965–2014.(f)Winter APO–SWCP correlations during 1965–2014 for individual models (see Table 1 for the names corresponding to the numbers,1–30),the MME (number 31),and the observation(OBS,number 32).Regions above the 95% confidence level are dotted in (a–c,e) and shaded in (d).The green frame in (e) indicates the region used for the definition of the SWCP index.The dotted line in (f) delineates (below the line) the correlation coefficients significant at the 0.05 level.
3.Results
3.1.Evaluation
Firstly,to have a clear picture in mind,we present the observed winter APO-related anomalies in atmospheric circulations and precipitation during 1965–2014(Fig.1).As shown in Fig.1(a),a positive APO phase is associated with positive geopotential height anomalies (anticyclonic circulation anomalies) in the upper troposphere of the mid-–lower latitudes of Asia,indicating an intensification and a northward shift of the EAWJ since the core of westerlies is located along 30◦N in winter.At 850 hPa (Fig.1(b)),negative height anomalies (cyclonic circulation anomalies) emerge,particularly over the South China Sea and the Malay Archipelago.As a result,northeasterly anomalies prevail in SC,which are unfavorable for water vapor transport from the ocean to the target region.This can be demonstrated by the change in the divergence field of water vapor flux,which implies an anomalous divergence over SC (Fig.1(c)).Meanwhile,anomalous upward and downward motion is observed within 0◦–10◦N and 20◦–30◦N (i.e.,the SC region),respectively (Fig.1(d)).The descending anomalies in the latter region may be linked to the northward displacement of the EAWJ(Ding,2005).The anomalous water vapor flux divergence and descending motion over SC are not conducive to the occurrence of precipitation and hence decrease the precipitation in situ(Fig.1(e)).
The APO–SCWP correlation also shows that they are negatively correlated,with the correlation coefficient being -0.44 (significant at 0.01 level).To examine whether the CMIP6 models can capture the observed APO–SCWP relationship,we calculated their correlation for each CMIP6 model over the course of 1965–2014.As shown in Fig.1(f),the correlation coefficients range from -0.67 (NorESM2-LM) to 0.30(CAS-ESM2-0).In general,there are 23 CMIP6 models that can simulate the out-of-phase relationship,12 of which(numbers 3,5,12,13,14,16,19,20,22,23,26,and 28) are able to yield the negative correlation significantly at the 0.05 level.Therefore,the multimodel ensemble(MME) mean of the 12 modes is employed to project their future relationship in the following section.For the MME simulation,the APO–SCWP correlation coefficient is-0.44,significant at the 0.01 level and consistent with the observation.The MME can also reasonably reproduce the characteristics of the APO-related atmospheric circulations(figure not shown).All of these results provide justification for the use of the MME for the future projection.Note that the performance of CMIP6 models in simulating the characteristics of the APO was recently evaluated by Fan and Zhou (2022),who showed that the observed spatial structure and interannual variability of the APO can be reproduced well.
3.2.Projection
The MME-projected atmospheric circulation anomalies at 200 hPa and 850 hPa associated with the winter APO during 2050–2099 under the SSP5-8.5 scenario are shown in Fig.2(a–d).It can be seen that the spatial distribution is generally consistent with the observation (Fig.1(a–d))and the historical simulation(figure not shown).When the APO is in a positive phase,positive geopotential height anomalies(anticyclonic circulation anomalies) are dominant in the upper troposphere of the mid–lower latitudes of Asia (Fig.2(a)) and negative height anomalies(cyclonic circulation anomalies)are predominant over the South China Sea and the Malay Archipelago (Fig.2(b)),inducing anomalous descending motion in SC (Fig.2(d)) and an anomalous divergence of water vapor flux(Fig.2(c)),which are together favorable for a decrease in precipitation locally(Fig.2(f)).Thus,the present linkage between the APO and the atmospheric circulations and precipitation over SC is projected to persist into the second half of the 21st century under the SSP5-8.5 scenario.
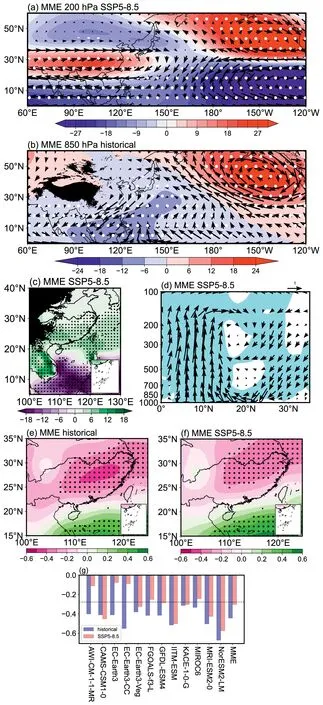
Fig.2.MME result for the regressions of (a) 200-hPa geopotential height(shading;units: m) and horizontal winds (vectors;units: m s-1),(b) 850-hPa geopotential height (shading;units: m) and horizontal winds (vectors;units:m s-1),(c)water vapor flux divergence at 925 hPa(units:10-4 kg m-2 s-1),and (d) meridional wind (units: m s-1) and vertical velocity(units: 10-2 Pa s-1) along 110◦–115◦E against the APO index during the winter of 2050–2099 under the SSP5-8.5 scenario.(e,f)MME result for the correlations between the winter APO index and precipitation for (e) the historical simulation during 1965–2014 and (f) the SSP5-8.5 scenario during 2050–2099.(g)Winter APO–SCWP correlations during 1965–2014(blue) and 2050–2099 (pink) for individual models and the MME.
However,as compared to the historical simulation (Fig.2(e)),the negative correlation between the APO and SC precipitation under the SSP5-8.5 scenario (Fig.2(f)) is projected to weaken during the second half of the 21st century,although it is still significant at the 0.05 level.From the perspective of index correlation (Fig.2(g)),the MMEsimulated APO–SCWP correlation coefficient decreases from -0.44(significant at the 0.01 level)during 1965–2014 to-0.30(significant at the 0.05 level) during 2050–2099.Such a decrease is projected by almost all of the ensemble members.
But why would the APO–SCWP connection weaken in a warmer climate? The displacement of the EAWJ and the low-level meridional wind over the SC coast are expected to play dominant roles in the winter SC precipitation (Huang et al.,2014;Zhang et al.,2019;Wang et al.,2022).These roles can be confirmed by the anomalies in 200-hPa zonal winds and 850-hPa horizontal winds regressed against the SCWP.Associated with above-normal SC precipitation,easterly anomalies dominate north of 30◦N and westerly anomalies cover the region south of 30◦N at 200 hPa(Fig.3(a)),indicating a southward shift of the EAWJ.At 850 hPa (Fig.3(c)),southwesterly anomalies prevail over the SC coast.The observed relationship can be reproduced well by the MME historical simulation (Fig.3(b,d)).For the MME simulation,the SCWP–EAWJ and SCWP–SCSV correlation coefficients during 1965–2014 are 0.43(Fig.4(a))and 0.70(Fig.4(b)),respectively,which are close to their observational counterparts (0.5 and 0.61,respectively).During this time period,the APO is also closely correlated to the EAWJ and SCSV,with a coefficient of-0.79(Fig.4(c))and-0.38(Fig.4(d)),respectively.The corresponding observational values are -0.79 and-0.44.Therefore,we hypothesize that the EAWJ and SCSV serve as a bridge connecting the variability of the APO and the SCWP during 1965–2014.
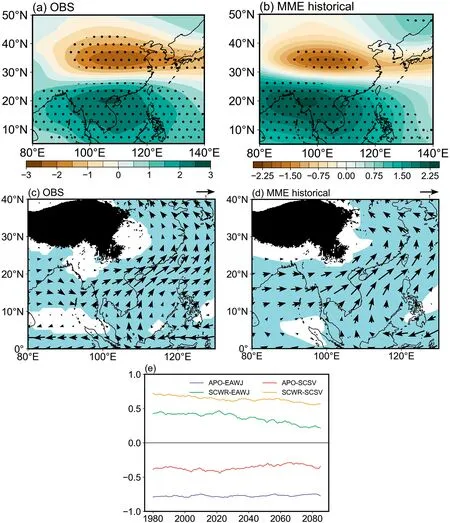
Fig.3.Regression of(a,b)200-hPa zonal winds(units:m s-1)and(c,d)850-hPa horizontal winds(units:m s-1)against the SCWP index during 1965–2014 for(a,c)the observation and (b,d) the MME historical simulation.(e) The MME-simulated 31-yr sliding correlations of the APO and SCWP indices with the EAWJ and SCSV indices.
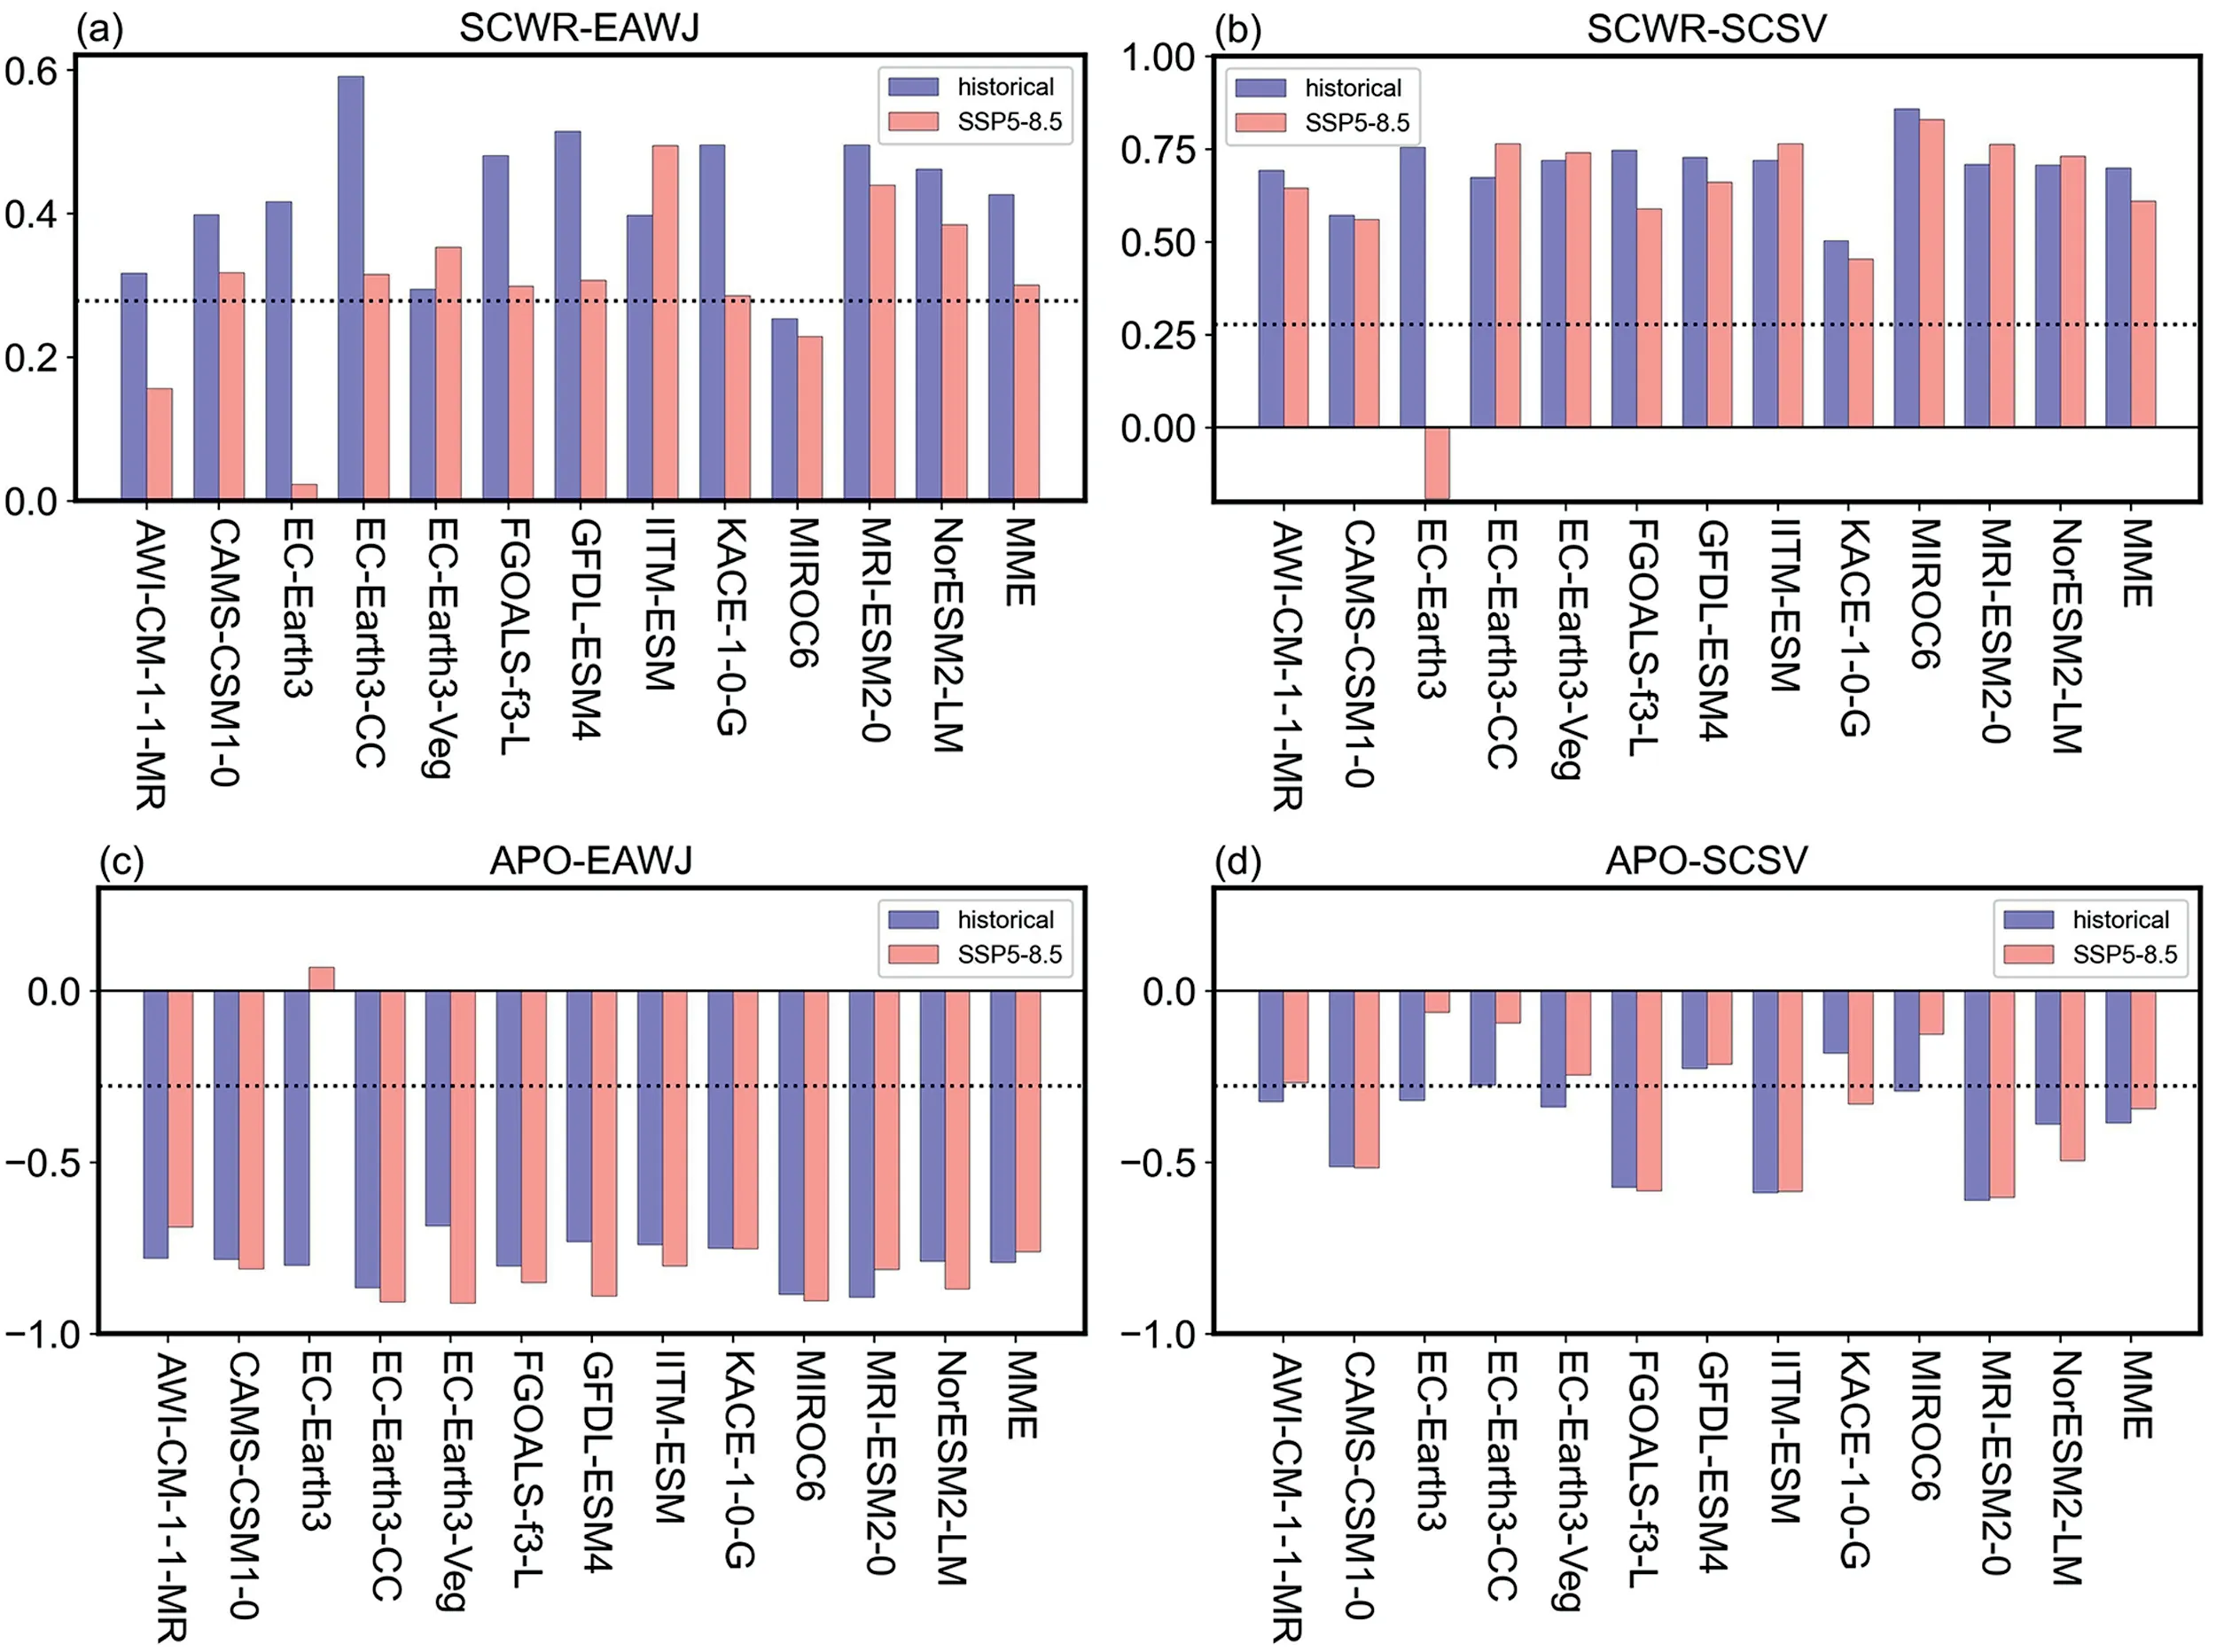
Fig.4.(a) SCWP–EAWJ,(b) SCWP–SCSV,(c) APO–EAWJ,and (d) APO–SCSV correlations during the winter of 1965–2014 (blue) and 2050–2099 (pink) for individual models and the MME.
To examine the stability of the relationships of the APO or SCWP with the EAWJ and SCSV,we calculated the MME-simulated 31-yr sliding correlations over the course of 1965–2099.As shown in Fig.3(e),the out-of-phase relationships between the APO and the EAWJ as well as the SCSV are stable and significant throughout the whole period.In comparison,the in-phase relationships of the SCWP with the EAWJ and SCSV,particularly with the EAWJ,exhibit a weakening tendency.This finding is also supported by their direct correlations during 1965–2014 and 2050–2099.For the APO–EAWJ (Fig.4(c)) and APO–SCSV (Fig.4(d)) relationships,the correlation coefficients during 2050–2099 projected by the MME are -0.76 and -0.34,respectively,which are comparable to the MME results during 1965–2014.For the SCWP–EAWJ(SCWP–SCSV) connections,the MME results indicate that the correlation coefficient decreases from 0.43 (0.70) during 1965–2014 to 0.30(0.60) during 2050–2099.Therefore,relative to 1965–2014,the MME projects a weaker correlation between the SCWP and the EAWJ during 2050–2099,which may be responsible for the weaker APO–SCWP linkage.The projected weakening of the SCWP–EAWJ connection may be partly related to the northward shift of the EAWJ in a warmer scenario(Yang et al.,2023),which deserves further in-depth investigation.
4.Conclusion
In this study,we evaluated the ability of 30 CMIP6 models to simulate the linkage between winter the APO and East Asian atmospheric circulations and precipitation over SC,through the comparison of the historical simulations and reanalysis data for the period 1965–2014.The evaluation shows that 12 out of the 30 CMIP6 models perform well in simulating the significantly negative APO–SCWP correlation.The physical linkage between the positive APO phase and the East Asian atmospheric circulations can also be successfully captured by the ensemble of these 12 models,including the anticyclonic circulation anomaly in the upper troposphere of the mid–lower latitudes of Asia,the cyclonic circulation anomaly in the lower troposphere of the South China Sea and the Malay Archipelago,the northward shift of the EAWJ,and the low-level northeasterly anomalies and descending motion in SC,which are unfavorable for SC precipitation.
Based on the evaluation,the 12 models with relatively better performance were employed as the MME to project the future change in the relationship of the winter APO with East Asian atmospheric circulations and precipitation over SC under the SSP5-8.5 scenario.The MME projects that the above APO connection with East Asian atmospheric circulations in the present day will still be dominant during the second half of the 21st century.However,the APO–SCWP correlation,despite remaining significant,is projected to reduce.Such a reduction may be due to the weakening in the connection between the meridional shift of the EAWJ and the SC precipitation.
It is interesting to note that this finding regarding the projected APO–SCWP connection in winter and the associated physical mechanism differs to a certain degree from that regarding the changes in the relationship between the APO and East Asian precipitation in summer as projected by CMIP5.Specifically,CMIP5 showed an evident shift from a significant inverse correlation at present to an insignificant correlation during the second half of the 21st century in a warmer scenario,due to a weakening of the linkage between the summer APO and the meridional displacement of the EAJ and the WPSH(Zhou et al.,2018).Although the projection in this study reflects a possible estimate from state-of-the-art climate models,there is of course still uncertainty in the projection result stemming from the emission scenario and the differences among individual models.
Funding
This research was supported by the National Natural Science Foundation of China [grant number 42025502].
杂志排行

Atmospheric and Oceanic Science Letters的其它文章
- Skill improvement of the yearly updated reforecasts in ECMWF S2S prediction from 2016 to 2022
- Research progress on inter-monthly winter temperature variation in East Asia and climate prediction
- Precursory atmospheric teleconnection patterns for strong Siberian High events
- Distinct impacts of two kinds of El Niño on precipitation over the Antarctic Peninsula and West Antarctica in austral spring
- Contribution of external forcing to summer precipitation trends over the Qinghai—Tibet Plateau and Southwest China
- Impact of the Asian—Pacific Oscillation on early autumn precipitation over Southeast China:CMIP6 evaluation and projection