Precursory atmospheric teleconnection patterns for strong Siberian High events
2023-10-11JianSongNingShiQileiHuang
Jian Song ,Ning Shi,∗ ,Qilei Huang
a Key Laboratory of Meteorological Disaster,Ministry of Education(KLME)/Joint International Research Laboratory of Climate and Environment Change(ILCEC)/Collaborative Innovation Center on Forecast and Evaluation of Meteorological Disasters(CIC-FEMD),Nanjing University of Information Science and Technology,Nanjing,China
b College of Atmospheric Science,Nanjing University of Information Science and Technology,Nanjing,China
Keywords: Siberian high pressure Teleconnection pattern Cold anomalies
ABSTRACT Based on Japanese 55-year daily reanalysis data,the present study reveals that a strong Siberian high (SH) is preceded by three teleconnection patterns—namely,the Scandinavian (SCA) pattern,western Pacific (WP) pattern,and Polar/Eurasian(POL)pattern.Accordingly,strong SH events are classified into three types.Composite results show that there are evident differences among the three types in their typical circulation characteristics and impacts on surface air temperature(SAT)in East Asia.The SCA type is characterized by a wave-train anomaly over mid-and high-latitude Eurasia,while the WP type is characterized by a western expansion of circulation anomalies from the downstream western North Pacific/Far East.The significant signal of the POL type is a gradual southward movement of anticyclonic anomalies from the North Pole.In terms of the impact on SAT in East Asia,the SCA type and POL type are similar since they can cause a wide range of cold anomalies in East Asia.However,the cold anomalies caused by the POL type in northern China show significant signals earlier.The WP type causes only modest cold anomalies over northern and eastern China,but the persistence of SAT anomalies is obvious.
1.Introduction
The Siberian high (SH) is a semi-permanent cold high in the lower troposphere in the Siberian region in boreal winter.As one of the main members of the East Asian winter monsoon,the SH has a significant impact on the weather and climate over East Asia (Ding and Krishnamurti,1987;Ding et al.,1991).Many studies have found that there is a significant negative correlation between the SH intensity and air temperature in China,i.e.,low air temperature in China tends to occur when the SH is strong (Hou et al.,2007;Liu et al.,2011;Lan and Li,2016).Likewise,Wang and Ding (2006) pointed out that the SH intensity is significantly positively correlated with the frequency of cold waves in China.A strong SH even leads to cold surges over the South China Sea and East Sea(Xie et al.,1992).In addition,the SH also has a significant impact on precipitation over the Asian continent(Gong et al.,2002).
An anomalous SH is generally considered to be an important conveyor for the influence of circulation anomalies in the upper troposphere on surface air temperature (SAT) over East Asia on monthly and interannual time scales (e.g.,Gong and Wang,2003;Liu and Chen,2012).Recently,some studies have also found the SH plays an important role on subseasonal time scales.For example,the positive phase of the Scandinavian(SCA)pattern facilitates the accumulation of cold air over the region to the north of the Tibetan Plateau,which is conducive to subsequent enhancement of the SH and cold anomalies over eastern China(Shi et al.,2019;Wang and Tan,2020;Zhang et al.,2022).In addition,the formation of long-lasting cold wave events over the South China Sea is also related to SCA circulation anomalies(Pang et al.,2022).The polarity of SH anomalies is even related to upstream North Atlantic Oscillation(Zhou et al.,2023).
There are two circulation origins for the enhancement of the SH(Takaya and Nakamura,2005).The first is the Atlantic,which is characterized by wave train—like height anomalies in the upper troposphere across the mid-and high-latitude region from the North Atlantic to East Asia.The second is the Pacific,which features the gradual westward migration of anticyclonic anomalies from the western North Pacific.In fact,these two origins may correspond to different atmospheric teleconnection patterns.For example,the circulation anomalies originating in the Atlantic might correspond to those teleconnection patterns that contain wave-train anomalies across mid-and high-latitude Eurasia,i.e.,the SCA pattern,East Atlantic (EA) pattern,East Atlantic/West Russia(EAWR) pattern,and Polar/Eurasian (POL) pattern.Furthermore,the Pacific origin may correspond to the western Pacific (WP) pattern in which a meridional circulation anomaly resides over the western Pacific and Far East.
As is well known,teleconnection patterns are characterized by a large-scale spatial structure of circulation anomalies.In this context,a systematic study on the relationship between strong the SH and precursory teleconnection patterns would be important for improving our ability to monitor and predict cold anomalies over East Asia,which is the focus of the present study.
2.Data,indices,and methods
The data used in this study are from the Japanese 55-year reanalysis,with a horizontal resolution of 1.25°.The analyzed period is from 1958 to 2021.The variables include sea level pressure,geopotential height,SAT,and wind velocity.The winter season refers to the months from November to March with the omission of 29 February in leap years.
Many indices have been proposed in previous studies to characterize anomalies of the SH,including area,intensity,and location indices(e.g.,Hou et al.,2007;Liu et al.,2011).In this paper,the SH Index (SHI) is defined as the area-weighted average value of sea level pressure (SLP)at all grid points with SLP greater than 1028 hPa in the specified area(45°—70°N,60°—120°E).Then,the anomalous daily SHI is obtained by subtracting the climatological mean SHI from the daily SHI.In order to eliminate the impact of long-term variation,the climatological mean SHI for a particular year is obtained by a 21-year moving average centered at that particular year.Then,finally,the anomalous daily SHI series is standardized.A strong SH event is identified if the standardized daily SHI is greater than 1.0 and lasts for at least four days.A total of 166 strong events are identified.The peak day,denoted as day 0,is defined as the day when the SHI reaches its maximum value.DayN(-N)represents dayNafter(before)the peak day.
The teleconnection patterns are calculated through the same method as in Barnston and Livezey(1987)and Shi et al.(2019),which is mainly based on rotated principal component analysis.Fig.1 shows the height anomalies at 500 hPa for four teleconnection patterns in their positive phase.These patterns are characterized by significant height anomalies over mid-and high-latitude Eurasia and the western North Pacific.Note that the EAWR pattern is not shown here since it generally has the weakest relation to the SHI compared with the other four teleconnection patterns.The daily index for each particular teleconnection pattern is obtained via the method in Baldwin and Dunkerton (2001),i.e.,the normalized 500-hPa geopotential height anomaly is projected onto the corresponding teleconnection pattern to obtain the daily index series,and then the time series is standardized.
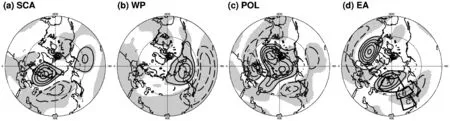
Fig.1.Four teleconnection patterns,which are represented by the regression coefficient of 500-hPa height anomalies onto the corresponding teleconnection index:(a) SCA pattern;(b) WP pattern;(c) POL pattern;and (d) EA pattern.Solid and dashed lines represent positive and negative anomalies,respectively.Zero lines are omitted.Shading denotes significant anomalies at the 0.05 level.The three boxes shown in (d) indicate region A (50°—70°N,60°—120°E),region B (40°—50°N,100°—130°E),and region C(25°—40°N,105°—122.5°E),over which SAT anomalies are weighted averaged in Fig.4.
3.Results
3.1.Precursory signals
The composite results for 166 strong SH events(Fig.2(a))show that,during the evolution of strong SH events,all four teleconnection indices are significant.Among the four teleconnection patterns,the EA index has the strongest amplitude and varies with the strong SH simultaneously.Fig.2(b)shows the lead—lag correlation coefficients between the four teleconnection indices and the SHI.Clearly,the correlation coeffi-cients between the EA index and SHI are strongest from day -7 to day 7,with a maximum of 0.54 at day 0.This verifies the simultaneous relationship between the EA index and strong SH,implying that the EA pattern might correspond to the Atlantic origin of the strong SH proposed by Takaya and Nakamura(2005).
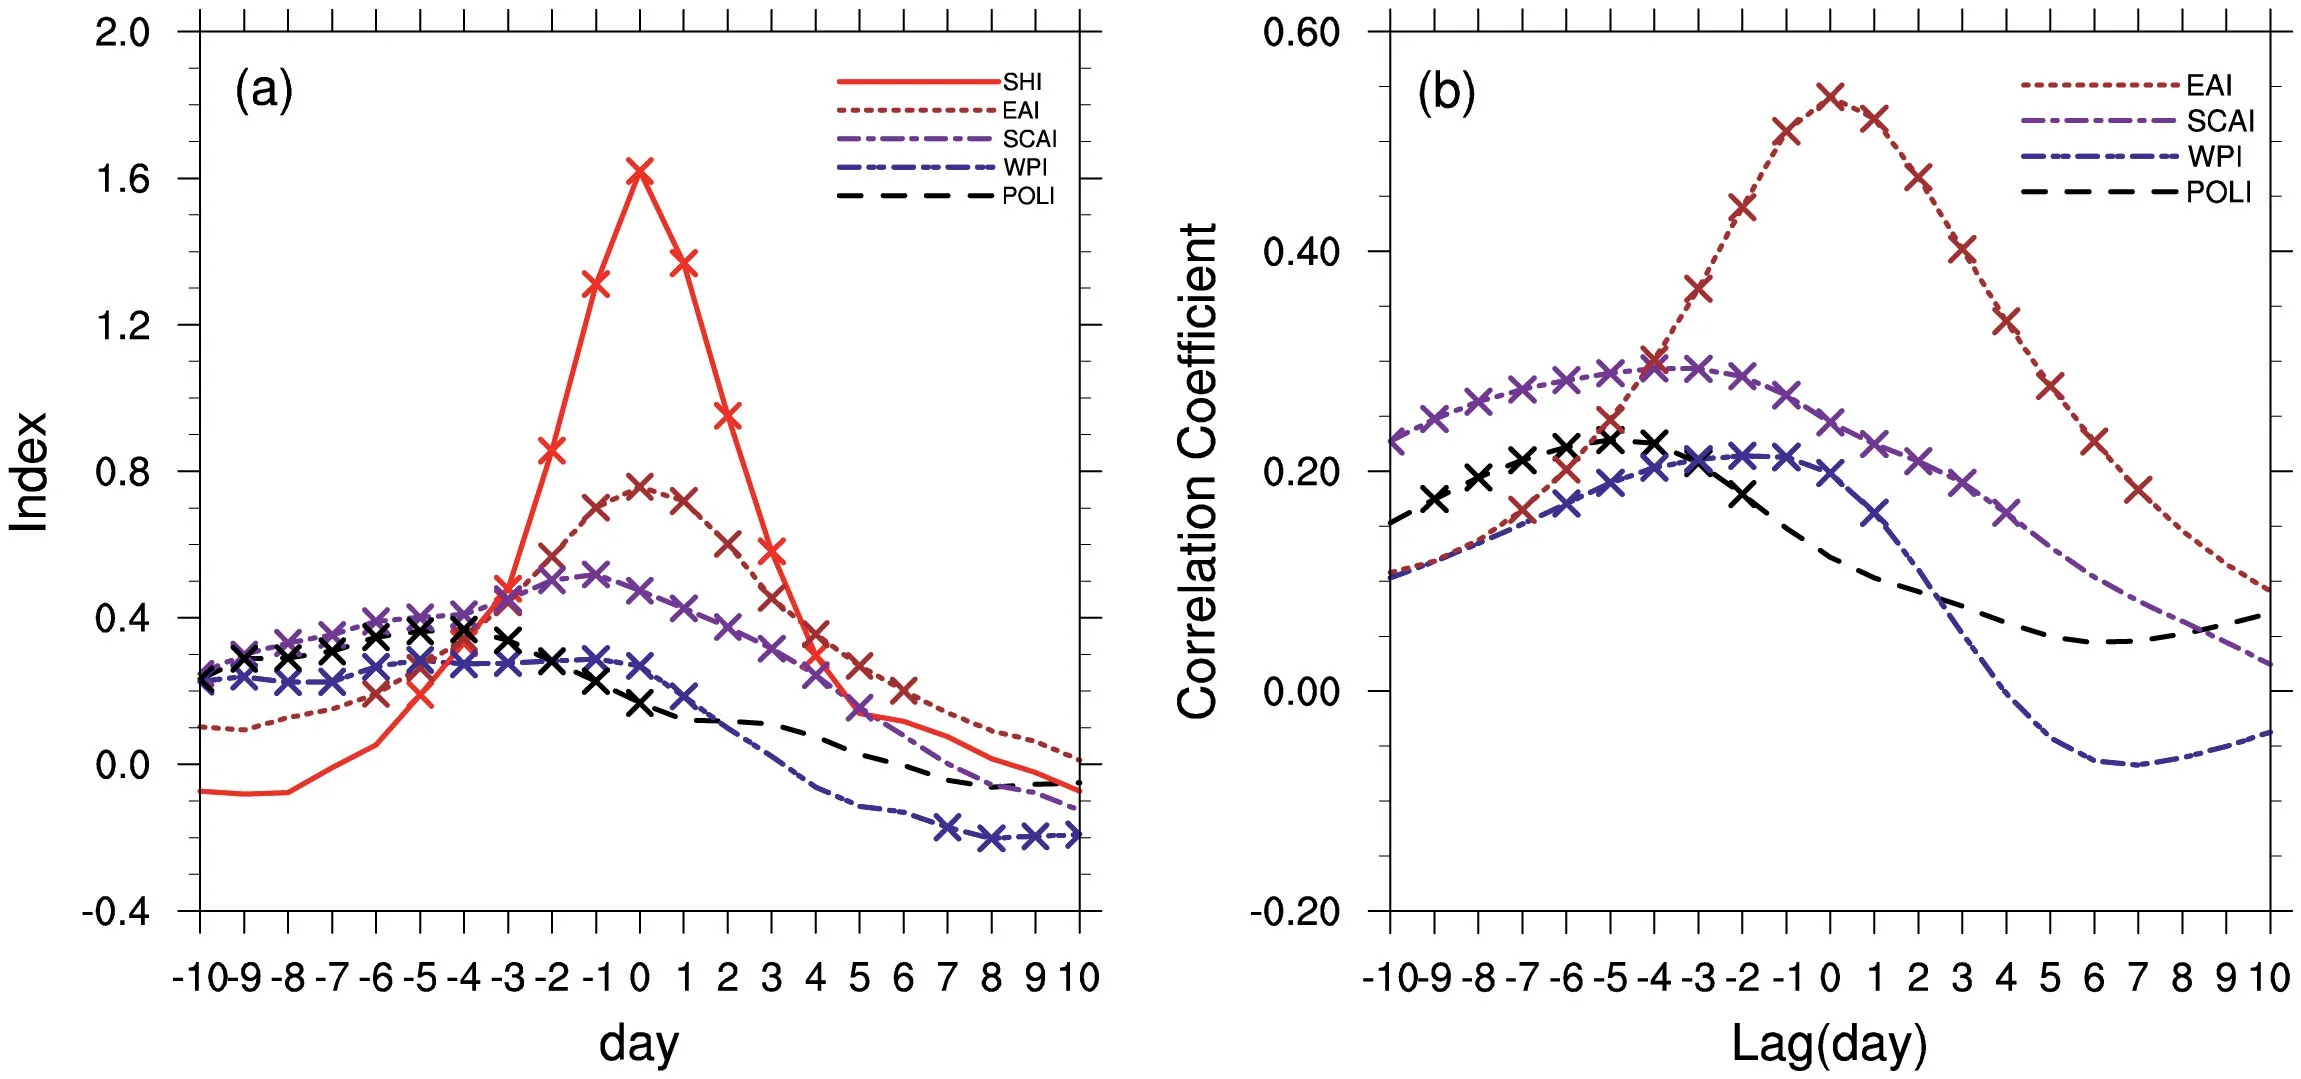
Fig.2.(a) Evolution of the SHI and four teleconnection pattern indexes in 166 strong SH events.(b) Lead—lag correlation coefficients between the SHI and four teleconnection pattern indexes.Crosses denote significant results at the 0.05 level.In (b),the effective sample number is considered when the significance test is conducted.
In contrast to the EA index,the indices of the other three patterns tend to achieve their maximum value before day 0,even one week before day 0 when both the SHI and EA index are not yet significant.This implies that the other three teleconnection patterns,i.e.,the SCA,WP,and POL patterns,can be used as precursory circulation signals for strong SH events.Based on these results,strong SH events are classified according to the relative amplitude among the three indices,which are individually averaged over the period from day-10 to day-6.The reason why a 5-day period is chosen is that,during this period,the values of both the SHI and EA index are small and insignificant,while the other teleconnection pattern indices are significant(Fig.2(a)).A strong SH event is classified as a particular type if one of the three teleconnection indices is larger than 1 and relatively larger than the other two.Finally,three types of strong SH events are identified—namely,the SCA type(29 cases),WP type(25 cases),and POL type(20 cases).
3.2.Circulation features
Fig.3 shows the composites of height anomalies at 300 hPa and the wave activity flux (Takaya and Nakamura,1997) during the evolution of the three types of strong SH events.The SCA type is characterized by quasi-stationary wave trains from the North Atlantic to East Asia,which is indicated by the quasi-zonal direction of wave activity flux(Fig.3(a—e)).In contrast,the WP type is characterized by the westward movement and expansion of the meridional dipole pattern over the western North Pacific/Far East.The northward propagation of Rossby waves is evident in the dipole pattern.Note that,due to Rossby wave energy dispersion,cyclonic height anomalies are gradually formed over North America and the North Atlantic/western Europe (Fig.3(f,g)).The Rossby wave packets emanate from the cyclonic anomalies over the North Atlantic/western Europe,contributing to the westward expansion of the anticyclonic height anomalies to the Ural Mountains at day 0(Fig.3(i)).Therefore,at day 0,the WP type bears some resemblance to the SCA type since both of them are characterized by anticyclonic height anomalies around the Ural Mountains.The POL type exhibits a distinct feature.Its primary significant anticyclonic anomalies are mainly located over the polar region at day-9(Fig.3(k)).The anticyclonic height anomaly tends to extend southwards to Greenland and emanates Rossby wave packets eastwards from there,which facilitates the formation of the cyclonic anomalies over the North Atlantic/western Europe(Fig.3(k—n)).Due to the injection of Rossby wave energy,the anticyclonic height anomalies originally over the polar region begin to move southwards and even enhance to some extent,and a cyclonic anomaly appears over Lake Balkhash,forming a new wave train over the Eurasian continent at day 0(Fig.3(n)).Clearly,like the SCA and WP types,the POL type is also characterized by anticyclonic anomalies around the Ural Mountains at approximately day 0.However,the formation of such anticyclonic anomalies differs among these three types.In the SCA type,the anticyclonic anomalies around the Ural Mountains evolve from the gradual eastward movement of the anticyclonic anomaly located over Scandinavia;in the WP type,they are mainly associated with the westward movement of positive height anomalies over the western North Pacific;and in the POL type,they originate from the southward movement of the positive height anomalies over the polar region.
Although the spatial distributions of SLP anomalies are similar at day 0 among the three types,the evolutions of SLP anomalies show different features(not shown),which are similar to those of the height field at 300 hPa.Specifically,the evolution of the primary anticyclonic SLP anomalies for the SCA type is characterized by a gradual eastward extension from the region around the Scandinavian peninsula/Ural Mountains to East Asia;the WP type is mainly characterized by the westward movement of the anticyclonic SLP anomalies centered at Alaska;and the POL type is characterized by gradual southward migration from the North Pole.Thus,the three types display distinct movement characteristics of the SH.
3.3.Influences on SAT
Since the three types correspond to different movements of circulation anomalies,it is natural to ask whether they exert different influences on SAT over East Asia.Fig.4 shows the variation in SAT anomalies for the three types of strong SH events.Here,the SAT anomalies are area-weight-averaged over three regions indicated by the three boxes in Fig.1(d).Region A corresponds to the Siberian region where cold air generally accumulates before bursting southeastwards to East Asia.Regions B and C roughly represent to northern China and eastern China,respectively,which are frequently affected by cold airmasses.The three regions roughly represent the pathway of cold-air outbursts (Ding and Krishnamurti,1987;Zhang et al.,1997).
Clearly,only the SCA and POL types can induce persistent and significant SAT anomalies over Region A before day 0 (Fig.4(a)).This indicates that the two types facilitate the accumulation of cold airmasses.After day 0,the cold anomalies weaken dramatically,implying southeastward outbursts of cold airmasses.Consistently,at approximately day 2 to 3,Regions B and C experience maximum cold anomalies for both the SCA and POL types (Fig.4(b,c)).As for the difference between the SCA type and POL type,the cold anomalies induced by the POL type become significant at an earlier time over region B(Fig.4(b)).Note that the WP type can induce persistent cold anomalies over Regions B and C.However,without the accumulation of cold airmasses over Region A,the cold anomalies induced by the WP type are modest over Regions B and C among the three types,especially after day 0 (Fig.4(b,c)).This is consistent with previous studies (Takaya and Nakamura,2005;Cheung et al.,2013;Bueh et al.,2022) that revealed the accumulation of cold airmasses over Siberia can induce strong cold-air invasion over East Asia.
4.Discussion and conclusion
This paper reveals the various circulation characteristics of strong SH events from the perspective of teleconnection patterns.It shows that there are three teleconnection patterns that can be regarded as precursory circulation signals for strong SH events,i.e.,the SCA pattern,WP pattern,and POL pattern.Accordingly,strong SH events can be classified into SCA,WP,and POL types.The SCA type mainly represents the circulation signal emerging from west to east over the mid-and highlatitude Eurasian continent,while the WP type is characterized by a westward extension of the dipole pattern over the western North Pacific.In addition,there is a third circulation signal pathway,i.e.,southward movement of anomalous circulation from the polar region,which occurs in the POL type and is not documented by previous studies.The different evolutionary features of circulation anomalies are consistent with the propagation of Rossby waves.The SCA and POL types can induce the accumulation of cold airmasses over the Siberia region and subsequent strong cold anomalies over East Asia.It seems that the SCA type and POL type can induce the coldest anomalies over East Asia.The cold anomalies over northern China become significant at an earlier time in the POL type than those in the SCA type.In contrast,the modest cold anomalies induced by the WP type tend to be persistent over northern China as well as eastern China.
Takaya and Nakamura (2005) and Shi et al.(2019) demonstrated that vertical coupling between upper-troposphere circulation anomalies over the Eurasian continent and SAT anomalies is important for amplification of the SH.How the upper-tropospheric circulation anomalies originating from the western North Pacific,as is seen in the WP type,interact with SAT deserves to be studied further in the future.Transient eddy feedback is considered an important factor in the formation of circulation anomalies around the region from the North Atlantic to Scandinavia(Takaya and Nakamura,2005;Bueh and Nakamura,2007).The roles played by transient eddies in the different types of strong SH events need to be explored.Last but not least,the combined effects of two or more types are not explored in this study.In fact,some anomalous SH events are characterized by two or three teleconnection patterns.For example,there are six strong SH events that are preceded by both strong SCA and POL indices from day-10 to day-7,and eight cases that are preceded by all three teleconnection indices.Future studies on such combined effects should be helpful for deepening our understanding of East Asian climate.
Funding
This work was jointly supported by the National Natural Science Foundation of China[grant numbers 42025502 and 41975063]and the Qing Lan Project.
杂志排行

Atmospheric and Oceanic Science Letters的其它文章
- Skill improvement of the yearly updated reforecasts in ECMWF S2S prediction from 2016 to 2022
- Research progress on inter-monthly winter temperature variation in East Asia and climate prediction
- Distinct impacts of two kinds of El Niño on precipitation over the Antarctic Peninsula and West Antarctica in austral spring
- Contribution of external forcing to summer precipitation trends over the Qinghai—Tibet Plateau and Southwest China
- Impact of the Asian—Pacific Oscillation on early autumn precipitation over Southeast China:CMIP6 evaluation and projection
- More extreme-heat occurrences related to humidity in China