Distinct impacts of two kinds of El Niño on precipitation over the Antarctic Peninsula and West Antarctica in austral spring
2023-10-11XueyngChenShunglinLiChoZhng
Xueyng Chen ,Shunglin Li,b,c,∗ ,Cho Zhng
a Department of Atmospheric Science,School of Environmental Studies,China University of Geosciences,Wuhan,China
b Institute of Atmospheric Physics/Climate Change Research Center,Chinese Academy of Sciences,Beijing,China
c College of Earth and Planetary Sciences,University of the Chinese Academy of Sciences,Beijing,China
Keywords: Precipitation Antarctic Peninsula ENSO types Tropical heating Rossby wave train
ABSTRACT Based on multiple reanalysis data,the authors investigated the distinct impacts of central Pacific(CP)and eastern Pacific (EP) El Niño events on precipitation over West Antarctica and the Antarctic Peninsula in austral spring(September—November).The results demonstrate that EP and CP events have similar impacts on precipitation over the Amundsen—Bellingshausen seas,but opposite impacts on that over the Weddell Sea,especially the Antarctic Peninsula.Mechanistically,the tropical heat sources associated with EP events drive two branches of Rossby wave trains,causing an anomalous anticyclone and cyclone over the Ross—Amundsen—Bellingshausen seas and the Weddell Sea,respectively.Anomalous southerly winds to the east(west)of the anomalous anticyclone(cyclone)advect colder and drier air into the Bellingshausen—Weddell seas and the Antarctic Peninsula,which jointly result in negative precipitation anomalies there.CP events,however,trigger only one weak and westward-shifted Rossby wave train,which induces an anomalous anticyclone and cyclone in the Ross—Amundsen seas and Bellingshausen—Weddell seas,respectively,both 20°—30°west of those generated by EP events.Consequently,anomalous northerly(southerly)winds to the east(west)of the anomalous cyclone cause an increase(a decrease)in precipitation over the Weddell Sea(Amundsen—Bellingshausen seas).
1.Introduction
In recent years,scientific research activities,tourism,and fisheries have been experiencing remarkable growth in West Antarctica,particularly around the Antarctic Peninsula (Meyer et al.,2020).These increased human activities are appreciably affected by weather and climate,especially precipitation (including rain and snow).The latter is also a key element reflecting climate,and plays a crucial role in the regional hydrological cycle and even determines the evolution of sea ice and the continental ice sheet through altering the surface mass balance(e.g.,Mo and Paegle,2001;Krinner et al.,2007;Ding et al.,2012;Fogt and Wovrosh,2015).Thus,understanding the variability of precipitation in West Antarctica,including the Antarctic Peninsula,is of substantial importance both for scientific and practical aspects.
The precipitation in West Antarctica,especially around the Antarctic Peninsula,exhibits large variability on the interannual time scale(Rondanelli et al.,2019;Hu et al.,2019;Yu et al.,2023).As the strongest signal of interannual climate variability,El Niño—Southern Oscillation(ENSO) affects the climate in many regions globally,including both of the polar regions.However,considerable uncertainty exists in ENSO’s effect on precipitation in West Antarctica,including the Antarctic Peninsula.Genthon and Cosme(2003)used precipitation data from the ERA40 reanalysis and from a 200-year simulation,and found an intermittent ENSO signature in West Antarctica.Guo et al.(2004) found that ENSO is positively correlated with the precipitation over Marie Byrd Land,West Antarctica(75°—90°S,120°W—180°),and negatively correlated with that over the South Atlantic sector (65°—75°S,30°—60°W) and Antarctic Peninsula.In comparison,Carrasco and Cordero (2020) used gauge precipitation data from Chilean Antarctic weather stations located on the Antarctic Peninsula gathered during the past nearly five decades(1970—2019),and showed no statistically significant connection between Antarctic Peninsula precipitation and ENSO (their Fig.10(a)).These findings indicate uncertainty in ENSO’s effect on precipitation over the Antarctic Peninsula.
The above uncertain connection between West Antarctica/Antarctic Peninsula precipitation and ENSO is not in agreement with ENSO’s significant impact on West Antarctica precipitation by modulating the Amundsen Sea Low (ASL) (e.g.,Meehl et al.,2016;Adusumilli et al.,2021)viathe Pacific—South America teleconnection (e.g.,Karoly,1989;Mo and Paegle,2001;Sasgen et al.,2010;Ding et al.,2012;Clem et al.,2015;Bodart and Bingham,2019).A potential explanation for this inconsistency is that previous studies did not distinguish between the various kinds of ENSO.It is well known that there are the two kinds of ENSO—one with the maximum SSTA warmth in the tropical eastern Pacific (EP),and the other with the maximum SSTA warmth in the central Pacific (CP) (Ashok et al.,2007;Yu and Kao,2007).Although EP and CP ENSO can both excite a Pacific—South America wave train to influence the ASL,the resultant ASL responses in terms of intensity and location are not the same(e.g.,Song et al.,2011;Zhang et al.,2021),which may cause a difference in their influence on precipitation over the Antarctic Peninsula.
Besides,EP events usually co-occur with a positive phase of the Indian Ocean Dipole (Li et al.,2003;Luo et al.,2010).Consequently,there are two centers of tropical anomalous heat sources linked to EP events,which excite two branches of Rossby wave trains emanating from the southwestern subtropical Pacific and the eastern equatorial Indian Ocean,respectively (Zhang et al.,2021).Both wave trains propagate southeastward and culminate to generate an anomalous anticyclone centered in the Amundsen Sea(i.e.,the weakened ASL)and a cyclone over the Weddell Sea,respectively.In comparison,the CP type excites a single wave train emanating from the central tropical Pacific,which weakens and shifts the ASL westward by 20°of longitude relative to that caused by EP El Niño.Thus,different impacts may be exerted by the two types of El Niño on precipitation in West Antarctica and the Antarctic Peninsula,and may even cancel each other out locally to cause insignificant influence.
This speculation motivated the present study,which aimed to investigate the impacts of different types of El Niño events on precipitation over West Antarctica and the Antarctic Peninsula.We mainly focused on austral spring (September—November,SON) during the developing year of EP El Niño,when the impact of ENSO on the southern atmospheric circulation is greatest (Schneider et al.,2012;Yu et al.,2015;Zhang et al.,2021).
2.Data and methods
Monthly sea surface temperature (SST) data from January 1870 to the present with a horizontal resolution of 1.0° × 1.0° were derived from the Met Office Hadley Center (Rayner et al.,2003).Three sets of monthly precipitation products,from MERRA-2 (Reichle et al.,2017),the ECMWF’s fifth-generation reanalysis(ERA5;Hersbach et al.,2020),and the ECMWF’s 20th century reanalysis (ERA-20C;Poli et al.,2016),were used.The former two products cover the period from January 1980 to December 2020,while the latter has a time span from January 1980 to December 2010.All products show good agreement in describing the climatological characteristics of precipitation over the Antarctic Peninsula and surrounding oceans(Amundsen—Bellingshausen—Weddell seas;ABWS;58°—80°S,130°W—20°E)(Fig.S1).For better comparison,all precipitation products were regridded onto a regular 0.25° × 0.25° grid.Monthly atmospheric data were obtained from ERA5.All variables have horizontal resolutions of 0.25° × 0.25° and time spans from January 1940 to the present.
The basic methods used were composite analysis,maximum covariance analysis(MCA),and regression.A total of eight EP and six CP cases identified by Ren et al.,(2018) and Yin et al.,(2022) for 1980—2020 were used for the analyses(Table S1).Also,MCA was based on a singular value decomposition of the temporal covariance matrix of two variables(e.g.,Bretherton et al.,1992;Ding et al.,2011).Monthly anomalies were computed relative to the 1981—2010 mean climatology.Student’st-tests were used for detecting statistical significance.
3.Results
3.1.Correlation between West Antarctica precipitation and ENSO types
In EP El Niño,SST anomalies (SSTAs) in the tropical Pacific typically exhibit a zonal dipole pattern,with a maximum positive SSTA in the central-eastern equatorial Pacific and negative SSTA in the western equatorial Pacific/Maritime Continent(Fig.1(a)).In addition to the tropical Pacific SSTA,a significant positive phase of the Indian Ocean Dipole can be observed in the equatorial Indian Ocean.Accordingly,negative precipitation anomalies occur in the Bellingshausen—Weddell seas (100°—20°W),especially in the Antarctic Peninsula (Fig.1(b)).In comparison,only a positive SSTA occurs in the central equatorial Pacific during CP events(Fig.1(e)).Meanwhile,precipitation anomalies exhibit a zonal dipole structure over West Antarctica,with negative and positive anomalies over the Amundsen—Bellingshausen seas (115°—60°W)and the Weddell Sea(60°W—20°E),respectively(Fig.1(f)),which is distinct from that of the EP type.This indicates that EP and CP El Niño may have different impacts on precipitation over West Antarctica.Similar results can be observed in both ERA-20C and ERA5,although the composite results are less significant (Fig.1(c,d) and 1(g,h)).In order to verify the correlations between the two types of El Niño and precipitation,we regressed the precipitation anomalies onto theIEPandICPindices,respectively (Text S2 and Fig.1(i—p)).The regressions bear a resemblance to the composite results and are more significant.
To further verify the links between the tropical SSTA and West Antarctica precipitation,MCA was used to capture the coupled modes between the SSTAs in the tropical Indian and Pacific oceans and precipitation anomalies in the ABWS,West Antarctica(Fig.2).
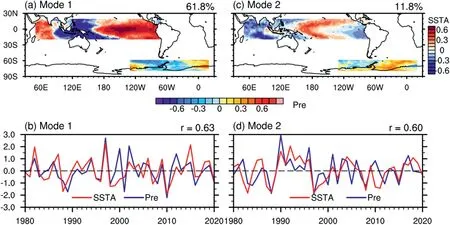
Fig.2.(a,c) Spatial patterns of the SSTA in the tropical Indian and Pacific oceans (20°S—20°N,50°E—70°W) together with the spatial patterns of precipitation anomalies in the ABWS region associated with the two leading coupled modes (mode 1 and 2) based on MCA.(b,d) As in (a,c) but for the time series.The values in the top-right corner in(a,c)are the explained covariance rates of the MCA mode,and those in(b,d)are the correlation coefficients between the two time series(i.e.,red and blue lines).The precipitation data are from ERA5.
The first MCA mode (mode 1),explaining 61.8% of the total covariance,shows a tropical Pacific zonal dipolar SSTA(Fig.2(a)),which is consistent with the composite SSTA associated with EP El Niño(Fig.1(a)).In addition,the spatial distribution of the regression of the tropical SSTA against the time series of the precipitation mode(blue line in Fig.2(b))agrees well with both the SST mode obtained from MCA and the distribution of the composite SSTA(Figs.1(a),2(a),and 3(b)).Similar to the composite precipitation anomalies,a unipolar anomaly of precipitation is observed over the Bellingshausen—Weddell seas(Fig.3(a)),indicating that EP events can reduce the precipitation there.The significantly positive correlation (r=0.63) between the two time series of mode 1 further confirms this linkage(Fig.2(b)).Furthermore,this precipitation mode can also be seen in the regression result (Fig.3(a)).All these findings indicate that the decreased precipitation over the Bellingshausen—Weddell seas can be attributed to the tropical heat forcing associated with EP El Niño.It is worth noting that the tropical SSTA and precipitation anomaly patterns corresponding to the reverse phase of mode 1 displays the typical distribution of a La Niña-related SSTA and an increase in precipitation there,respectively,which agrees well with the significant composite results(Fig.S3).
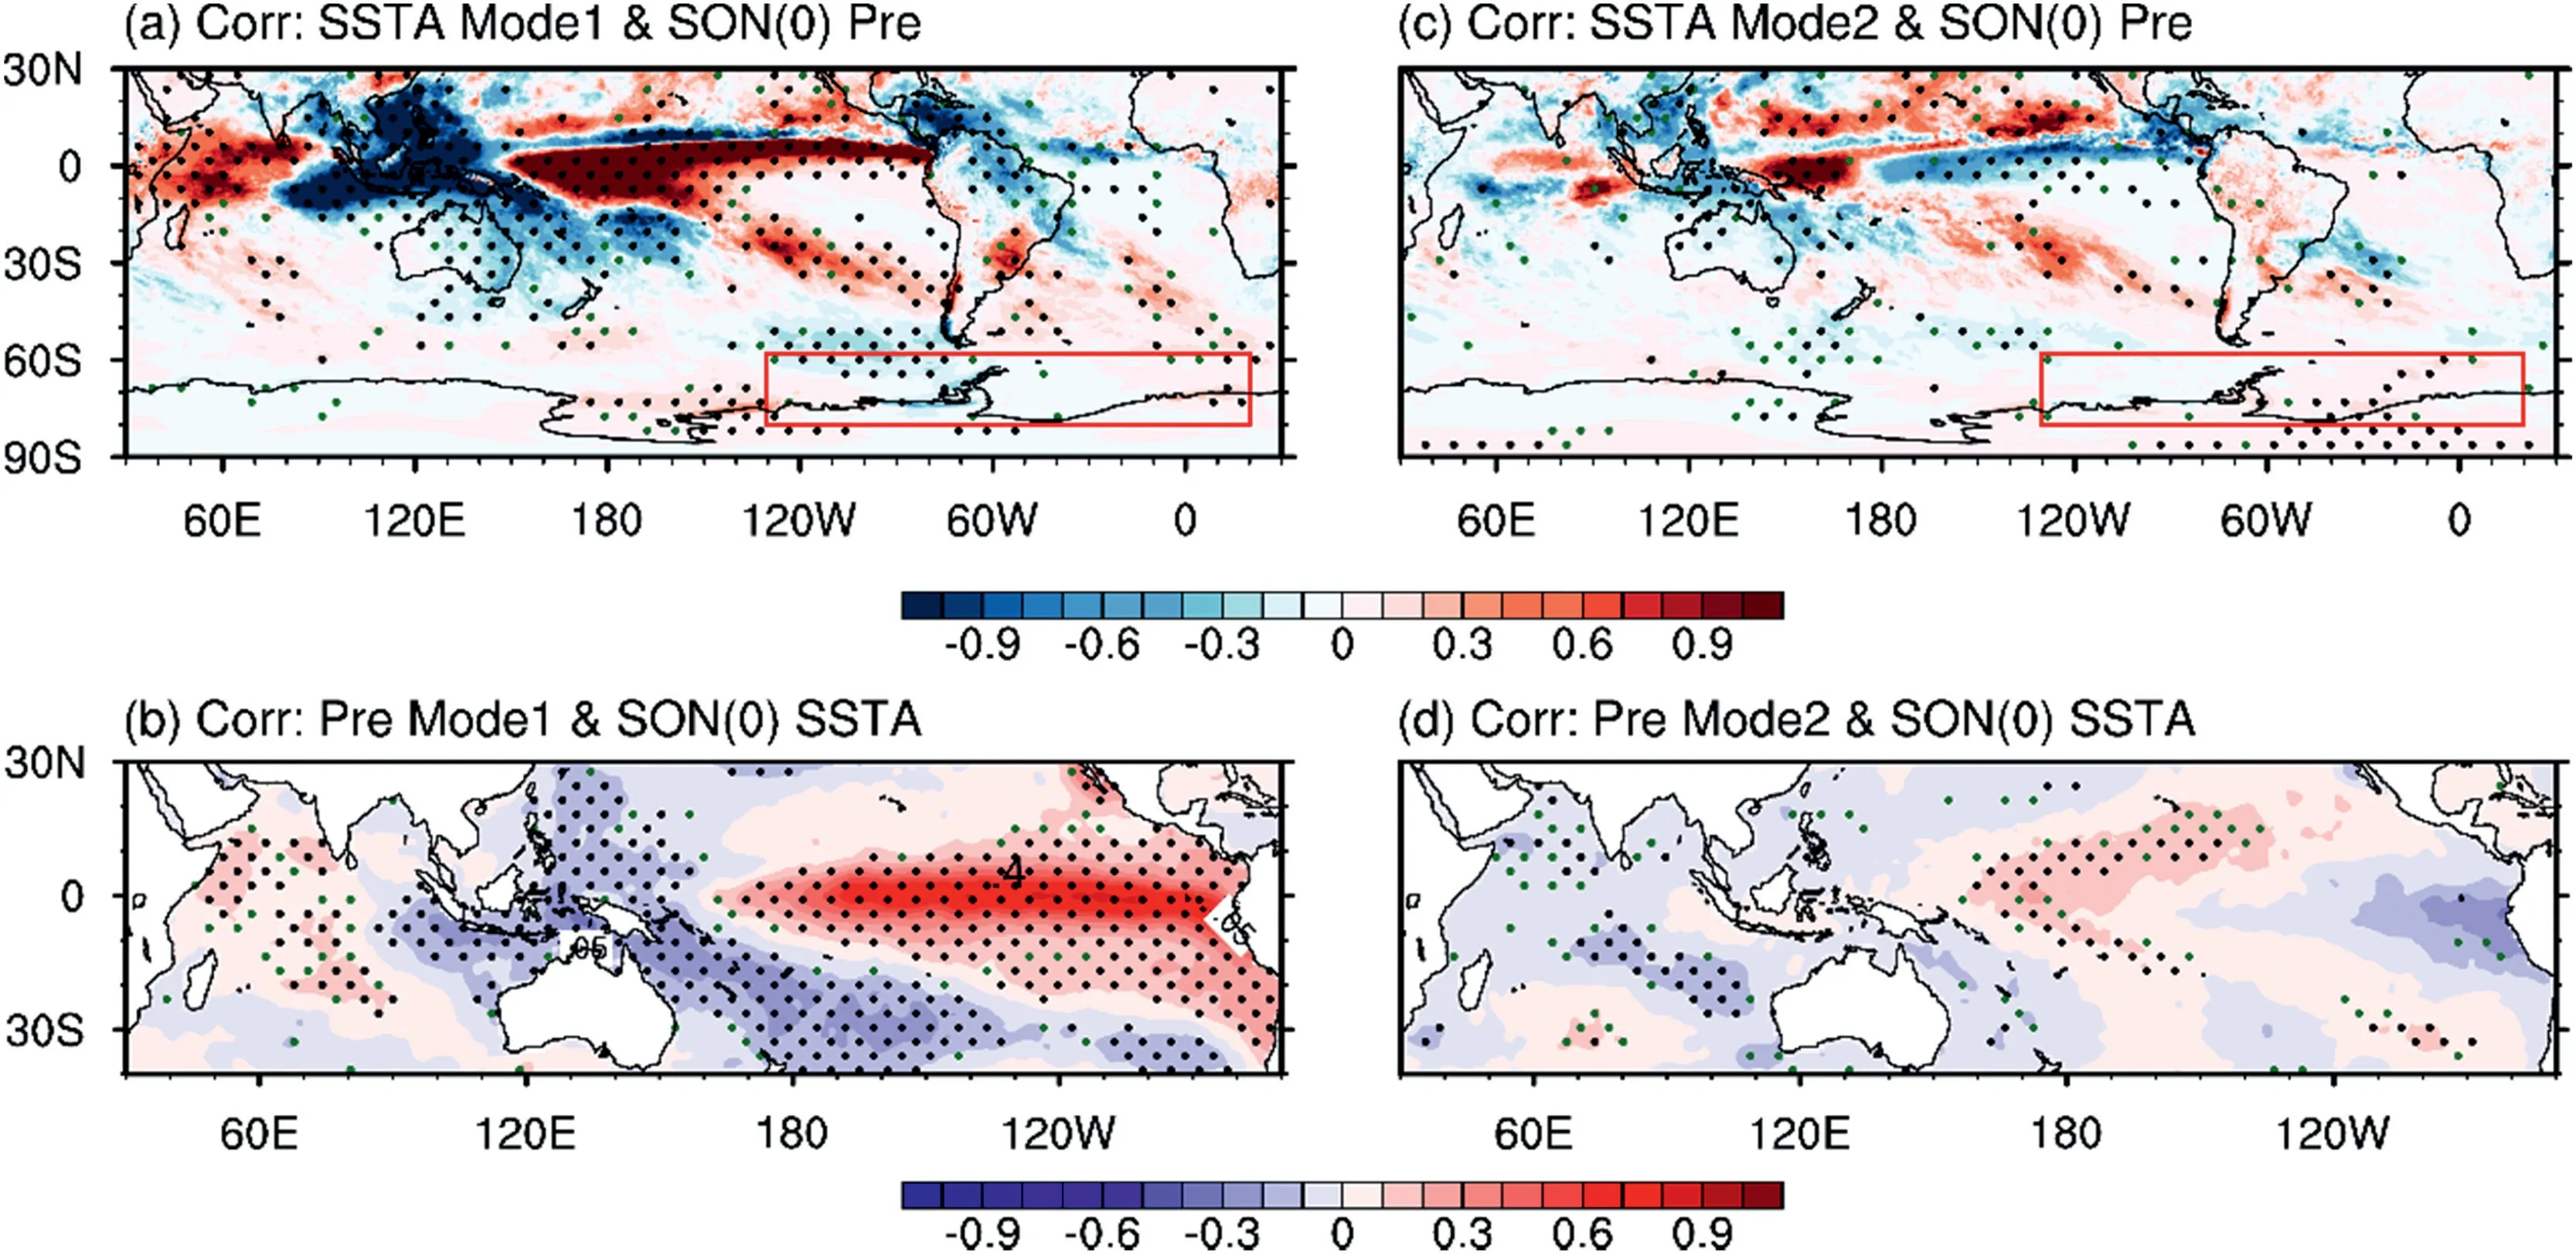
Fig.3.(a,c) Regression of precipitation anomalies in SON (0) against the time series of SSTA for MCA mode 1 and mode 2 (red lines in Fig.2(b) and 2(d)),respectively.(b,d)As in(a,c)but the regressions of the SSTA against the time series of precipitation anomalies for the two MCA modes(blue lines in Fig.2(b)and 2(d)),respectively.Red boxes in(a,c)represent the ABWS.Dark green(black)stippled areas indicate statistical significance at the 90%(95%)confidence level.
The second MCA mode (mode 2) explains 11.8% of the total covariance.In contrast to mode 1,SSTA mode 2 exhibits a zonal tripole pattern,with a positive SSTA in the central tropical Pacific and negative one in both the western and eastern tropical Pacific.Accordingly,a zonal dipole precipitation mode appears between the Amundsen—Bellingshausen seas and the Weddell Sea (Fig.2(c)),which bears a resemblance to both the composite results (Fig.1(f—h)) and the distribution of the regression of the abnormal precipitation against the time series of SSTA mode 2 (Fig.3(c)).Broadly,the above results verify the impacts of CP El Niño on the precipitation over the ABWS.
3.2.Possible mechanisms
Previous studies have shown that the tropical SSTA associated with El Niño can stimulate Rossby waves in the upper troposphere to higher latitudes (e.g.,Clem et al.,2019).Two Rossby waves are forced by the EP El Niño-related SSTA,which emanate from the eastern equatorial Indian Ocean and the south-central subtropical Pacific (within 160°—120°W),respectively,and both propagate southeastward (Fig.4(a,b)).They converge in the South Pacific,causing an anomalous anticyclone and cyclone centered in the Ross—Amundsen—Bellingshausen seas and the Weddell Sea,respectively (Fig.4(a—c)).As a result,strong lowerlevel southerly wind anomalies appear in the region between anticyclone and cyclone anomalies,which leads to a northward advection of drier and colder air from higher latitudes into the Bellingshausen—Weddell seas,thus reducing precipitation there(Fig.4(d)).
In comparison,only one meridional Rossby wave train is forced by CP El Niño,which exhibits a positive (southwestern tropical Pacific)—negative (east of New Zealand)—positive (Ross Sea)—negative (Bellingshausen Sea)center structure(Fig.4(e,f)),with a weakened amplitude,and its location shifts westward by 20°—30°of longitude compared with that generated by the EP type.As a result,the Ross—Amundsen seas and central Bellingshausen—Weddell seas are controlled by anomalous high and low pressure,respectively (Fig.4(g)).Correspondingly,anomalous lower-level southerly winds between the anomalous anticyclone and cyclone induce northward advection of colder and drier air,thus reducing precipitation in the Amundsen—Bellingshausen seas,especially the Antarctic Peninsula.In contrast,anomalous northerly winds to the east of the anomalous cyclone advect warmer and wetter air into the Weddell Sea,leading to moisture convergence and thus increasing precipitation there(Fig.4(h)).
4.Summary and discussion
Previous studies show that precipitation over West Antarctica,especially the Antarctic Peninsula,is less correlated with El Niño(Carrasco and Cordero,2020;Guo et al.,2004;Genthon and Cosme,2003).This is inconsistent with the substantial correlation between the signals in the tropical Pacific SST and the atmospheric circulations in the southern mid-to-high latitudes.One possible reason is that these previous studies did not distinguish between the two main types of El Niño,i.e.,EP and CP El Niño.When we classified El Niño events into EP and CP types,we found that the EP type corresponds to reduced precipitation over the region from the Bellingshausen Sea to the Weddell Sea,including the Antarctic Peninsula,while the CP type corresponds to a dipolar precipitation anomaly in the ABWS,with a reduction over the Amundsen—Bellingshausen seas and an increase over the Weddell Sea.The Antarctic Peninsula is located just along the nodal line of this precipitation dipole linked to the Antarctic Peninsula,with increased precipitation over the eastern Antarctic Peninsula but a reduction over the western Antarctic Peninsula.
Mechanistically,in EP El Niño events,the tropical heat sources trigger two branches of Rossby wave trains emanating from the eastern tropical Indian Ocean and the south-central subtropical Pacific,respectively,and propagating southeastward.These two wave trains converge in West Antarctica,resulting in an anomalous anticyclone(cyclone)over the Ross—Amundsen—Bellingshausen seas (Weddell Sea).Consequently,anomalous southerly winds to the east (west) of the anomalous anticyclone (cyclone) advect drier and colder air into the Bellingshausen—Weddell seas,especially the Antarctic Peninsula,serving to decrease the precipitation there.
In CP El Niño events,there is only one meridional Rossby wave emanating from the southwestern tropical Pacific,with weak amplitude and a 20°—30°westward shift in longitude compared with those caused by the EP type.As a result,the Ross—Amundsen seas (Bellingshausen—Weddell seas) are governed by an anomalous anticyclone and cyclone.Anomalous southerly winds to the east(west)of the anomalous anticyclone(cyclone)induce northward advection of colder and drier air,thus reducing the precipitation over the Amundsen—Bellingshausen seas.In contrast,anomalous northerly winds to the east of the anomalous cyclone act to advect wetter and warmer air into the Weddell Sea area,thus increasing precipitation there.
Our study suggests that EP and CP events have similar impacts on precipitation over the Amundsen—Bellingshausen seas,but opposite impacts on that over the Weddell Sea,including the eastern Antarctic Peninsula.This accounts for the uncertainty in ENSO’s influences on precipitation over the Antarctic Peninsula.Moreover,because of cancelling each other out in terms of the precipitation response induced by the two kinds of ENSO,the composite ENSO signal being less significant,as found by Carrasco and Cordero(2020),is thus understandable.
One recent study by Zhang et al.,(2021),who forced the GFDL dry AGCM with the tropical heating corresponding to the two kinds of ENSO,found a modest difference in atmospheric circulation and near-surface wind responses to the two ENSO types (Fig.5),and such a difference bears substantial consistency with the present observational composites(Fig.5(a,b)).Thus,the difference in the composite West Antarctica precipitation between the two kinds of ENSO can be explained as an effect of the ENSO types themselves.
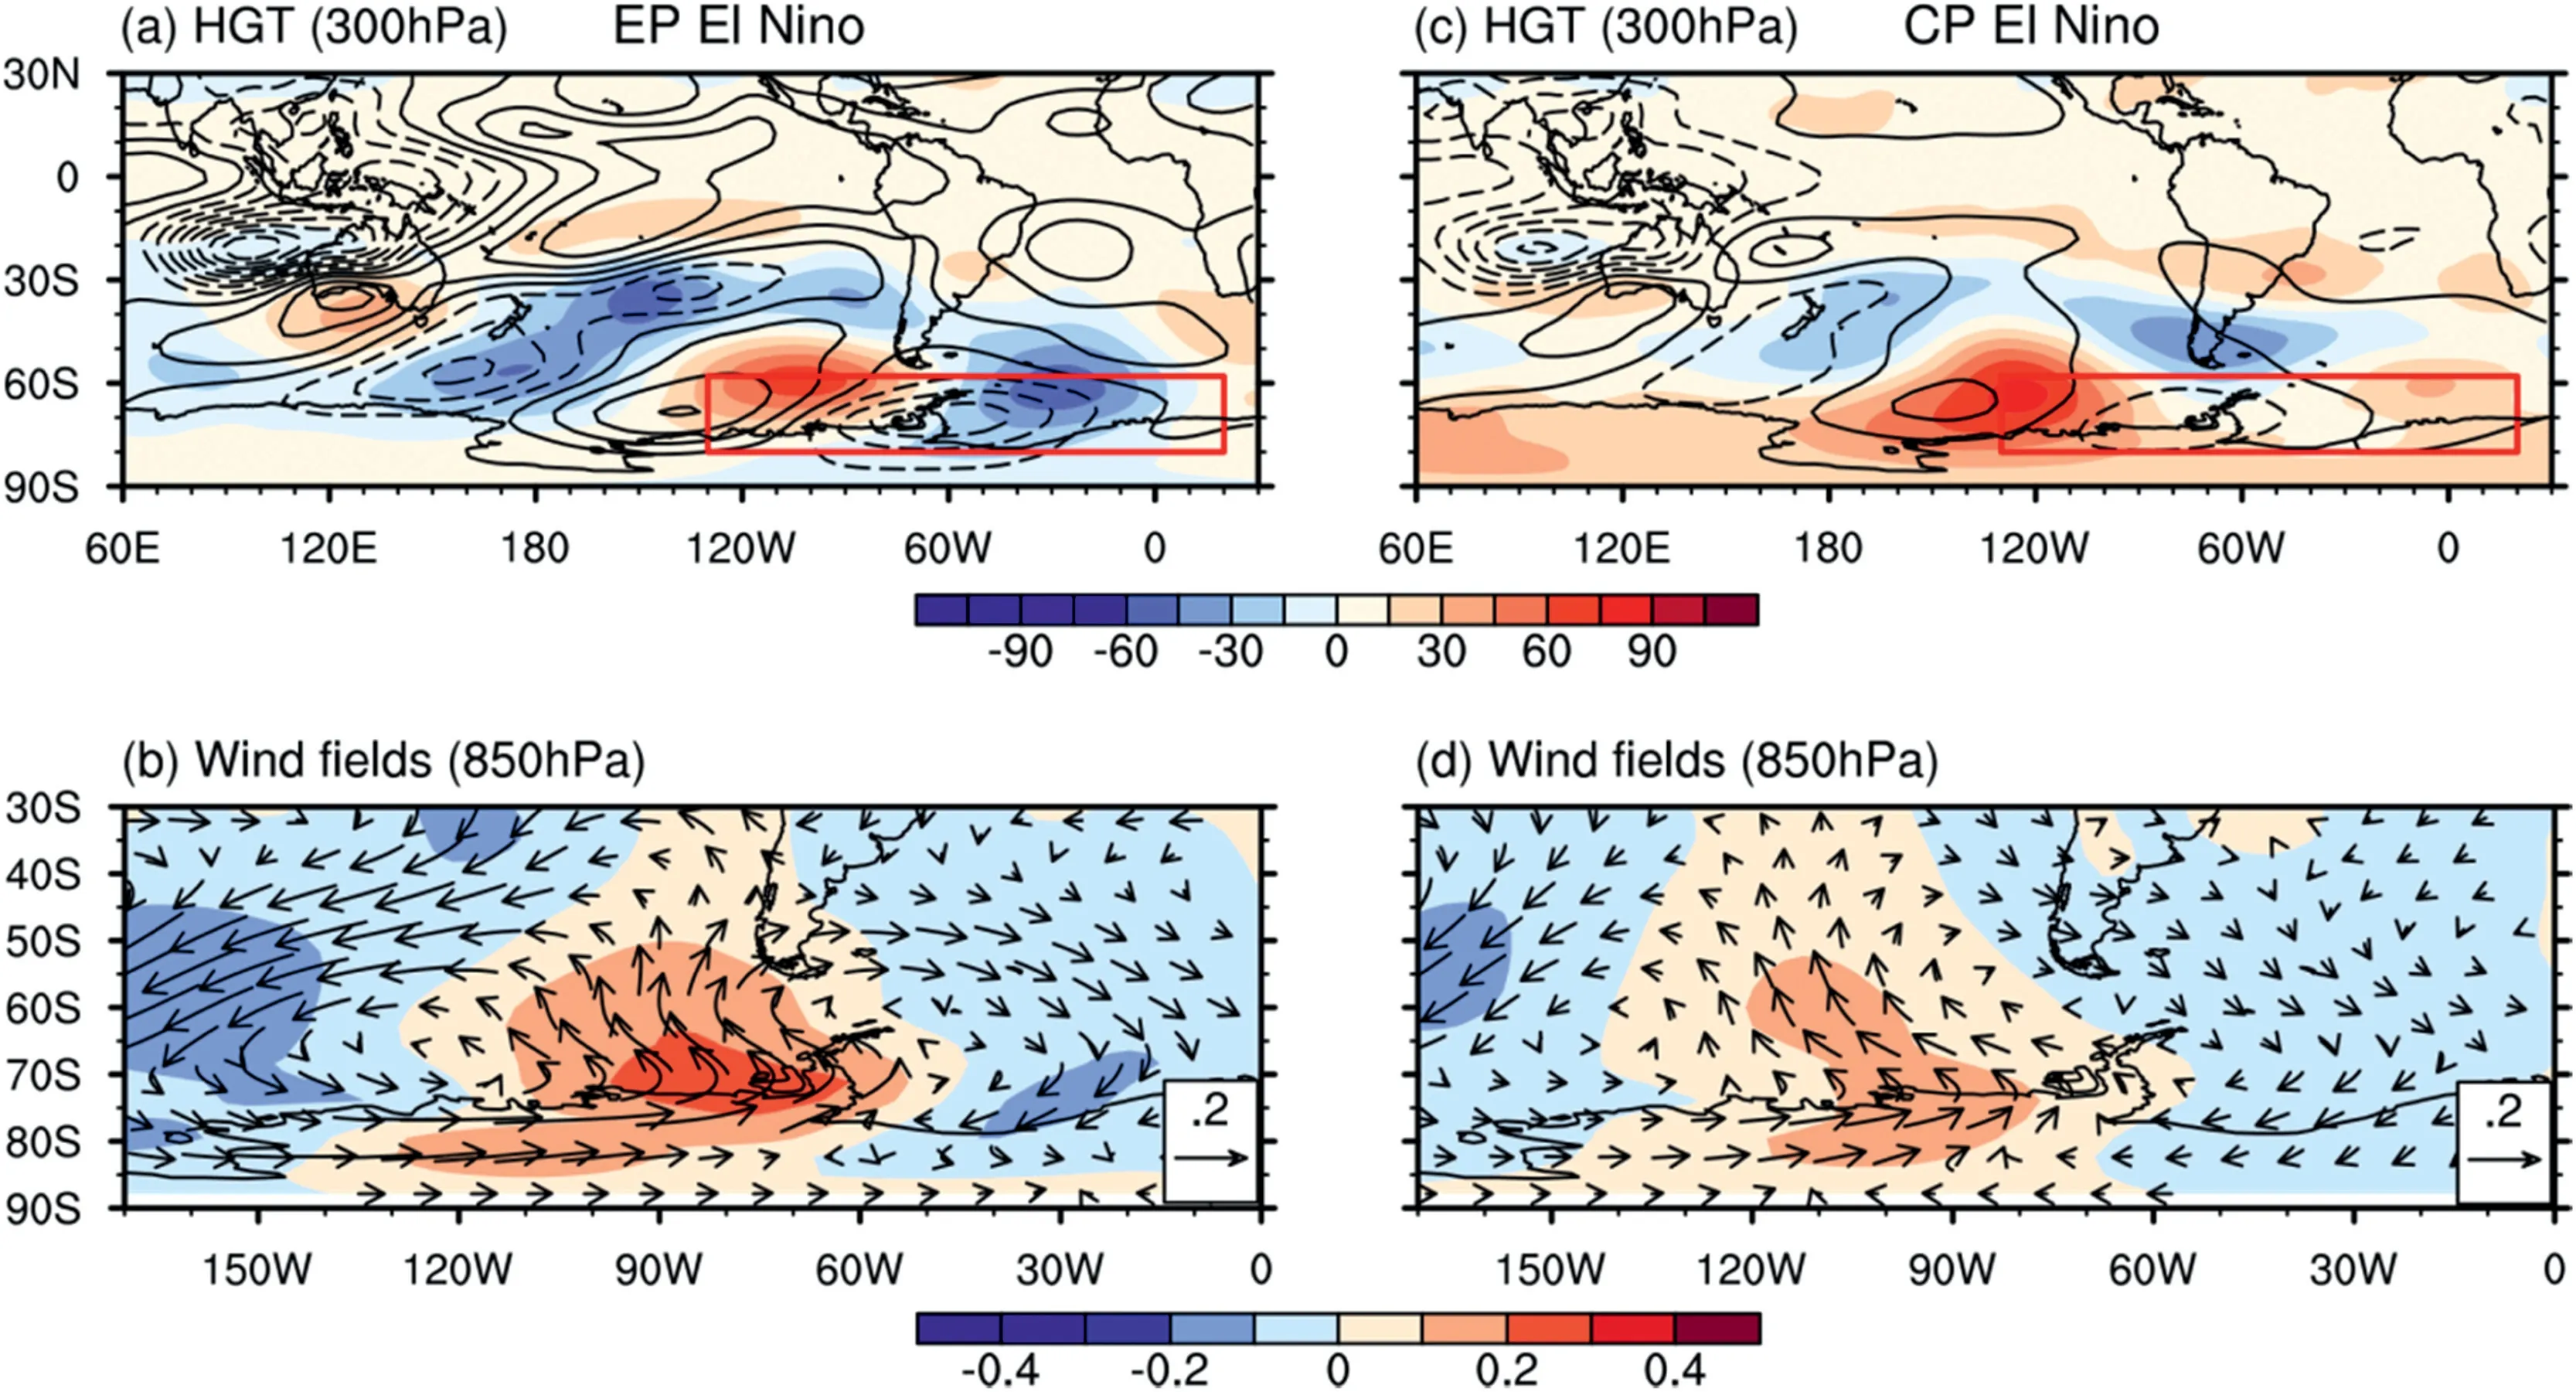
Fig.5.(a,b)GFDL dry AGCM simulated responses of 300 hPa geopotential height(contours;interval:15 m)and 850 hPa wind field(units:m s-1)to the prescribed diabatic heating associated with EP cases.(c,d) As in (a,b) but for the CP cases.Shading in (a,c) is the observational composite of 300 hPa geopotential height anomalies (interval: 15 m) in the eight EP and six CP cases in 1980—2019 for comparison,and shading in (b,d) denotes the 850 hPa meridional wind component.Red boxes in(a,c)represent the ABWS region.
Funding
This work was jointly supported by the Strategic Project of the Chinese Academy of Sciences [grant number XDA19070402] and the National Natural Science Foundation of China [grant number 41790473].
Supplementary materials
Supplementary material associated with this article can be found,in the online version,at doi:10.1016/j.aosl.2023.100387.
杂志排行

Atmospheric and Oceanic Science Letters的其它文章
- Skill improvement of the yearly updated reforecasts in ECMWF S2S prediction from 2016 to 2022
- Research progress on inter-monthly winter temperature variation in East Asia and climate prediction
- Precursory atmospheric teleconnection patterns for strong Siberian High events
- Contribution of external forcing to summer precipitation trends over the Qinghai—Tibet Plateau and Southwest China
- Impact of the Asian—Pacific Oscillation on early autumn precipitation over Southeast China:CMIP6 evaluation and projection
- More extreme-heat occurrences related to humidity in China