Experimental studies on the propagation of whistler-mode waves in a magnetized plasma structure with a non-uniform density
2023-10-08LonglongSANG桑龙龙QuanmingLU陆全明JinlinXIE谢锦林QiaofengZHANG张乔枫WeixingDING丁卫星YangguangKE柯阳光XinliangGAO高新亮andJianZHENG郑坚
Longlong SANG(桑龙龙),Quanming LU(陆全明),∗,Jinlin XIE(谢锦林),Qiaofeng ZHANG(张乔枫),Weixing DING(丁卫星),Yangguang KE(柯阳光),Xinliang GAO(高新亮) and Jian ZHENG(郑坚)
1 Deep Space Exploration Laboratory,School of Earth and Space Sciences,University of Science and Technology of China,Hefei 230026,People’s Republic of China
2 CAS Center for Excellence in Comparative Planetology,CAS Key Laboratory of Geospace Environment,University of Science and Technology of China,Hefei 230026,People’s Republic of China
3 Collaborative Innovation Center of Astronautical Science and Technology,Harbin 150001, People’s Republic of China
4 CAS Key Laboratory of Geospace Environment,School of Nuclear Science and Technology,University of Science and Technology of China,Hefei 230026,People’s Republic of China
Abstract Propagation of whistler-mode waves in a magnetized plasma structure is investigated in the Keda linear magnetized plasma device.The magnetized plasma structure has its density peak in the center,and the background magnetic field is homogeneous along the axial direction.A whistlermode wave with a frequency of 0.3 times of electron cyclotron frequency(fce) is launched into the plasma structure.The wave normal angle(WNA)is about 25°,and the wavefront exhibits a wedge structure.During propagation of the whistler wave,both the propagating angle and WNA slowly approach zero,and then the wave is converged toward the center of the structure.
Therefore,the wave tends to be trapped in the plasma structure.The results present observational evidence of the propagation of a whistler-mode wave trapped in the enhanced-density structure in a laboratory plasma.This trapping effect is consistent with satellite observations in the inner magnetosphere.
Keywords: whistler wave,laboratory plasma,density duct
1.Introduction
Whistler-mode waves in the Earth’s magnetosphere play an important role in the electron dynamics of the Van Allen radiation belt [1-5].It is generally accepted that whistlermode waves are excited near the Earth’s magnetic equator and then propagate toward the higher latitudes [6-9].However,during such a process,these waves are largely attenuated due to Landau damping in the higher latitudes because their wave normal angles(WNAs)become increasingly larger[10,11].Both satellite observations and theoretical investigations have indicated that non-uniform density structures that are transverse to the background magnetic field in the magnetosphere can trap and then guide whistler-mode waves to the higher latitudes [11-16],which leads to efficient acceleration and precipitation of energetic electrons in the radiation belt [17,18].
To model the effects of non-uniform density structures on the propagation of whistler-mode waves,numerous theoretical and observational works have been carried out[14,16].The theoretical works have shown that both highdensity and low-density structures can guide whistler-mode waves.Whistler-mode waves can be guided by low-density structures above low hybrid frequencies,whereas whistlermode waves with frequencies below 0.5 electron cyclotron frequencies(fce) can be trapped by high-density structures[15,16].Note that the guidance of a whistler wave by enhanced-density structures could occur in the leaky-wave regime between the lower hybrid frequency and half the gyrofrequency [19-21].Satellite observations in the high latitudes have also shown that the WNAs of whistler-mode waves in the non-uniform density structures are near 0°,which indicates the trapping of these waves in density structures.Previous observations only revealed the correlation between density variations and chorus wave occurrence[14,22].Furthermore,satellite observations cannot provide the details of whistler-mode wave propagation since only physical quantities along the satellite trajectory are available [3,23].
Laboratory plasma provides an ideal environment to investigate the propagation of whistler-mode waves in further detail [19-22],because plasma parameters can be diagnosed at any desired point.Previous experiments have investigated modulations of whistler-mode waves in a plasma structure with low-density plasma [24].Stenzelet alused the antenna to produce the whistler-mode wave in the Large Plasma Device(LAPD) and found that in a non-uniform density structure(a field-aligned plasma structure with a non-uniform density perpendicular to the background magnetic field),whistler-mode waves with frequencies larger than 0.5fcetend to propagate toward the low-density region,while the waves with frequencies less than 0.5fcedo not propagate to the center of the density structure [25].Gekelmanet alobserved the convergence of whistler-mode waves with frequencies larger than 0.5fcein a low-density structure[26,27].The undamped whistler wave with frequencies less than 0.5fcein an enhanced-density structure has been observed along the axial direction in previous experiments,which implied the trapping effect of the whistler wave [28].However,previous experiments have not yet shown how whistler waves with frequencies less than 0.5fcepropagate in an enhanced-density structure.
In this work,we investigate the propagation of the whistler-mode wave in a high-density structure using the antenna to stimulate whistler-mode waves in plasmas with frequencies less than 0.5fce.This work presents observational evidence of the propagation of a whistler-mode wave trapped in the enhanced-density structure in a laboratory plasma.
2.Experimental setup
The experiments are based on the Keda linear magnetized plasma(KLMP) device.The device consists of a main vacuum chamber and a set of axial magnetic field coils.The main vacuum chamber is composed of a cylindrical vacuum vessel made from stainless steel with a diameter of about 25.5 cm and a length of about 2 m.The set of axial magnetic field coils is nested outside the vacuum chamber of the linear device,which creates a uniform axial background magnetic field.The plasma source is set on one end of the device,which employs a barium oxide cathode to emit electrons.The emitted electrons create the background plasma through collisional ionization of the neutral fill gas.Here,argon is used as the fill gas.The plasma source works in the pulse discharge mode,at which the discharge duration is about 20 ms and the period is about 1 s.The plasma density can reach up to the order of 1018m-3,and the electron temperature is about 4 eV.A schematic diagram of the experimental setup in the KLMP device is shown in figure 1.In this experiment,the axial magnetic field is about 60 G in the +zdirection,the electron plasma frequencyfpeis about 6×10⁹Hz,the electron cyclotron frequencyfceis about 1.7×10⁸Hz,and the ratio of electron thermal pressure to magnetic pressure,i.e.the electron plasma,βe,is about 0.07.

Figure 1.A top-view diagram of the KLMP device.
The loop antenna is employed to generate electromagnetic variations to produce whistler-mode waves in a laboratory plasma [29].As shown in figure 1,the loop antenna is composed of two turns of a rectangle loop with a size of about 4 cm×2.5 cm.The dipole direction of the antenna points to theydirection,which is perpendicular to the axis of the device.The antenna located at the center of the chamber is movable along thezdirection.The frequency is chosen at 5×10⁷Hz(about 0.3fce) to produce the whistlermode waves by the antenna [24,30].The emitted waveform is a pulsed sinusoidal signal with a duration of about 1μs,and is triggered about 5 ms after the start of the pulsed discharge.The sinusoidal signal from the signal generator(SRS SG382)is modulated by the signal of a rectangular pulse of the digital delay generator(SRS DG645).Here,we set the position of the antenna in the axial direction as the reference point,which isz=0 cm.
A two-dimensional diagnostic plane is arranged in the chamber,which is responsible for the measurement of the magnetic field and plasma density in thex-yplane.Two types of probes are used in the two-dimensional diagnostic platform:the classic Langmuir probe is used to obtain the density and temperature data;and the high-frequency magnetic probe is responsible for diagnosing the perturbation signals of the magnetic field.By changing the distance between the antenna and the two-dimensional diagnostic plane,a three-dimensional profile of the waves can be reconstructed.The spatial distribution of the magnetic perturbation and density is obtained by point-by-point scanning and multiple averaging(5-10 times),where the pulsed plasma discharge in the KLMP device is considered to have good repeatability[31,32].The spatial resolution in thezdirection is 1 cm,and the spatial resolution in thex-yplane is 0.5 cm.The experimental data are collected by an oscilloscope with a 5 GHz sampling rate.The perturbed magnetic field uses the arbitrary units(A.U.),which are normalized by the maximum of the perturbed magnetic field.

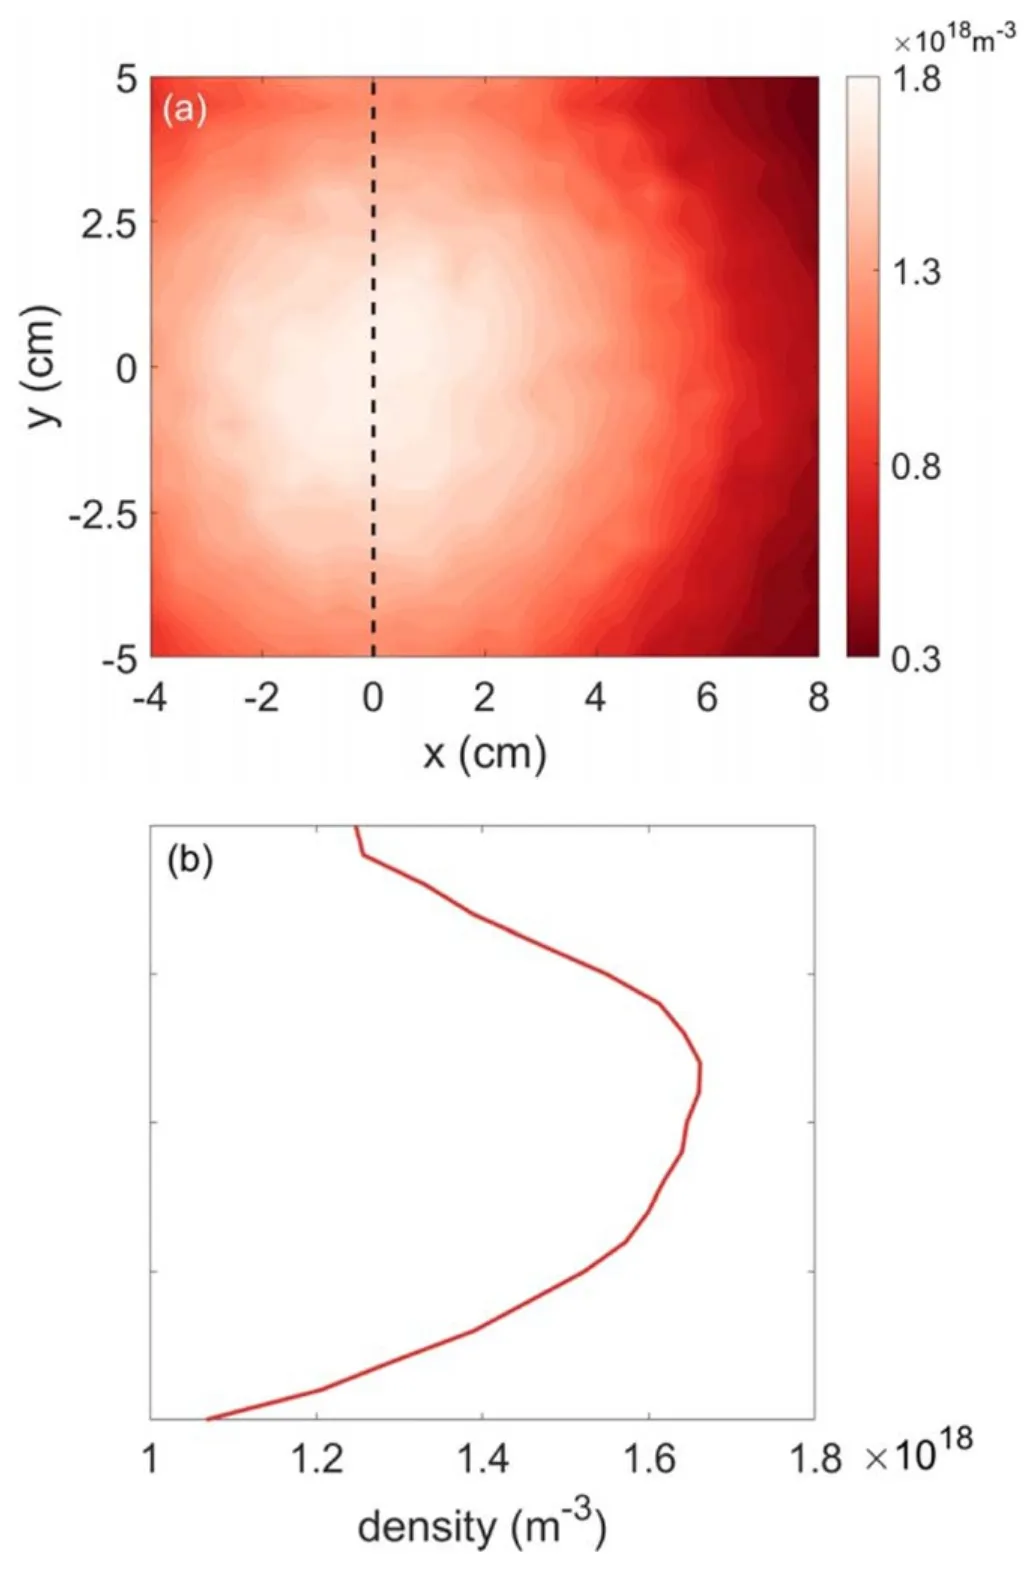
Figure 2.(a)The plasma density in the x-y plane(at z=20 cm),and(b)the density profile along the line x=0 cm in the same plane(the black dashed line in(a)).
3.Experimental results
The plasma density profile in thex-yplane(atz=20 cm) is shown in figure 2(a),and the corresponding density along the line(x=0 cm) in the plane is described in figure 2(b).The structure of the plasma in the linear device is an axially extending plasma structure,whose peak density is located around the center of the chamber(x,y)=(0 cm,0 cm).The peak plasma density is about 1.65×10¹⁸m-3.The plasma density drops to about 1.1×10¹⁷m-3at the edge of the diagnostic region,and the scale of the enhanced-density structure is about 6 cm(defined as the region more than 90% of the peak plasma density).The antenna placed in the highdensity region injects the whistler-mode waves into the chamber.

Figure 3.(a) and(b) The vectors of the perturbed magnetic field(δBx,δBy) in the x-y plane(at z=20 cm) diagnosed at t=0.21,0.215 μs.Here,the direction and length represent the direction and amplitude of the perturbed magnetic field.(c)-(f) The magnetic perturbation δBx at different axial distances(z=15-45 cm along the line(x,y)=(0 cm,0 cm)).
After the whistler-mode waves are injected into the plasma,the corresponding variations of the magnetic field can be diagnosed by the magnetic coil probe.Figures 3(a)and(b)show the vectors of the perturbed magnetic field(δBx,δBy)in thex-yplane(atz=20 cm),which are diagnosed att=0.21,0.215μs,respectively(here,the time interval is a quarter of the wave period).Att=0.21μs,the perturbed magnetic field in the central region almost points to the+ydirection,while it almost points to the +xdirection at 0.215μs.Therefore,the vector of the perturbed magnetic field in thex-yplane rotates counterclockwise about 90°.Because the background magnetic field points to the +zdirection and the wave vector is almost in the+zdirection,the wave is right-handed polarized,which is consistent with that of whistler-mode waves.
Figures 3(c)-(f)show the perturbed magnetic fieldδBxat different axial distances(along the(x,y)=(0 cm,0 cm)).The wave signals received by the magnetic probe exhibit a monochromatic sinusoidal form,and have a time delay from the excitation from the antenna.Because the group and the phase velocities are the propagation velocities of the wave packet and wave phase,respectively,in our experiment,the first received perturbed signal yields the site of the wave packet,while the continuous signal with the same phase reveals the wave phase [22].The time difference of the first received signal of the perturbed magnetic field is about 0.083μs betweenz=15 and 45 cm(figures 3(c)and(f)).Thus,the component of the group velocity in the direction of the parallel magnetic field isvg‖≅3.6×10⁶m s-1,and the group velocity is nearly field-aligned,as described later.Similarly,according to the time delay and spatial distance correspondingto the continuous wave,we can calculate the phase velocity in the parallel direction,which isvp‖≅2.7×10⁶m s-1.

Figure 4.The perturbed magnetic field δBz in the x-y plane(at z=20 cm),which is diagnosed at t=0.24 μs(a),0.245 μs(b).
Figures 4(a) and(b) show the perturbed magnetic fieldδBzin thex-yplane(atz=20 cm),which is diagnosed att=0.24,0.245μs(here,the time interval is a quarter of the wave period).The axial magnetic fieldδBzwith two poles rotates counterclockwise with the time evolution.Together with the in-plane perturbed magnetic field(δBx,δBy)shown in figures 3(a) and(b),it can be observed that the launched whistler-mode wave is dominated by the helicon mode withm=+1 [33].Extrapolating to three-dimensional,the phase surface would be an axially rotating helical surface.To analyze the propagation of the whistler-mode waves intuitively,the projection of the phase surface in they-zplane is analyzed below.
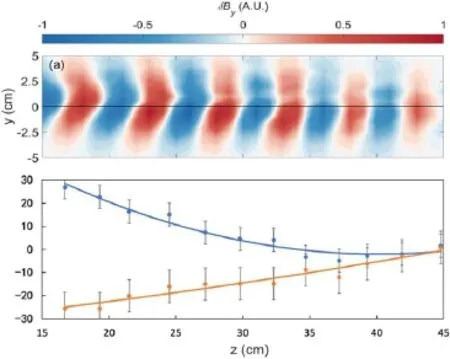
Figure 5 shows the characteristics of the whistler-mode waves propagating in the plasma structure.Figure 5(a)shows the distribution of the perturbed magnetic fieldδByin the planex=0 cm att=0.4μs,and figure 5(b) presents the average WNAs of the two wave modes att=0.4μs.The whistler-mode waves are injected into the chamber atz=0 cm.In the upper part,the wave propagates toward the upperright direction,and the WNA is positive.In the lower part,the wave propagates toward the lower-right direction with a negative WNA.These are the characteristics of a helical whistler-mode wave.Aroundz=15 cm,the WNAs are about 25° and-25° in the upper and lower parts,respectively,and the wavefront appears as a wedge structure.The wavelength is estimated to be about 6 cm,and the wavenumber is about1.05 cm-1.As the whistler-mode wave propagates along the+zdirection,the values of the WNAs are becoming increasingly smaller,and approach 0° aroundz=40 cm,where the waves become quasi-parallel.

Figure 5.(a) The distribution of the perturbed magnetic field δBy in the plane x=0 cm at t=0.4 μs.The black solid line(x=0 cm,y=0 cm) is plotted for reference.(b) The average WNAs of the upper wave(the red curved line) and lower wave(the blue curved line) at t=0.4 μs.The upper and lower waves represent the whistler-mode waves in the upper and lower sides,respectively.The curved lines are fitted using the second-order polynomial fitting method based on the experimental measurements(dots in the figure).
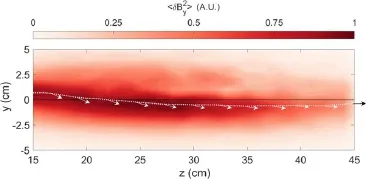
Figure 6 shows the averaging amplitude of the perturbed magnetic field 〈〉 att=0.2-0.6μs(here,〈〉 is the average value ofin tens of wave periods during the time of 0.2-0.6μs).The dotted line marks theyposition,where 〈〉attains its maximum value at a fixedzposition.If we assume that the background plasma conditions do not change in a period of time,which is reasonable in our experiments,the line can be considered to be the propagation trajectory of the whistler-mode waves.In this figure,we also plot the direction of the wave vectors in the lower part at this line with the arrows.The wave mode at first propagates toward the lowerright,and then the trajectory becomes almost parallel to thezdirection.Finally,the wave mode propagates toward the upperright.The evolution of the wave vectors has a similar trend.Obviously,the emitted waves are trapped in the plasma structure with an enhanced plasma density.

Figure 6.The averaging amplitude of the perturbed magnetic field〈〉during the time of 0.2-0.6 μs(here,〈〉is the average value of in tens of wave periods during the time of 0.2-0.6 μs).The dotted line marks the y position,where 〈〉 attains its maximum value at a fixed z position,and the arrows in the line denote the directions of the wave vectors.
4.Conclusions and discussion
In this paper,we investigated the propagations of whistlermode waves in a magnetized plasma structure with an enhanced plasma density in the KLMP device.A whistlermode wave at 0.3fceis launched into a plasma structure,and the plasma density is enhanced in the center of the structure.The excited waves are dominated by anm=+1 helicon mode.In a cross-section(y-zplane)of the whistler waves,the WNAs are initially about 25°,and the wavefronts exhibit a wedge structure.The waves in the upper and lower part propagate toward the upper-right and lower-right directions,respectively.The propagating trajectory and the wave vectors changed first from oblique to parallel to the background magnetic field.It is obvious that whistler-mode waves with a frequency of about 0.3fcecan be trapped in a magnetized plasma structure with an enhanced plasma density.
Both satellite observations and simulations have demonstrated that whistler-mode waves in the Earth’s inner magnetosphere are excited near the equatorial region,and then propagate to higher altitudes.The WNAs of the whistlermode waves become increasingly larger during the propagation,and the amplitudes are attenuated greatly due to Landau damping.However,satellites at higher altitudes have observed large amplitude quasi-parallel whistler waves,and it is assumed to be caused by the trapping effects of whistlermode waves in irregular density structures.Theoretical works have indicated that a plasma structure with an enhanced plasma density can trap whistler-mode waves with frequencies lower than 0.5fce[11,16,18],which is verified in our experiments.
Acknowledgments
This work was supported by the Strategic Priority Research Program of the Chinese Academy of Sciences(No.XDB 41000000),the Key Research Program of Frontier Sciences,CAS(No.QYZDJ-SSW-DQC010),and Fundamental Research Funds for the Central Universities(Nos.WK3420000006,WK3420000013,WK3420000017 and WK2080000135).
猜你喜欢
杂志排行
Plasma Science and Technology的其它文章
- Plasma Science and Technology
- The magnetic field design of a solenoid for the cold-cathode Penning ion source of a miniature neutron tube
- Research on the energy consumption mechanism and characteristics of the gallium indium tin liquid metal arcing process
- Chemical and physical studies of metallic alloy-based old Indian coins with LIBS coupled with multivariate analysis
- Effects of anode material on the evolution of anode plasma and characteristics of intense electron beam diode
- Simulation of DC glow discharge plasma with free-moving dust particles in the radial direction
