The magnetic field design of a solenoid for the cold-cathode Penning ion source of a miniature neutron tube
2023-10-08ShaoleiJIA贾少雷ZhaohuLU逯兆虎GuanghaoLI李广豪SiyuanCHEN陈思远YingyingCAO曹莹莹PingweiSUN孙平伟ShangruiJIANG姜尚芮HailongXU许海龙andShiweiJING景士伟
Shaolei JIA(贾少雷),Zhaohu LU(逯兆虎),Guanghao LI(李广豪),Siyuan CHEN(陈思远),Yingying CAO(曹莹莹),Pingwei SUN(孙平伟),Shangrui JIANG(姜尚芮),Hailong XU(许海龙) and Shiwei JING(景士伟)
School of Physics,Northeast Normal University,Changchun 130024,People’s Republic of China
Abstract A high-yield and beam-stable neutron tube can be applied in many fields.It is of great significance to the optimal external magnetic field intensity of the cold-cathode Penning ion source(PIS) and precisely controls the movement of deuterium(D),tritium(T) ions and electrons in the source of the neutron tubes.A cold-cathode PIS is designed based on the solenoidal magnetic field to obtain better uniformity of the magnetic field and higher yield of the neutron tube.The degree of magnetic field uniformity among the magnetic block,double magnetic rings and solenoidal ion sources is compared using finite element simulation methods.Using drift diffusion approximation and a magnetic field coupling method,the plasma distribution of hydrogen and the relationship between plasma density and magnetic field intensity at 0.06 Pa pressure and a solenoid magnetic field are obtained.The results show that the solenoidal ion source has the most uniform magnetic field distribution.The optimum magnetic field strength of about 0.1 T is obtained in the ion source at an excitation voltage of 1 V.The maximum average number density of monatomic hydrogen ions(H+) is 1×10⁸ m-3,and an ion-beam current of about 14.51 μA is formed under the-5000 V extraction field.The study of the solenoidal magnetic field contributes to the understanding of the particle dynamics within the PIS and provides a reference for the further improvement of the source performance of the neutron tube in the future.
Keywords: plasma,PIS,DDA,magnetic field intensity
1.Introduction
The increase in neutral beam injection thermonuclear fusion equipment and the proposal of the international thermonuclear experimental reactor plan have promoted the development and research of various ion sources.Because of its relatively mature simple structure,stable performance and long life,the Penning ion source(PIS) is widely used in the key start-up components of a particle accelerator,neutron tube and ion implanter.The principle of the PIS ion source is that the initial electrons in the source are accelerated in the spiral motion under the combined action of an electric field and a magnetic field and collide with the cathode plate to produce secondary electrons.These electrons collide with neutral background gas molecules,resulting in gas ionization and a self-sustaining discharge.Meanwhile,the PIS has the advantage of being able to maintain a low-pressure stable discharge at 10-1-10-3Pa,and therefore has a wide range of applications in magnetron sputtering [1] and fusion applications [2].
Sealed neutron tubes,as an important application result of the application of fusion technology,have been widelyused in a variety of applications,such as oil logging [3],medical irradiation [4],coal analysis [5],explosives [6] and drug detection [7],and large scientific installations [8].The principle is that the deuterium ion(D+) is generated by the PIS and accelerated by the extraction system and then reacts with the tritium(T) or deuterium(D) gas released by the target,emitting 14.1 MeV or 2.5 MeV of neutrons [9].The ionization completion of the existing PIS is generally poor,and the atomic ion(H+)fraction of hydrogen is usually below 10% [10].Increasing the single-atom ion ratio can enhance the neutron-tube yield.The Penning source discharge parameters are related to factors such as the operating gas pressure,electromagnetic field spatial configuration,geometric scale and materials.The physical reactions within the ion source are numerous,and the use of simulation techniques can provide a deeper understanding of the plasma reactions within the ion source.The current mainstream simulations of plasma discharges are divided into two types: hydrodynamic models,and particle tracking models.The PIS works at low pressure and the discharge is in a non-thermodynamic equilibrium.The electron temperatureTeis much higher than the molecular temperatureTgand the ion temperatureTi[11].Compared with the drift diffusion approximation(DDA)simulation method,it is more suitable for Penning source simulation.In addition,permanent magnets are used for most neutron tubes to provide the magnetic field for the ion source.The configuration of the PIS with permanent magnets is limited by the miniaturization of neutron tubes,and the magnetic field distribution of permanent magnets is not uniform and prone to demagnetization in the vacuum process(due to the excessive temperature in the degassing process).The solenoid,which is controlled by the current beam and the number of turns of the coil,can replace the permanent magnet to provide the magnetic field in the neutron tube.
In this work,a solenoid is utilized to provide a magnetic field to improve the magnetic field uniformity within the source and to find its optimal magnetic field strength.The plasma reaction process in the PIS is described and analyzed based on finite element analysis using the DDA simulation method.The electromagnetic field simulation is combined to investigate the effect of the electromagnetic field configuration provided by the energized solenoid on the discharge of the low-pressure cold-cathode PIS.
2.Simulation
The possibility to simulate part of the plasma is provided by DDA to solve the fluid motion equation under the applied electromagnetic field and self-consistent electromagnetic field.DDA can also track the motion process of a large number of charged particles(electrons or ions),and can be used to obtain the motion state after the collision of a large number of charged particles and,finally,to obtain the distribution of charged particles in the solution time [12].The DDA method can solve but is not limited to plasma density,electron density,electron temperature,electric field,magnetic field,charged particle flow density and other important discharge parameters.The plasma discharge parameters at different times can be observed by setting different solving steps,and the evolutionary relationship of the parameters at time and space can be obtained [13].
2.1.Magnetic fields
Generally speaking,in a certain range of low-voltage Penning discharge,the discharge current is positively correlated with the magnetic field.Increasing the magnetic field strength is conducive to increasing the electron trajectory and radius of motion.The electrons make a Larmor precession along the direction of the magnetic field lines and the self-sustaining discharge produces
In equation(1),meis the electron mass,Bis the axial magnetic field strength,V⊥is the velocity component perpendicular to the axis andRis usually called the Larmor radius.Rshould be greater than the mean free rangeδof electron collisions with neutral background gas molecules,otherwise no plasma discharge will be generated.Most of the ion-source magnetic field of the current sealed neutron tube is provided by external permanent magnets,which can be mainly divided into the upper and lower structure of the magnetic block-type ion source(figure 1)and external double magnetic ring-type ion source(figure 2).
By modeling based on the results of previous design work of a neutron-tube ion source [14],the main structure of the magnetic block-type ion source is shown in figure 1(a).The magnetic field is provided by the samarium cobalt rareearth magnet ring and samarium cobalt rare-earth magnet placed along the axial direction.The magnet size is Φ16×10 mm,and the ring size is Φ(2-16)×10 mm.The magnetic field distribution is shown in figure 1(b),and the surface flux is higher than 0.3 T.
The main structure of the magnetic ring-type ion source is shown in figure 2(a).The magnetic field inside the source is provided by two samarium cobalt rare-earth permanent magnet rings.The surface magnetic field is close to 0.5 T,and the magnetic field of the double magnetic ring-type structure in figure 2(b)is more uniform and symmetrical in distribution than that in figure 1(b),as shown by the shape of the magnetic induction lines.However,it is not enough to use only these to define the magnetic field intensity;therefore,we introduce the concept of the magnetic mirror ratio for quantitative analysis.
The degree of uniformity of the magnetic field inside the ion source can be evaluated using the magnetic mirror ratioB0/Bmaxas a parameter.Here,B0is the magnetic field strength at the position of the particle,andBmaxis the maximum value of the magnetic field strength in the magnetic mirror field.The more the magnetic mirror ratio tends to 1,the more uniform the magnetic field is.When the particle moves from the weak field to the strong field,its initial velocityV0will eventually drop to 0 under the action of the force.That is,all the energy of the particle is converted into axial kinetic energy,and when the initial velocity of the charged particleV0and the angle of the magnetic fielddirectionθhave the relationship shown in equation(2),the particle is reflected.
In this way,the charged particles are constantly moving and oscillating around the magnetic inductance line in the field of the magnetic mirror.It collides with neutral gas molecules and produces free electrons and ions,forming a plasma.The fuller the collision is,the more complete the ionization will be.
Using the concept of the magnetic mirror ratio,quantitative analysis of the degree of magnetic field uniformity in figures 2(b) and 1(b) can be obtained numerically.The magnetic mirror ratio of figure 2(b)is about 0.75,while that of figure 1(b)is about 0.67;thus,it can be seen that the magnetic field of figure 2(b) is more uniform.However,this is not the ideal degree of uniformity; therefore,we propose a new magnetic field design scheme,as shown in figure 3.
To achieve better uniform magnetic field distribution,a solenoid-based cold-cathode PIS with a diameter of 15 mm and a height of 20 mm is designed,as shown in figure 3(a).The cathode and the anticathode are placed along the axial direction,where the anticathode has an extraction hole of about 2 mm in diameter on the axial center to connect with the neutron-tube extraction system.The ion source is axially extracted,the anode cylinder diameter is 14 mm,the height is 15 mm,and a 2000 V stable anode voltage is applied and affixed with the ion-source ceramic shell.The ion-source ceramic housing is placed on the outside of the 7-turn copper solenoid connected to the DC power supply to provide a magnetic field for the ion source.
Unlike the external permanent magnets that provide the magnetic field in figures 1 and 2,the solenoidal ion source can directly adjust the excitation voltage to obtain a continuously adjustable variable magnetic field [15].The magnetic field intensity distribution inside the source(figure 3(b))is quite uniform,with an average internal magnetic inductionintensity of 0.35 T when 4.5 V is used as the excitation voltage,and the intensity of the magnetic field varies less in each direction than that of the permanent magnet field(figures 1(b) and 2(b)).
2.2.Plasma parameters
In the study of low-pressure weakly ionized gas discharge,the DDA simulation method is used to consider the distribution of electrons and ions,and the complex ionization process between electrons and neutral background gas.Hydrogen is used to replace isotope gases,such as deuterium and tritium,and to simulate PIS discharge characteristics in real conditions [33].To a certain extent,the ion-source discharge parameters can be quantitatively analyzed.When using hydrogen as a reaction gas,the main reactions associated with it are elastic collisions,ionization,compounding,excitation,de-excitation and wall reactions [16].Among them,inelasticcollisions are the main types of reactions that ionize the background gas to form ions.The processes are shown in table 1[17-19],where H*with H2*refers to the excited states of H and H2.
In addition,a series of wall reactions need to be considered [20,21].The wall reactions shown in equations(3)-(6) represent the reactions generated when ions bombard the ion-source wall after being accelerated by the electromagnetic field in the source:
It is mainly used to bombard the cathode plate.The sealed neutron-tube ion source mostly uses the cold-cathode PIS,because large numbers of secondary electrons are generated by such bombardment to form a self-sustaining discharge.Under the action of an electromagnetic field,the secondary electrons,like the initial electrons,will produce an ionization reaction with the neutral particle,which is beneficial to the increase in plasma ionization completion.It should be noted that because the H3reaction cross section is relatively small and the content is very small in the actual reaction,this will not be considered in the simulation.In addition,elastic collisions exist in real reactions and should be taken into account in simulations:
For the key reactions in hydrogen,among eighteen inelastic collisions reactions,four wall reactions and two elastic collisions reactions,inelastic collisions reaction 1,inelastic collisions reaction 2,inelastic collisions reaction 5,inelastic collisions reaction 7,inelastic collisions reaction 8 and equations(3)-(5),(7)and(8)are selected as the reaction equations involved in the simulation.
3.Results and analysis
To facilitate the combination of magnetic field and plasma simulation and to improve the computing efficiency,we use a 2D axisymmetric approach to modeling and take half of the 3D model profile to build the 3D model by rotating around the axis(shown in figure 4).By integrating the governing equations throughout the rotation,the 2D section is sufficient to recover the complete 3D stress and strain states.
The structure schematic of the discharge zone of the solenoid cold-cathode PIS and part of the extraction zone is given in the model.The discharge zone mainly consists of the solenoid,the anode cylinder,the cathode plate,the anticathode plate and the ceramic shell.There is an accelerator plate in the extraction area,which is used to accelerate the ions and then collides with the target to produce the fusion reaction,so that neutrons are obtained.The center of the anticathode plate has a 1 mm radius extraction hole,5 mm distance from the accelerator plate.The accelerator plate radius is 8.5 mm.To accurately study the working characteristics of the ion source,we have defined two intercept lines as the ion-source axial(red) and radial(blue) data sampling points in the discharge area within each of the three sources.As shown in figure 5,the center of the ion source is the intersection of the axial transversal and the radial transversal.
3.1.Magnetic fields
Figure 6 shows the axial comparison of the magnetic field intensity of the three ion sources.It can be seen that the magnetic field of the double magnetic ring ion source is relatively uniform and the magnetic field intensity is the lowest.The magnetic block ion source has the smallest axial magnetic mirror ratio of 0.015.The magnetic field intensity on the axis has a large drop: i.e.the magnetic field in the source is the most nonuniform.The solenoid ion source is different from the previous two ion sources,in which it has the highest magnetic field strength.Due to the field superposition effect at the center of the cavity of 10 mm,the magnetic field intensity reaches the maximum,and the change in the magnetic field at 8-14 mm is relatively smooth.The magnetic field is more uniform as a whole,which is more conducive to the production of dense plasma [22,23].
A radial comparison of the magnetic field strength of the three ion sources is shown in figure 7.Except for the fact that the magnetic block-type ion source exhibits an increase in magnetic field strength near the center of the source,the solenoid type and the double magnetic ring type both have a decrease in magnetic field strength near the center of the source.Despite the large difference in magnetic field strength,all three magnetic field configurations exhibit a relatively uniform distribution along the radial direction.Combined with figures 6 and 7,it can be seen that the solenoidal ion source can meet our demand for uniform magnetic field distribution very well.Its magnetic field adjustable feature also helps us further optimize the ion-source magnetic field [24,25].
To select the optimal magnetic field strength of the ion source,we apply excitation voltages of 0.5 V,1 V,1.5 V,3 Vand 4.5 V to one end of the solenoid; the other end is grounded,and its magnetic field variation is observed.In the simulation we assume a copper solenoid resistivity of 0.0172 Ω m-1,and the overall resistance of the solenoid is about 2.4×10⁻³Ω.A comparison of the axial and radial magnetic field strengths of the solenoidal ion source can be obtained for different excitation voltages(shown in figure 8).
As seen in figure 8(a),with the increase in the excitation voltage,the strongest magnetic field appears at the position of about 10 mm in the axial direction.Due to the superposition of the magnetic field,its value is greater than the rate of increase of the magnetic field strength at both ends of the axial direction.The growth rate of the magnetic field at both ends is about 5.53%-6.17% per voltage.The increase in the magnetic field is proportional to the increase in the excitation voltage,as shown in figure 8(b).The radial magnetic field always maintains a more uniform distribution,and there is a weaker magnetic mirror field along the radial direction within the source as the voltage rises,and its value is always maintained at 0.831.It can be seen from equation(2)that only a very small number of charged particles can perform roundtrip motion in the anode cylinder along the radial direction.From the overall view of figure 8,the magnetic field within the source can maintain good uniformity in all directions between 0.5 V and 1.5 V.With the increase in the solenoid excitation voltage,the intensity of the magnetic field rises within the source,but its uniformity decreases along both ends of the axial direction.
3.2.Plasma fields
Based on the previous paper,we combined the solenoidal magnetic field with the plasma simulation to understand the effect of the magnetic field on the ion-source discharge[14,17,27].The ion-source discharge zone is charged with 0.06 Pa of hydrogen gas.Since the working pressure of the neutron tube is 10-1-10-2Pa[20,25],the simulated pressure conditions can induce ionization successfully.The anode cylinder potential is taken as 2000 V,the cathode plate and the anticathode plate as ground,and the accelerating plate potential as-5000 V.From table 1 the collision reaction,wall reaction and secondary electron emission are considered,while the secondary electron emission coefficient is set toγ=1.2 in the study [26].Taking the excitation voltage of 4.5 V as an example,the electron density distribution and the ion density distribution after reaching stability are shown in figure 9.
As can be seen from figure 9(a),the higher electron density in figure 7 is concentrated near the larger magnetic field value.It is close to the ellipsoidal structure.When the PIS works in the weak ionization state,the maximum value of electron density is 1.39×10¹⁵m-3and the average electron density is 4.63×10¹³m-3.The accelerated electrons ionize the neutral background gas,and the ion density is concentrated near the axis and varies considerably in a small range.To make the discharge area more obvious,we have adjusted the legend by specifying the upper color limit to the density figure(this means the color of the electron density does not change from 5×10¹⁴to 1.4×10¹⁵m-3; the color of thedensity does not change from 1×10⁹to 2.68×10¹⁴m-3;the color of the H+density does not change from 1×10⁷to 3.5×10⁸m-3),and the distributions of H+andin the ion source can be seen in figures 9(b) and(c).Both ions are mainly concentrated near the axis of the ion source,and the density distribution ofis significantly larger than that of H+ions in the discharge chamber.A certain angular distribution can be observed after the accelerator plate extracts them out of the extraction hole.In previous experimental observations of low-pressure PIS discharge,there is a fine bright column with a diameter of about 1 mm near the axis of the discharge chamber,which is surrounded by a relatively uniform and dark more-luminous area.This is one of the basic features of low-pressure discharge and it is consistent with our simulated results [27].
The maximum number density of the theoretically calculated value ofis 4.02×10¹⁴m-3and the average number density is 2.11×10⁸m-3.The maximum number density of H+is 7.77×10¹²m-3and the average number density is 4.02×10⁷m-3.Figure 10 shows the specific distribution of charged particles more clearly,regardless of color limitation.Combined with figure 10 we can see that after the formation of dynamic equilibrium between electrons and ions in the discharge space of the ion source,the electrondensities(as shown in figures 10(a) and(c)) are much larger than the ion density(as shown in figure 10(b))in most regions of the source.Higher ion density in the axis and decreasing density along the radial direction appear in figure 10.Ion density decreases by about an order of magnitude for every 2 mm of passage,which is greater than electron density only in some regions(at 13-17 mm,the axial ion density is higher than the axial electron density,as shown in figure 10(c)).It is worth noting that the electron density is different from the ion density,as shown in figures 10(a) and(c).There is about an order of magnitude decrease in electron density for every 2 mm along the geometric center of the ion source in all directions(figure 10(b)).
Figure 2.The double magnetic ring-type PIS.(a)A 3D model of the ion source,and(b)magnetic induction intensity and magnetic induction line distribution inside and outside the ion source.

Figure 3.The solenoidal PIS.(a)A 3D model of the ion source,and(b)magnetic induction intensity and magnetic induction line distribution when the excitation voltage is 4.5 V.
Figure 4.A 2D axisymmetric model of the ion source(the red dashed line is the axis of symmetry).

Figure 5.The position and length of the intercept line. (a)Magnetic block ion source,(b)double magnetic rings ion source,(c)solenoid ion source.
Figure 6.Comparison of the axial magnetic field intensity of three ion sources at 0.6 T surface magnetic flux.

Figure 7.Comparison of the radial magnetic field strength of the three ion sources at a surface flux of 0.6 T.
Figure 8.Comparison of the axial(a) and radial(b) magnetic field strengths of the energized solenoidal ion source at different excitation voltages.

Figure 9.(a) Electron density distribution,(b) density distribution,and(c) H+ density distribution when the magnetic field excitation voltage is 4.5 V.
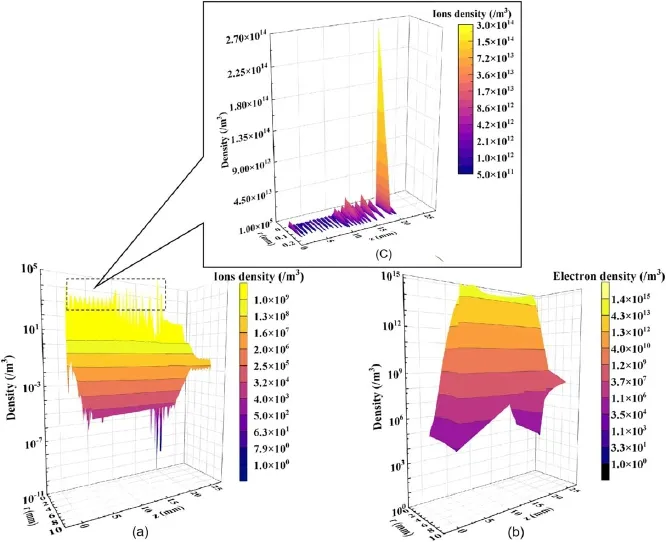
Figure 10.(a) Ion density distribution under 106 m-3,(b) electron density distribution and(c) ion density distribution above 106 m-3.
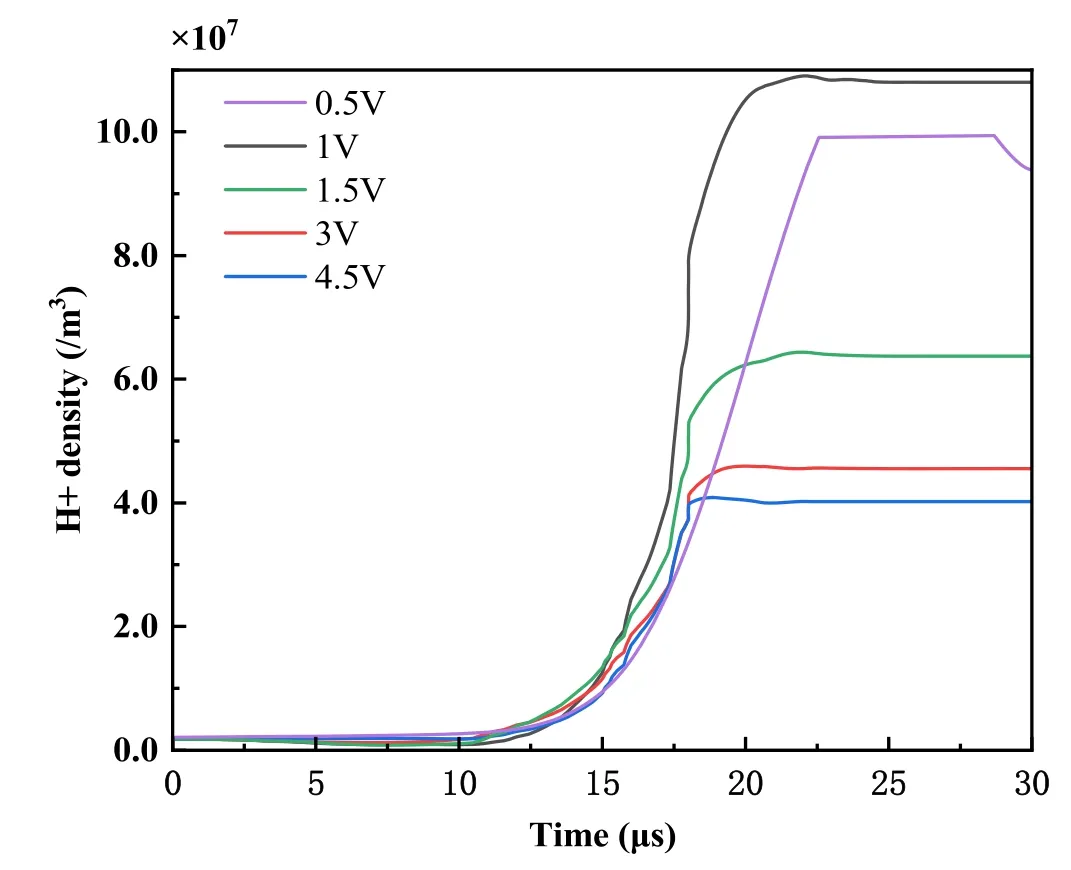
Figure 11.The average number density of H+ ions with time for different solenoid excitation voltages.

Figure 12.Under 1 V energized solenoid excitation voltage:(a)electron density distribution,(b)H2+ion density distribution,and(c)H+ion density distribution after reaching stable discharge.

Figure 13.Number density distributions of H+,and electrons along the section line when the solenoid is under 1 V excitation voltage.(a)The number density distribution of H+along the axial direction,(b)the number density distribution of H+along the radial direction,(c)the number density distribution ofalong the axis,(d)the number density distribution ofalong the radial direction,(e)the number density distribution of electrons along the axial direction,and(f) the number density distribution of electrons along the radial direction.
3.3.Models under different magnetic fields
By varying the excitation voltage to feed the energized solenoid,the electromagnetic field potential pattern and the electromagnetic field strength within the source are changed.This has a critically important effect on the distribution and number density of ions.In a sealed neutron generator,we want to produce as many single-atom hydrogen ions as possible to increase the neutron yield.We selected 0.5 V,1 V,1.5 V,3 V and 4.5 V as the solenoid excitation voltages with the ion source still operating at 0.06 Pa with 2000 V of cathode voltage.The ion source does not start discharging immediately after the start of the simulation.The discharge process starts to build up after about 12μs and reaches stability after about 5-9μs according to the magnetic fieldstrength.As the cold-cathode PIS is a self-sustaining discharge,this means it takes time for a stable discharge to build up.The rising edge of 5-9μs corresponds exactly to this process.After reaching stability the mean number density of H+remains essentially constant,with only slight oscillations in a small range.From figure 11 we can observe that when the excitation voltage is 1 V,H+has a high average number density inside the ion source.The average number density of H+at 0.5 V and 1.5 V is lower than that at 1 V; i.e.as the voltage increases or decreases from 1 V,the average number density of H+is gradually decreasing.

Table 2.The solenoid excitation voltage versus the single-atom ion ratio.
When the magnetic field strength decreases,such as when the excitation voltage gets down from 1 to 0.5 V,the time between the start of the ion-source discharge and the formation of a stable discharge increases from about 7 to nearly 12μs.When the magnetic field strength increases,for example,the excitation voltage increases from 1 to 4.5 V,it can be found that the ion-source discharge can reach a steady state faster,while the average H+number density decreases.This result corresponds to the rising edge time of the ionsource discharge current [28,29].The rising edge time is about7μs at 0.5 V,6μs at 1 V,5μs at 1.5 V,4.5μs at 3 V and4μs at 4.5 V.But the rising edge time is not only related to the magnetic field strength but also related to the anode feeding method and the gas pressure.If the anode is fed with a mixture of constant voltage and pulsed feed[30],the rising edge of the pulsed sealed neutron-tube ion source is expected to be controlled at a magnetic field excitation voltage of 1 V for 6μs or even less.The shorter rising edge is an extremely important operating parameter for pulsed neutron tubes,and this work has important applications in neutron logging [31].In this process,we also calculated the single-atom ion ratio at different magnetic fields.
Considering the limitation of computing power and the fact that not all the reactions were taken into account in the simulation,the calculation results of the single-atom ion ratio with the magnetic field after the discharge reaches stability have some errors with the actual situation.But it is easy to see from them that the single-atom ion ratio tends to increase with the enhancement of the magnetic field and none of them can exceed 16%.The PIS input power can be obtained from equation(7):
where ∂B/∂sis the magnetic induction along the magnetic field lines,E⊥is the electric field perpendicular to the magnetic field lines andVǁis the velocity of the electrons parallel to the magnetic field lines.At a solenoid excitation voltage of 0.5 V,the ion source has the lowest single-atom ion ratio.When the maximum Larmor radius of electrons exceeds the anode barrel radius,some electrons disappear after collision with the anode plate.The remaining electrons can only interact with a small number of neutral particles,which is not enough to provide a large ionization completion.As the excitation voltage rises,the magnetic field strength inside the ion source gradually increases.The magnetic field strength is about 0.02 T at an excitation voltage of 1 V.The electron Larmor radius of approach is close to the ion-source size,when the initial electron ‘use rate’ in the cavity is the highest,which means that the collision with neutral particles is the most adequate.At this point,the ion source has the highest average number density of H+and a high single-atomion ratio.When the excitation voltage exceeds 1 V,the electron Larmor radius is smaller than the ion-source cavity size and the number of secondary electrons produced by collisions decreases.At the same time,the larger the magnetic field strength is,the more the input power of the ion source decreases and the narrower the distribution of high-density electrons within the source becomes(from the distribution shown in figure 12(a) to the distribution in figure 9(a)).The neutral background gas being ionized was decreased,H+andnumber densities were decreased(figures 12(c) and(d)compared with figures 9(c) and(d)),and their monatomic ions,such as those in table 2,rise with increasing magnetic field strength.
Taking 1 V as the solenoid excitation voltage,its ion and electron density distribution in the axial and radial direction are shown in figure 13.It can be observed that H+andH2+have a smaller second peak and the largest first peak at 10 mm and 15 mm,respectively.The first density peak of both ions can be observed to be closer to the area where the extraction hole is located due to the influence of the extraction area.We suspect that this is the reason for the two peaks,which is a phenomenon that we will investigate in future experiments.The second peak of both ions can correspond to the region of maximum electron density in figure 13(e).This region is the main region of the plasma discharge,which is influenced by the electrons.The ionization completion in this region is high,and the local single-atom ion ratio can reach more than 20%.In the region where the first peak is located,H+density can reach 1×10¹²m-3anddensity can reach 1×10¹³m-3.The magnitude of ion density in this region is closely related to the magnitude of the extraction field.The variations of electron and ion density distributions in the axial and radial directions with respect to distance prove their inhomogeneity in the discharge space.The variation of the electron energy also leads to the variation of the local ionization rate,which in turn leads to the inhomogeneous distributions of electrons and ions.In comprehensive consideration,1 V has a high monatomic ion ratio and a high H+ion yield;therefore,it is ideal to use 1 V as the excitation voltage of the solenoid ion source.
3.4.Extraction system
We have also investigated the ion current on the accelerating plate for the-5000 V extraction area applied.As shown in figure 14,the ion beam is led out of the extraction hole towards the accelerator plate.Figure 14(a) shows the trajectory envelope surface of the ions being led out of the ion source.Figure 14(b)shows the top view of the accelerating plate after the ions reach the plate,and the ions that hit the accelerating plate are overwhelmingly distributed at the center of the circle.The maximum ion-beam density is about 9.8μA mm-2and the maximum ion flux is about 2.2×10⁻¹⁰kg m-2·s-1;specifically,about 1×10¹²ions per second are accelerated and hit the target system.Figure 14(c) shows the correspondence between the ion trajectory and the ion-beam density of the ions arriving at the accelerator plate.
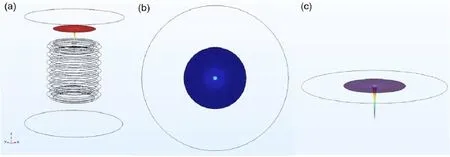
Figure 14.The relationship of ions extracted out of the ion source and reaching the accelerating plate. (a)3D view of acceleration plate and ion source.(b) Top view of acceleration plate.(c) 3D view of acceleration plate and ion current.
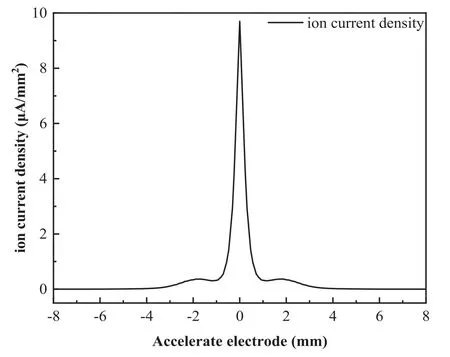
Figure 15.The distribution of ion-beam density along the radius on the accelerating plate.
The distribution of ion-beam density along the radius on the accelerating plate for a magnetic field at an excitation voltage of 1 V is shown in figure 15.The radius of the accelerator plate is 8 mm and the ion beam is mainly distributed between-4 mm and 4 mm,where the ion-beam density is the highest between-1 mm and 1 mm,and the radius of the ion-source excitation hole is 1 mm.This indicates that the ion beam is mainly distributed inside the table cone with an upper bottom radius of 1 mm,a lower bottom radius of 4 mm and a height of 5 mm(shown in figure 14(c)).The angular dispersion of the beam emission is about 540 mrad.By integrating the ion-beam density,the total ion beam extracted by the accelerating plate is about 14.51μA.The total ion-beam current is related to the anode voltage,air pressure,excitation zone length and excitation voltage [32].The relevant parameters of this part are closely related to theneutron-tube excitation system,which is one of the important links in determining the neutron yield.
4.Conclusion
A low-pressure PIS with a solenoid enclosed electromagnet was designed to study the supply of deuterium tritium ions to a sealed neutron tube.The ion source achieves the more uniform magnetic field distribution.Compared with the ion sources with the single magnetic block and the double magnetic ring,the magnetic field configuration of the electromagnet is uniform and adjustable.Simulation of the ionsource discharge was carried out using hydrogen instead of deuterium and tritium.It was found that an excitation voltage of 1 V was optimal to obtain a higher single-atom ion ratio and higher H+yield.As the magnetic field strength increases,the ion source has a rising edge of 7μs,and the rising edge time can be further reduced with continued optimization,which is beneficial to neutron-tube applications,such as pulsed neutron logging.A 14.51μA total ion beam can be extracted from the system and the beam tensor angle can be calculated,which are important parameters for analysis of the neutron-tube extraction system.
Acknowledgment
This work was supported by the China Jilin Province Science and Technology Development Project(No.20190303101SF),and the Sichuan Provincial Higher Education Key Laboratory Criminal Investigation Project-Criminal Science and Technology Laboratory(Sichuan Police College)(No.2018YB04).We would like to thank Shanghai Jiao Tong University and the China Institute of Atomic Energy for their strong support.
ORCID iDs
猜你喜欢
杂志排行

Plasma Science and Technology的其它文章
- Plasma-activated hydrogel: fabrication,functionalization,and effective biological model
- Propagation of surface magnetoplasmon polaritons in a symmetric waveguide with two-dimensional electron gas
- Investigation of electron cyclotron wave absorption and current drive in CFETR hybrid scenario plasmas
- Inversion techniques to obtain local rotation velocity and ion temperature profiles for the x-ray crystal spectrometer on EAST
- Impact of resonant magnetic perturbation on blob motion and structure using a gas puff imaging diagnostic on the HL-2A tokamak
- Comparison of methods for turbulence Doppler frequency shift calculation in Doppler reflectometer