Effect of Strain Ratio on Fatigue Model of Ultra-fine Grained Pure Titanium
2023-10-07QIANGMengYANGXirongLIUXiaoyanLUOLei
QIANG Meng,YANG Xirong,LIU Xiaoyan,LUO Lei
(Wuhan Institute of Marine Electric Propulsion, Wuhan 430064, China)
Abstract: The ultra-fine grained (UFG) pure titanium was prepared by equal channel angular pressing(ECAP) and rotary swaging (RS).The strain controlled low cycle fatigue (LCF) test was carried out at room temperature.The fatigue life prediction model and mean stress relaxation model under asymmetrical stress load were discussed.The results show that the strain ratio has a significant effect on the low cycle fatigue performance of the UFG pure titanium,and the traditional Manson-coffin model can not accurately predict the fatigue life under asymmetric stress load.Therefore,the SWT mean stress correction model and three-parameter power curve model are proposed,and the test results are verified.The final research shows that the threeparameter power surface model has better representation.By studying the mean stress relaxation phenomenon under the condition of R≠-1,it is revealed that the stress ratio and the strain amplitude are the factors that significantly affect the mean stress relaxation rate,and the mean stress relaxation model with the two variables is calculated to describe the mean stress relaxation phenomenon of the UFG pure titanium under different strain ratios.The fracture morphology of the samples was observed by SEM,and it was concluded that the final fracture zone of the fatigue fracture of the UFG pure titanium was a mixture of ductile fracture and quasi cleavage fracture.The toughness of the material increases with the increase of strain ratio at the same strain amplitude.
Key words: ultra-fine grained pure titanium;low cycle fatigue;life model;mean stress relaxation mode;strain ratio;fracture morphology
1 Introduction
Commercial pure titanium has excellent properties such as corrosion resistance,high and low temperature resistance,non-magnetic and non-toxic.It is widely used in petrochemical,power,energy and medical fields[1-3].On the other hand,coarse-grained titanium suffers from relatively low strength and poor cold workability compared with other widely used metals such as iron and copper.Fine grain strengthening is a strengthening method which can improve the strength and toughness of metals without reducing plasticity[4].The research shows that the fatigue properties,impact properties,corrosion resistance and processing plasticity of pure titanium can be significantly improved by grain refinement[5,6].The ECAP process can make the material undergo severe plastic deformation(SPD) without changing the cross-section area,so that break the grains and obtain UFG metal materials[7].At present,ECAP has been successfully applied to aluminum and aluminum alloy[8,9],magnesium and magnesium alloy[10,11],titanium and titanium alloy[12-14]and other metal materials.
According to statistics,the annual loss caused by fracture of metal structural materials reaches 119.5 billion,of which fatigue fracture accounts for 95%[15].As a structural material,pure titanium mostly works under high stress,and low cycle fatigue is one of the main failure reasons.Therefore,it is of great practical significance to predict the low cycle fatigue life of pure titanium.Traditional low cycle fatigue life model,such as the Manson-Coffin model,can only predict the fatigue life under symmetrical cycle.However,in practical application,many structural parts are under asymmetric circulation for a long time,which will produce mean stress and mean strain.There are also many research results on the prediction model of fatigue life under asymmetric cycle[16,17],while the current research on the fatigue behavior of ultrafine grained pure titanium is mainly limited to the symmetrical cycle[18].In order to expand the application range of UFG pure titanium,it is of great significance to explore the effect of mean stress on the low cycle fatigue behavior of UFG pure titanium.Meanwhile,the phenomenon of mean stress relaxation has been widely concerned in fatigue resistance[19].Ignoring the effect of mean stress will reduce the accuracy of the prediction on low cycle fatigue life.Generally,the mean tensile stress reduces the fatigue life of materials,while the mean compressive stress increases the fatigue life.
The mean stress relaxation model of the UFG pure titanium is studied.The Landgraf model was used to describe the mean stress relaxation phenomenon under different strain ratios,and the relevant factors of the mean stress relaxation rate are obtained.The mean stress modified SWT model and the mean strain modified three-parameter power surface model are used to verify the research,and compared with the traditional Manson coffin model.Finally,the optimal low cycle fatigue life prediction model of the UFG pure titanium was obtained.
2 Experimental
The as-received material was a hot-rolled bar of commercially pure titanium (grade 1) having an average equiaxed grain size of about 23 μm as shown in Fig.1.After pretreatment and lubrication,the initial cylindrical samples (of the diameter of 25 mm) were deformed by 2 passes of the ECAP process using YJ160B1 four-column hydraulic press at room temperature.The internal channel angle was 135°,and the ram speed was 2.5 mm/s.It requires the sample rotation of 180° around its longitudinal axis between adjacent passes.After ECAP,the samples were rotary swaged into a cylindrical sample to obtain the UFG pure titanium having a grain size of submicron.2 passes of the ECAP process gives an equivalent strain of about 0.93,the rotary swaging gives about 1.39,and the total equivalent strain is about 2.42.

Fig.1 The microstructure of as-received coarse-grained pure titanium
Prior to the fatigue tests,mechanical properties of the UFG pure titanium were firstly characterized by the uniaxial tensile tests usingMTS tensile testing machine at room temperature,with the strain rate of 10-3s-1.The tensile mechanical properties of the obtained UFG pure titanium can be seen in Table 1.Then,fatigue tests were conducted on the Instron 1341 electro-hydraulic servo fatigue testing machine with the triangular waveform at a constant strain rate of 0.01 s-1in the air at room temperature.The fatigue load is loaded in a uniaxially symmetric cycle.The strain frequencyfis 0.20-0.625 Hz,the total strain amplitude is 0.4%-1.2%,and the strain ratio is -1 (symmetrical cycle),-0.5 (tension-compression cycle) and 0.5(tension-tension cycle),respectively.The maximum tensile force of the testing machine was 100 kN.Fatigue test samples of the UFG pure titanium were prepared according to standard GB/T 15248-2008.The diameter of the working section was 5 mm,the total length of the samples was 73 mm,and the length of the extensometer used in the test was 12.5 mm.
Microstructure of the UFG pure titanium of longitudinal section were observed using JEM-200CX transmission electron microscope (TEM).In order to determine the type of fatigue fracture and the fracture mechanism of the UFG pure titanium,the fatigue fracture was observed by scanning electron microscope(SEM) after fatigue tests.
3 Results and discussion
3.1 Microstructure of the UFG pure titanium
TEM images of the UFG pure titanium are shown in Fig.2.It can be seen that the grain size of the UFG pure titanium has been significantly refined and a large number of sub-grains have been formed(indicated by the arrow) after the ECAP+RS process.The grain size has reached the nanometer level,and the average grain size is about 150 nm.The selected area diffraction (SAD) pattern inserted in Fig.2(a) are from discontinuous diffraction rings to continuous diffraction rings,indicating that the grains have been refined into small sub-grains.

Fig.2 TEM images of the UFG pure titanium
Fig.2(b) shows that the microstructure was covered by high densities of dislocations,and no deformation twins were found,indicating that the dominant deformation mechanism of the UFG pure titanium is dislocation slips.Deformation twinning is highly sensitive to grain size that with decreasing the grain size down to 1 μm,the stress required for deformation twinning increased drastically,and the deformation twinning was entirely replaced by dislocation twinning,which was consistent with the previous report by Yu Q[20].As the dislocation density increases due to severe plastic deformation,dislocation lines entangle to form dislocation cells,which gradually accumulate the dislocation density and form sub-grains as shown in Fig.2(c).In the non-uniform part of the grain,there are some band structures.As shown in Fig.2(d),there are a large number of dislocation cells in the band.Because of the severe plastic deformation,dislocation lines appear inside the band structure,and dislocation cells gradually move to form dislocation cells,which break the boundary of the large band structure and refine the grain gradually.
3.2 Calculation of cyclic elastic modulus
Generally,the elastic modulus of the material at room temperature can be measured by static tensile test.However,when the data is processed by isothermal low-cycle fatigue test,the elastoplastic strain amplitude calculated by static elastic modulus has a certain influence on the calculation result.Zhanget al[21]have studied the influence of elastic modulus on low cycle fatigue test parameters.Their results suggested that when the cycle life is more than 5 000,the elastic modulus has a great influence on the prediction accuracy of low cycle fatigue life.Therefore,in this study,the cyclic modulus of elasticity is used to calculate the low cycle fatigue life of materials.The equation for calculating the cyclic modulus of elasticity is as follows,
whereE*is the cyclic modulus of elasticity,ENTis the tensile unloading modulus of elasticity,ENCis the compression unloading modulus of elasticity.Table 2 shows the calculation results of cyclic modulus of elasticity of the UFG pure titanium.

Table 2 Cyclic modulus of elasticity of the UFG pure titanium
3.3 Masing behavior
The Masing behavior[22]refers to making halflife hysteresis loops corresponding to different strain amplitudes during cyclic deformation of materials,moving their lowest points to the origin of coordinate axis,and the hysteresis loops in the upper half can be roughly coincident.The main reason for this curve characteristic is that the material has the same proportional limit under the cyclic loading with different strain amplitudes.It can be seen from Fig.3 that the upper half of the hysteresis loop of the UFG pure titanium does not coincide under different strain ratios,so the UFG pure titanium belongs to Non-Masing material.Its physical meaning is that the elastic part of the cyclic stress-strain curve of the material changes with the change of strain amplitude,that is,the yield stress of the material changes under cyclic loading.

Fig.3 Masing behavior under different strain ratios of the UFG pure titanium
3.4 Establishment of fatigue life model
The Manson-Coffin equation is usually used to predict low cycle fatigue life.For the fatigue life curve under total strain amplitude,Manson-Coffin equation can be used to describe,
By fitting the elastic section and the plastic section,the fatigue strength coefficient σf′,the fatigue ductility coefficient εf′,the fatigue strength indexband the fatigue ductility indexcare obtained.The data under asymmetric strain is fitted and compared with the fitting result ofR=-1 (symmetric strain),and the results are shown in Table 3.

Table 3 Manson-Coffin fitting results at different strain ratios
Taking the fitting results into Manson-Coffin equation,the life prediction model of the UFG pure titanium is obtained as follows:
It can be seen from Fig.4 and Table 3 that the strain ratio has a great influence on the coefficient of the Manson-Coffin equation,and the fitting results all reach a confidence level of more than 95%,so the mean strain has a significant influence on the material fatigue parameters.The strain amplitudes of different tests are substituted into Eq.(3),and the fatigue life prediction value of the UFG pure titanium is calculated by the Newton iteration method in MATLAB.The results are shown in Fig.6.It can be seen from Fig.6 that under low strain amplitude,the predicted results of the UFG pure titanium deviate greatly from the test results.Therefore,the Manson-Coffin equation lacks accuracy for fatigue life prediction at different strain ratios.
In order to consider the effect of strain ratio on the fatigue life of materials,based on the Manson-Coffin life prediction model,Smith,Watson and Topper proposed the SWT mean stress correction model in 1970[23],which can be expressed as
whereσmaxis the maximum stress,other parameters refer to the Manson-Coffin equation fitting result.The specific expression of the fit is
The comparison between the predicted and experimental values of the SWT mean stress correction equation is shown in Fig.6.Compared to the Manson-Coffin equation,the SWT mean stress correction equation has a small error at strain amplitude of 0.4%.However,when the strain amplitude is 0.6%,the prediction result has a large error.
Zhanget al[24]found that the life prediction ability of the three-parameter power function equation is greatly improved compared with the Manson-Coffin equation.In order to improve the accuracy of predicting the low-cycle fatigue life model of the UFG pure titanium,a three-parameter power function model is selected,its lifetime expression is
whereεis the strain amplitude,ε0is the strain amplitude when the life is near infinity,mandCare the coefficients,and the equation is transformed into
The experimental data was fitted by the ORIGIN software to obtain the parametersε0,B,andαin Eq.(7),as shown in Table 4.
In order to consider the effect of strain ratio on low cycle fatigue life,the mean strainεmis introduced to correct the three-parameter power model:
where εf′ is the fatigue ductility coefficient fitted by the Manson-Coffin model,m=1/α,C=(ε0B)1/α.Put in the value corresponding to the strain ratioR=-1.The three-parameters power surface model with strain amplitudeεand mean strainεmas independent variables can be obtained:
The three-parameter power surface model and the test data points are plotted in Fig.5.The fatigue life point measured by the test shown in Fig.6 falls on the model surface,and the prediction result is excellent.
In order to compare the accuracy of the three life models more intuitively,the test data and prediction data are drawn into one diagram for comparison.Fig.6 is a comparison of the prediction and test life of the three models.It can be seen from Fig.6 that the predicted life of the Manson-coffin model is larger than the test life under the symmetric cycle,and the predicted life of the SWT model is smaller than the test life,while the three-parameter power surface model is almost identical.Under the asymmetric cycle,the predicted life of the three-parameter power surface model is mostly consistent with experimental life.While the SWT model has better prediction accuracy when the strain amplitude is 0.4%,the prediction error is larger under other strain amplitudes.Manson-coffin does not consider the mean strain and the mean stress,so the prediction error is the biggest.Therefore,the prediction result of the three-parameter power surface model is better.
3.5 Mean stress relaxation model
Fig.7 shows hysteresis curves of 2,20,0.5NfandNfcycles under asymmetric cyclic strain ratio with strain amplitude of 0.9%.Fig.7(b) and (d) are obtained by enlarging Fig.7(a) and (c) locally.As can be seen from the figure,the hysteresis curves of the second cycle are not closed under the asymmetric cycle.The hysteresis loop is not closed,which results in the mean stress relaxation in the material.Under asymmetric stress loading,the unclosed hysteresis loop leads to the ratcheting effect[25,26].It can be seen from the graph that the ratcheting effect is more obvious with the increase of strain ratio.When the material is subjected to tensile compression,the force is greater than the yield strength of the material,resulting in plastic deformation of the material.The external force is unloaded and reverse loaded,and the material is first recovered along the elastic line and then reversely deformed.If the reverse loaded load is less than the initial loaded load,the reverse deformation of the material will be smaller than the initial deformation,resulting in residual strain.The ratcheting effect is that the material will produce a plastic deformation cycle accumulation under asymmetric stress cyclic loading.With the increase of cycle number,the hysteresis loop closes gradually and moves downward.These characteristics are also found under other strain amplitudes.Because the mean stress relaxation of the UFG pure titanium occurs,we discuss it in depth below.

Fig.7 The hysteresis loop under different cycle time
Fig.8 is a mean stress life curve.It can be seen from the figure that under the control of asymmetric strain,the material has an obvious mean stress relaxation phenomenon.When the strain ratio is 0.5 and the strain amplitude is less than 0.6%,the mean stress is larger and does not relax to 0;when the strain amplitude is 0.9%-1.2%,the mean stress quickly decreases to 0.When the strain ratio is -0.5 and the strain amplitude is less than 0.6%,the mean stress relaxation does not occur in the material;when the strain amplitude is 0.9%-1.2%,the larger the strain amplitude is,the smaller the initial mean stress is.
The UFG pure titanium has a mean stress relaxation phenomenon under asymmetric cycle,but the mean stress relaxation phenomenon does not occur when the strain ratio is -0.5 and the strain amplitude is less than 0.6%.Therefore,the following discussion removes the case where the strain ratio is -0.5 and the strain amplitude is less than 0.6%.Define the mean stress relaxation ratio—the mean stress atNcycles divided by the initial mean stress:σmn/σmi.Fig.9 depicts the relationship between fatigue life and mean stress relaxation ratio.As can be seen from Fig.7,in the double logarithmic coordinates,XYhas a linear relationship,and the slope represents the mean stress relaxation rate.The smaller the strain amplitude is,the slower the mean stress relaxation rate is,and the less obvious the mean stress relaxation phenomenon is.Under the same strain amplitude,the mean stress relaxation rate ofR=0.5 is faster than that of strain -0.5.Therefore,it can be concluded that the mean stress relaxation rate depends on the strain ratio and strain amplitude,and increases with the increase of strain amplitude and strain ratio.
The Landgraf model[27]was proposed in 1988.The model is simple and reliable and has been widely used in recent years.Therefore,the Landgraf model is used to describe the mean stress relaxation phenomenon of the UFG pure titanium.The Landgraf model expression is
whereris the mean stress relaxation index andCandAare parameters.The experimental data was fitted to obtainrvalues as shown in Table 5.Fig.10 shows the fitting results of the stress relaxation indexrin double logarithmic coordinates.

Table 5 Results of fitting the stress relaxation index r

Fig.10 Life and mean stress ratio fit diagram
Fig.11 is a graph showing the change of the mean stress relaxation index with strain amplitude.It can be seen from the graph that the two are linear,so theCandAvalues can be obtained by fitting.The fitting results are shown in Table 6.
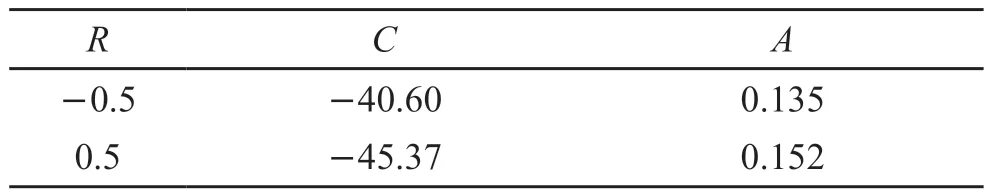
Table 6 Stress relaxation index correlation coefficient fitting results

Fig.11 Results of strain amplitude and stress relaxation index fitting
The mean stress relaxation model under different strain ratio can be obtained by
It can be seen from previous discussion that the mean stress relaxation of the UFG pure titanium is not only related to the strain amplitude,but also to the strain ratio.Therefore,it is assumed that the expression of the relaxation index,the strain amplitude and the strain ratio is
The binary linear regression is performed on the strain ratioR,the mean stress relaxation indexrand the strain amplitudeεin Table 8.The result isD=-44.88,E=-0.031,F=0.164,and the result is brought to the Eq.(14).The Landgraf model for strain ratio and strain amplitude is obtained
Eq.(15) is an improved stress relaxation model with strain ratio and strain amplitude as independent variables,which are used to describe the mean stress relaxation at different strain ratios and different strain amplitudes.The stress relaxation indexrhas a linear relationship with the strain amplitude strain ratio.The relaxation indexrrepresents the mean stress relaxation rate and the smaller thervalue,the faster the mean stress relaxation rate.Eq.(15),the strain amplitude is negatively correlated with the stress relaxation index,and the strain ratio is also negatively correlated.Therefore,the mean stress relaxation rate is faster with the increase of strain ratio and strain amplitude,which is consistent with the test results.
3.6 Fracture morphology observation
Fig.12 is the macro fracture morphology of LCF under different strain amplitudes andR.Fatigue fracture can be generally divided into three zones: fatigue crack origin zone,crack propagation zone and final fracture zone.As can be seen from Fig.12,the three zones of the UFG pure titanium are clearly demarcated.In the crack propagation zone,the parallel fatigue striations can be seen to diffuse around the crack source.Under the same strain ratio,the strain amplitude is inversely proportional to the area of the fatigue crack origin zone;under the same strain amplitude,the strain ratio is inversely proportional to the area of the fatigue crack origin zone.It can be found that the larger the stress level is,the smaller the area of the fatigue crack source area is.

Fig.12 Six representative low-cycle fatigue failure surfaces under different strain amplitudes with different strain ratios
Fig.13 is the fatigue crack origin zone.It can be seen that fatigue cracks originate on the surface of specimens and gradually expand inward.Because there are some defects on the surface of the specimen,the local shear stress makes the dislocation on the surface of the material move into a slip zone.Under the action of alternating stress,the adjacent slip surface cause reverse slip and the fatigue slip zone form grooves and ridges on the surface,which eventually become the area where the fatigue crack initiation occurs.Secondary cracks are found in the fatigue growth zone of Fig.13(b),which are perpendicular to the main crack propagation direction.Laird[28]found that passivation is the most widely used model to explain the mechanism of fatigue crack growth.Under the action of tensile stress,the crack propagates forward,which is called tip sharpening.Under the action of compressive stress,the stress at the crack tip gradually decreases,the crack gradually closes,and the crack tip becomes passivated.Under cyclic loading,the crack tip undergoes sharpening and passivation.Therefore,after each sharpening and passivation,the crack tip has expanded a certain distance compared with previous period.

Fig.13 Initiation and propagation of low-cycle fatigue cracks
Fig.14(a) shows that when the strain amplitude ofR=-1 is 0.6% under symmetrical loading,there are a large number of dimples,holes,fluvial patterns and tearing edges in the fatigue final fracture zone.Therefore,the fatigue fracture of the UFG pure titanium is a mixture of ductile fracture and quasicleavage fracture.Compared with a strain amplitude of 0.6%,dimples become larger and deeper when theR=-1 strain amplitude is 1.2%.The main fracture mode is ductile fracture (Fig.14(b)).At the same strain amplitude,the dimples become larger and deeper with the increase of strain ratio.It can be seen that the toughness of the material increases with the increase of strain ratio.

Fig.14 Final fracture zone of LCF fracture
4 Conclusions
The UFG pure titanium belongs to Non-Masing material.The cyclic elastic modulus of the UFG pure titanium has a large difference from the static tensile modulus.In order to make the calculation result more accurate,the cyclic elastic modulus should be used to calculate the life model.
The strain ratio has a great influence on the Manson-coffin fitting result.The accuracy of the SWT mean stress correction model is higher than that of the Manson-coffin model.The three-parameter power model has the most accurate prediction result after the mean strain correction.
The mean stress relaxation phenomenon of the UFG pure titanium was described by Landgraf model.The mean stress relaxation model under different strain ratios was calculated.The mean stress relaxation model of strain ratio and strain amplitude was obtained by binary linear fitting.
Conflict of interest
All authors declare that there are no competing interests.
杂志排行

Journal of Wuhan University of Technology(Materials Science Edition)的其它文章
- Core-shell-embedded Mesoporous Silica Capsules for Atmospheric Water Harvesting
- Preparation of B2O3-ZnO-SiO2 Glass and Sintering Densification of Copper Terminal Electrode Applied in Multilayer Ceramic Capacitors
- Structural Characterization of Carbon-implanted GaSb
- Development of Eggshell Waste Incorporated with a Porous Host as a Humidity Adsorption Material
- Low Temperature Heat Capacity of Zn Substituted Cobalt Ferrite Nanosphere: The Relation between Magnetic Properties and Microstructure
- The Enhanced Electrons and Holes Separation for Bi2MoO6/TiO2 Z-scheme Heterojunction by Ag Loading