Predicting and delineating soil temperature regimes of China using pedotransfer function
2023-09-16BAOWankuiLElQiuliangJlANGZhuodongSUNFujunZHANGTianpengHUNingWANGQiubing
BAO Wan-kui ,LEl Qiu-liang,JlANG Zhuo-dong,SUN Fu-junZHANG Tian-peng,HU Ning,WANG Qiu-bing
1 College of Land and Environment,Shenyang Agricultural University,Shenyang 110866,P.R.China
2 Institute of Agricultural Resources and Regional Planning,Chinese Academy of Agricultural Sciences,Beijing 10081,P.R.China
3 School of Food and Biological Engineering,Hezhou University,Hezhou 542899,P.R.China
Abstract
Soil temperature regime (STR) is important for soil classification and land use.Generally,STR is delineated by estimating the mean annual soil temperature at a depth of 50 cm (MAST50) according to the Chinese Soil Taxonomy (CST).However,delineating the STR of China remains a challenge due to the difficulties in accurately estimating MAST50.The objectives of this study were to explore environmental factors that influence the spatial variation of MAST50 and generate an STR map for China.Soil temperature measurements at 40 and 80 cm depth were collected from 386 National Meteorological Stations in China during 1971–2000.The MAST50 was calculated as the average mean annual soil temperature (MAST) from 1971–2000 between 40 and 80 cm depths.In addition,2 048 mean annual air temperature (MAAT) measurements from 1971 to 2000 were collected from the National Meteorological Stations across China.A zonal pedotransfer function (PTF) was developed based on the ensemble linear regression kriging model to predict the MAST50 in three topographic steps of China.The results showed that MAAT was the most important variable related to the variation of MAST50.The zonal PTF was evaluated with a 10% validation dataset with a mean absolute error (MAE) of 0.66°C and root mean square error (RMSE) of 0.78°C,which were smaller than the unified model with MAE of 0.83°C and RMSE of 0.96°C,respectively.This study demonstrated that the zonal PTF helped improve the accuracy of the predicted MAST50 map.Based on the prediction results,an STR map across China was generated to provide a consistent scientific base for the improvement and application of CST and land use support.
Keywords: soil temperature,soil temperature regimes,soil taxonomy,pedotransfer function
1.lntroduction
Daily and seasonal variation of soil temperature directly affects the heat flux in soils and can influence soil physical,chemical,and biological properties and processes,i.e.,soil water availability,nutrient transformation,and plant growth (Baietal.2014; SSS 2022).The distribution of natural plant species and communities is also influenced by the soil temperature and is often used to infer soil temperature regime (STR) (Smith 1986).Therefore,accurately measuring and spatially quantifying soil temperature distribution is important for ecosystem services,soil use and management,and soil classification (Husnjaketal.2014).The importance of soil temperature has been widely acknowledged in many previous studies and soil classification systems (D’Avelloetal.2021; SSS 2022).Specifically,the mean annual soil temperature (MAST) at a depth of the upper boundary of the root limiting layer or 50 cm from the surface (MAST50) is used to define STR in the US Soil Taxonomy (ST),Chinese Soil Taxonomy (CST),World Reference Base for Soil Resources (WRB),and Russian Soil Classification System (RSCS) (Spaargaren and Deckers 1998; Shishovetal.2001; Gongetal.2007; SSS 2022).
While MAST50 is important for developing soil classification systems,it is still rarely measured and collected worldwide (D’Avelloetal.2021; SSS 2022).Generally,MAST is measured using a thermometer at a specific depth in the soil and calculated by averaging the daily measurements.However,only a few meteorological stations have a short period of MAST50 data which makes it difficult to generate a continuous soil temperature map and predict their responses to climate change (D’Avelloetal.2021).Therefore,several methods have been proposed to predict MAST50 using mean annual air temperature (MAAT) (Smithetal.1964),soil temperature at other depths (Horton and Wierenga 1983; Gongetal.2007),latitudes,and other related environmental factors (Carter and Ciolkosz 1980).Smithetal.(1964) suggested adding 1°C to MAAT for predicting MAST50 in the US.D’Avelloetal.(2021) predicted the changes in mesic-thermic STR boundary from the 1900s to 2010s using MAAT data.Zhangetal.(2022) proposed a linear regression model to predict the soil temperature fluctuation in Australia from the air temperature and the ordinary kriging method for mapping STR.
China is a large country with dramatic geography and climate diversity.On a national scale,the landforms and topography of China can be viewed as a three steps stairway from east to west.The climate,topography,vegetation types,and soil temperature present great variations among these three landform steps.Therefore,the regional-scaled MAST prediction model cannot be extrapolated for estimating MAST at the national scale.For instance,the MAST50 prediction model proposed by Hanetal.(2017) can achieve higher accuracy in estimating MAST50 for soils from eastern China than Qinghai–Tibet Plateau and Inner Mongolia Plateau.Predicting MAST50 consistently across the entire area is important for delineating STR and improving decisions for soil and plant management responses to climate change.A zonal ensemble linear model for predicting MAST50 and their corresponding STR map of China is needed.
The development of digital soil mapping (DSM) technique provides an opportunity to predict MAST50 and its spatial variation at the national scale.With the support of a geostatistical framework and machine learning model,DSM techniques have been widely adopted for developing continuous soil property maps and soil type maps at multiple scales with limited samples based on soil formation models proposed by Jenny (1941) and McBratneyetal.(2003) (Liuetal.2020; Songetal.2020).For example,theGlobalSoilMapproject was designed and developed to provide a global grid of soil properties using a combination of remote sensing,machine learning,and DSM techniques (Arrouaysetal.2014).Liuetal.(2022) developed high-resolution soil property maps for China using DSM and machine learning techniques.Jiangetal.(2021) predicted the occurrence of Fe–Mn concentrations in upland soils based on DSM techniques and pedological knowledge.
The main objectives of this study were to predict the soil temperature at a depth of 50 cm across China and generate a national-scale soil temperature regime map based on PTF and DSM techniques.Specific objectives were to: (i) predict the MAST50 for China using a zonal PTF,(ii) analyze the spatial variation of MAST50 at a national scale,and (iii) generate an STR map of China based on Chinese Soil Taxonomy.It was hypothesized that the MAST50 could be predicted by the MAAT using a zonal PTF at a national scale under complex geomorphology and environmental conditions.
2.Materials and methods
2.1.Study area
The study area (i.e.,China) covers over 9.6 million km2,consisting of three topographic steps from east to west (Fig.1).The elevation ranges from –154 to 8 848 m a.s.l.The mean annual air temperature ranges from –5.6 to 26.5°C,while the mean annual precipitation ranges from 5.9 to 6 557.8 mm (China Meteorological Data Service Centre (CMDSC),http://data.cma.cn).
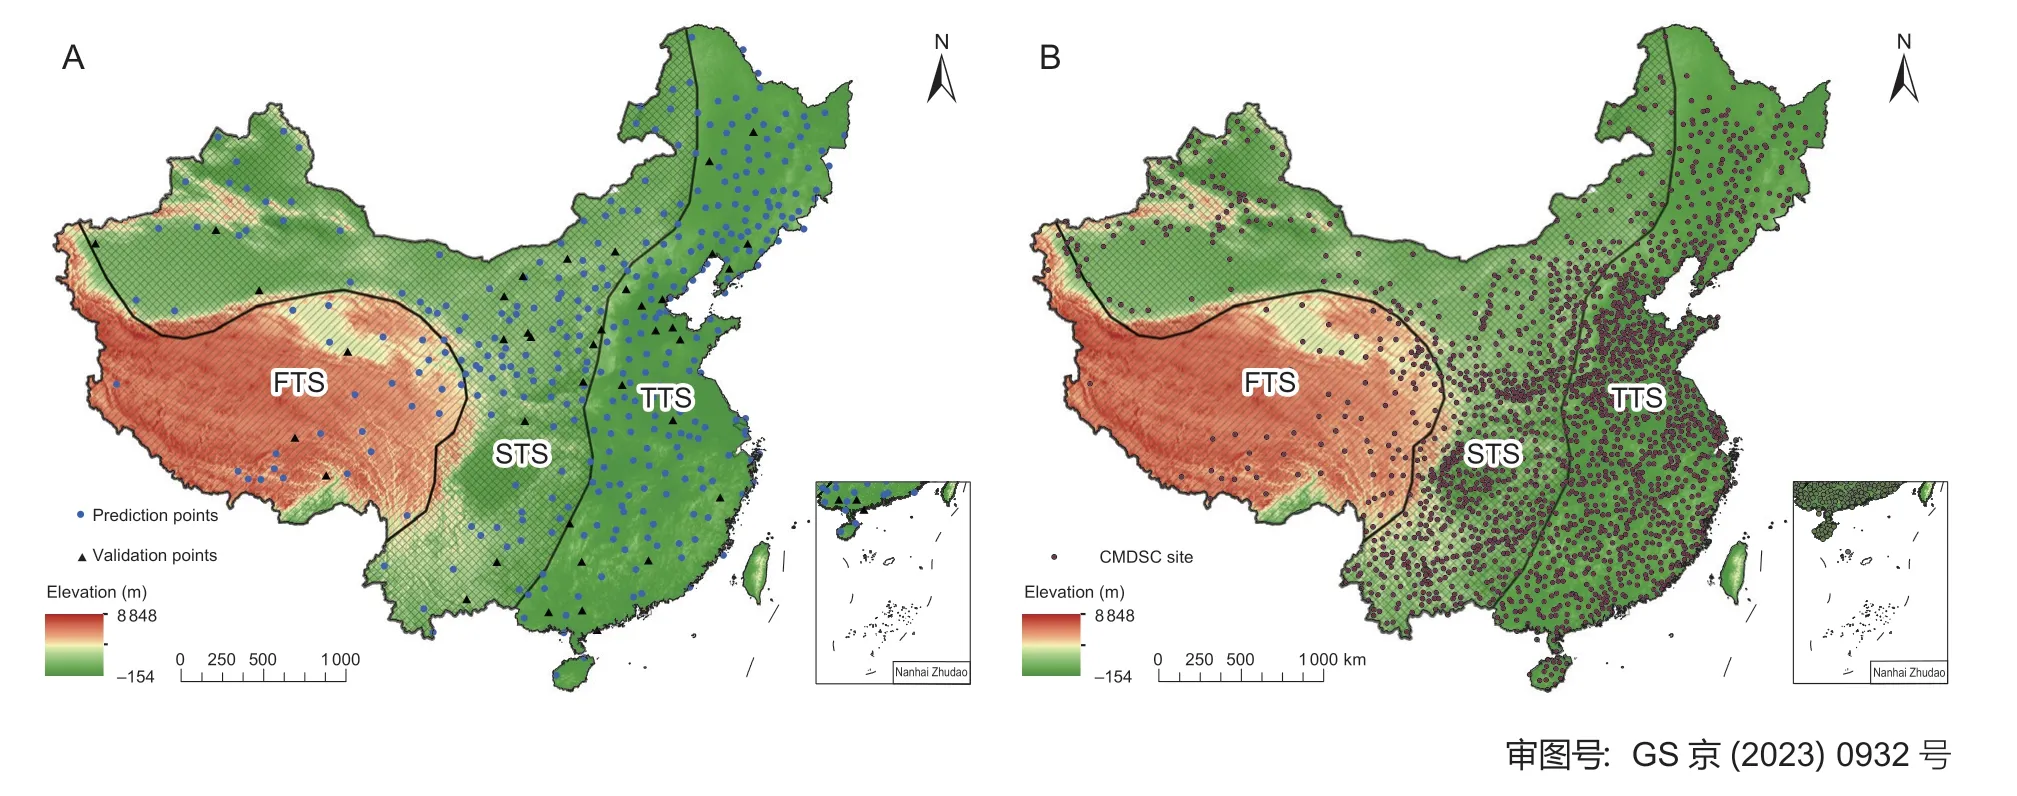
Fig.1 The topographic steps and geographic distribution of the meteorological stations used within the study area of China.A,386 sites with daily soil temperature records.B,2 048 national meteorological stations.FTS,first topography step; STS,second topography step; TTS,third topography step; CMDSC,China Meteorological Data Service Centre.
The first topographic step (FTS) is the Qinghai–Tibet Plateau,located between the Himalayan Range and the Taklamakan Desert of China.It covers an area of 2.3 million km2with an average elevation of about 4 000 m a.s.l.The main landforms of this region are plateaus and basins.The main climate type of this region is the Alpine climate.The second topographic step (STS) consists mainly of Inner Mongolia Plateau,Yunnan–Kweichow Plateau,Loess Plateau,Ordos Plateau,Qingling Ranges,and Yinshan Mountains,located between the Qinghai–Tibet Plateau and Daxing’an Ranges–Taihang –Wushan–Xuefengshan Mountains.The elevation of this region ranges from 1 000 to 2 000 m a.s.l.The main landforms of this region are plateaus and basins.The main climate types of this region are subtropical monsoon and temperate continental.The third topographic step (TTS) has the lowest average elevation (most of which is below 500 m a.s.l.) and consists mainly of plains and hills land forms.The main climate types of this region are subtropical and temperate monsoons.
2.2.Soil temperature dataset
For this study,a total of 386 sites with daily soil temperature records (1971–2000) at 40 and 80 cm depth were collected from CMDSC (Fig.1).A total of 31,143,and 212 sites with MAST50 measurements were available for the FTS,STS,and TTS,respectively.For the MAAT,a total of 96,817,and 1 135 sites were available for the FTS,STS,and TTS,respectively.The dataset was carefully evaluated to exclude technical errors.The 30-year (1971–2000) MAST at depths of 40 and 80 cm was calculated by averaging the daily measurements,respectively.The mean annual soil temperature at a depth of 50 cm (MAST50) of each point was calculated according to the eq.(1) proposed by Yangetal.(1989).
MAST50=MAST40+(MAST80–MAST40)/4 (1)where MAST40 and MAST80 are the mean annual soil temperature at a depth of 40 and 80 cm,respectively.
2.3.Environmental covariates
Soil temperature is highly variable due to multiple environmental factors.A total of 13 environmental covariates related to the variability and fluctuation of soil temperature were collected to represent the main soilforming factors,namely climate,geographic location,topography,and organism factors (Table 1).
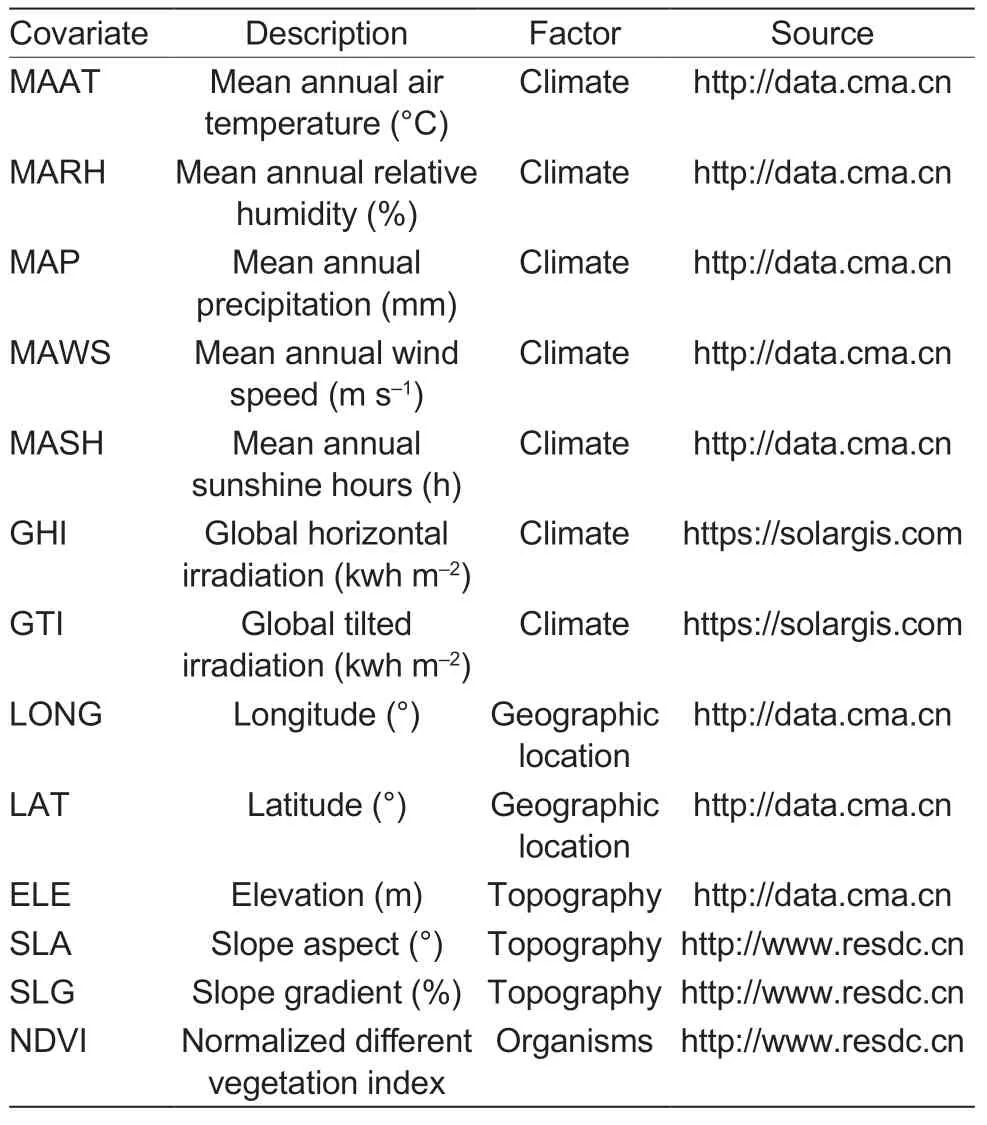
Table 1 Environmental variables used in this study
Climate and geographic locationThe climate covariates used in this study were collected from 2 048 national meteorological stations from 1971 to 2000.They were MAAT,mean annual relative humidity (MARH),mean annual precipitation (MAP),mean annual wind speed (MAWS),and mean annual sunshine hours (MASH) (Table 1).Global horizontal irradiation (GHI) and global tilted irradiation (GTI) (from 1999 to 2018) were collected from the solargis website (https://solargis.com).Longitude (LONG),latitude (LAT) and elevation (ELE) data were collected from CMDSC.
TopographySlope aspect (SLA) and slope gradient (SLG) data were extracted from digital elevation model (DEM) data (25 m×25 m),available from the Resource and Environment Science and Data Center of Chinese Academy of Sciences (http://www.resdc.cn).
OrganismsNormalized difference vegetation index (NDVI) can accurately reflect the surface vegetation coverage.The spatial distribution data set of China’s annual vegetation index (1 000 m×1 000 m) has been collected annually since 1998 based on SPOT/VEGETATION NDVI satellite remote sensing data of continuous time series.The data set was downloaded from the Resource and Environment Science and Data Center of the Chinese Academy of Sciences,which represent the calculated average mean from 1998 to 2018.
2.4.Spatial predictive modelling and evaluation
Spatial predictive modellingAmong the 386 CMDSC sites,90% (i.e.,347 sites) were randomly selected for model training and MAST50 predictions,while the remaining 10% sites (i.e.,39 sites) were used for model validation.The training and validation sites had equal proportions in all three topographic steps assuring a balanced dataset for model predictions.The statistical analysis was conducted using Statistical Product and Service Solutions v.13 (SPSS 13).The Pearson correlation analysis was performed to evaluate the relationship between the 13 environmental covariates and observed MAST50 in China at a significance level of 0.05 (P<0.05).A redundant analysis was conducted to remove the environment covariates with large variance inflation factors (>10).The environmental covariates significantly correlated with the observed MAST50 were used to spatially predict and map the variation of MAST50 across China.Therefore,seven covariates were selected for model building.
The regression kriging method combines linear regression (linear regression between target variables and auxiliary variables) and Kriging interpolation (spatial prediction of regression residuals) (Hengletal.2007).Suppose the observation variables are expressed asZ(S1),Z(S2),...Z(Sn),Si=(xi,yi),i=1–n,Siis the coordinate value of observation points,andnis the number of observation points.Then the value Z(S0)of the unknown point S0 can be predicted by the following formula:
In eq.(2),the trend termm(S0)is usually fitted by simple linear regression,and the residual term ε(S0)is interpolated using Ordinary Kriging,these two value were added together for the final prediction map.
Model evaluationThe model performance was evaluated by the mean absolute error (MAE),root mean square error (RMSE),and coefficient of determination (R2).The smaller the value of MAE and RMSE or the higher value ofR2,the higher the accuracy of the prediction results (Luetal.2019).Cross-validation and external validation were also conducted to evaluate the model accuracy.Crossvalidation can use different portions of the dataset to train the model on different iterations and test the model’s ability for MAST prediction.The equations for evaluating the performance of regression kriging were:
whereVoiis the measured mean annual soil temperature at a station,Vpiis the predicted value,nis the number of stations,andis the average ofVoi.
2.5.Soil temperature regimes
The classification standard of soil temperature in China is basically the same as that of Soil Taxonomy (SSS 2022),but the former includes the permagelic soil temperature regime (Gongetal.2007).The specific classification standard is shown in Table 2.
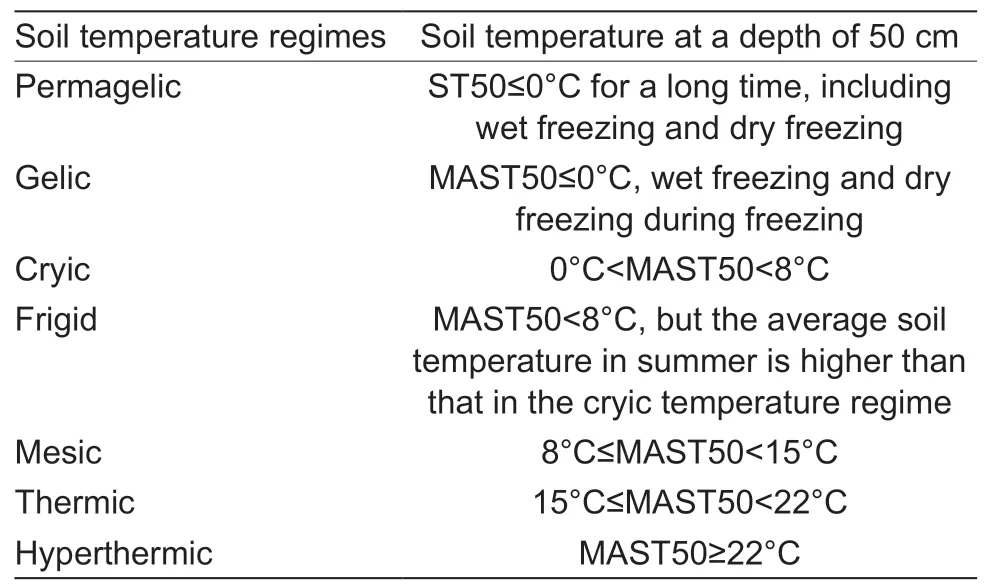
Table 2 Classification of soil temperature regimes1)
3.Results and discussion
3.1.Data characteristics of meteorological sites
The summary statistics of MAST50 and MAAT of the training and validation datasets are presented in Fig.2.The MAST50 for the training and validation datasets were 12.0 and 13.61°C and were higher than MAAT with 9.7 and 11.7°C,respectively.The Skewness and Kurtosis results indicated that the MAST50 and MAAT for the model building have a normal distribution that could be used for predicting the variation of MAST50 across China.The results also showed that MAST50 and MAAT of the training and validation datasets have a homogeneous distribution and were suitable for model building in this study.
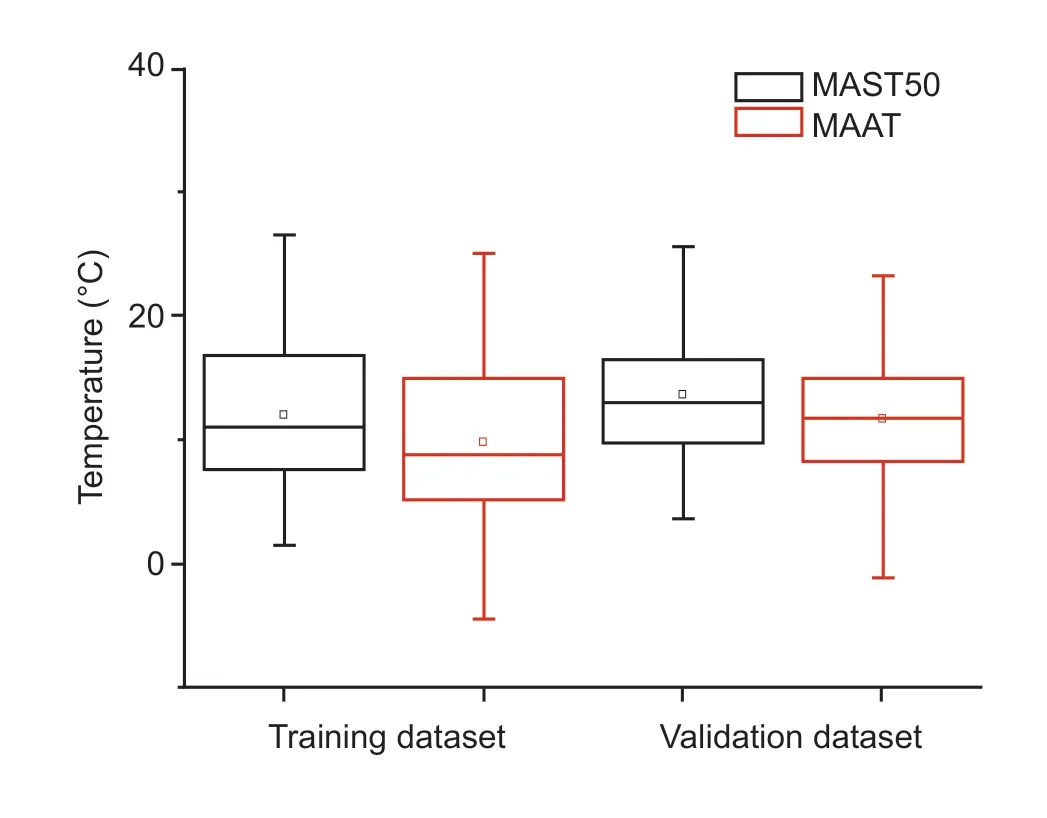
Fig.2 Data distribution of mean annual soil temperature at a depth of 50 cm (MAST50) and mean annual air temperature (MAAT) of the training and validation datasets.Small boxes and lines inside the box represent the mean and median value,respectively.The upper and lower ends of the whisker represent the maximum and minimum values,respectively.The upper and lower box boundaries represent 75th and 25th values,respectively.
3.2.Correlations between soil temperature and environmental factors
Soil temperature is the result of complex interactions with many environmental factors,including elevation,geographic location (longitude and latitude),slope gradient,slope aspect,solar radiation,air temperature,relative humidity,precipitation,wind,and surface cover (vegetation,litter,and snow thickness) (Fitton and Brooks 1931; Juin 1991; Grantetal.1995; Rodríguezetal.2010; Takataetal.2011).The influence of climate,geographic location,terrain attributes,and organisms on the MAST50 for the study area was evaluated based on the Pearson correlation coefficient (r) (Fig.3).The partial correlation analysis was conducted to assess collinearity issues between factors and identify the redundant environment factors.The correlation analysis showed that soil temperature was generally better correlated with climate,geographic location and topography than other environmental factors,as found by Smithetal.(1964).However,the correlation strength varied by topographic region,which is expected given different study area sizes and environmental factors.For example,the MAST50 was positively correlated with MAAT for the FTS with the highest elevation and relatively long sunshine time (Qinghai–Tibet Plateau),but the relationship was not significant.However,for the STS,the LONG,LAT,MARH,and MAAT were significantly correlated with MAST50,which were also consistent with the results from a previous study by Cheng (2017).For the TTS,the MAAT,MARH,LONG,and LAT were significantly correlated with MAST50.The MAST50 was positively correlated with MAAT and negatively correlated with LONG,LAT,and ALT for STS and China and,to a lesser degree,for the TTS (significant only for LAT).At the national scale,the influence of MAAT and geographic location on the variation of MAST50 was more prominent than MAP and MARH.The results of this study also showed that the factors related to MAST50 varied with different scales and regions.Overall,the MAAT was the most influential factor for MAST50 and was selected for predicting soil temperature regimes across China.

Fig.3 Pearson coefficient between mean annual soil temperature at a depth of 50 cm (MAST50) and its related environmental factors for the topographic steps and the entire study area.FTS,first topography step; STS,second topography step; TTS,third topography step; MAAT,mean annual air temperature; LONG,longitude; LAT,latitude; ALT,altitude; MARH,mean annual relative humidity; MASH,mean annual sunshine hours; MAP,mean annual precipitation.*,P<0.05; **,P<0.01.
3.3.Prediction models for soil temperature
Based on the above analysis and expert knowledge,the MAAT was selected as the best predictor for the MAST50 with reasonableR2and RMSE (Table 3).TheR2was greater than 0.96 for all models indicating a very strong relationship between MAAT and MAST50.The slope of the regression equations was close to 1 and very similar among all models.However,the intercepts varied from 2.2 (TTS) to 4.6 (FTS).The decreasing trend of the intercept with elevation change indicates a greater offset between MAST50 and MAAT going from the highest topographic step (FTS) to the lowest topographic step (TTS).The decreasing trend is likely due to the differences between continental and coastal climates that contribute to a smaller amplitude between MAST50 and MAAT for the coastal climate compared to the continental climate.

Table 3 The mean annual soil temperature at a depth of 50 cm (MAST50) prediction model at different scales1)
Two scenarios based on regression–Kriging were used for the spatial prediction of MAST50.The first scenario was based on the national PTF (MAST50=3.2+0.91×MAAT),and the second was on zonal PTFs.Generally,the spatial patterns of the MAST50 predicted by the two scenarios were relatively similar.However,the differences in predicted MAST50 between the two scenarios varied by region (Fig.4).As expected,the FTS region had the largest differences across China,which ranged from 0.52 to 5.89°C.The STS and TTS regions had relatively lower differences ranging from 0 to 1.94°C with few exceptions for the mountainous areas with high elevation,for example,the Tianshan Mountains,Altai Mountains,Taihang Mountains,Qinling Mountains,Wushan mountains,and Xuefengshan Mountains.
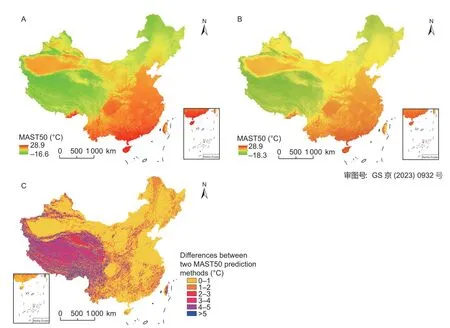
Fig.4 Spatial distribution of mean annual soil temperature at a depth of 50 cm (MAST50) predicted by the national pedotransfer function (PTF) model (A),zonal PTF model (B),and the difference between two prediction scenarios (C).
The MAST50 predicted by national PTF and zonal PTF had larger differences in the FTS region that could be related to the stereological sites’ distribution (i.e.,2 048 national meteorological stations with MAAT measurement) and model performance.The FTS region had a rather small number of stereological sites compared to other regions.The national model for predicting the MAST50 used the data across all regions (FTS,STS,and TTS),which might reduce the range of predicted MAST50 for the FTS region.The zonal PTF models based on the data from FTS,STS,and TTS performed better than the national model for predicting the MAST50 and were used to predict the spatial variation of MAST50 in this study.
A total of 39 sites were randomly selected for model validation (Fig.1).Results showed that the validation results were similar to the calibrated prediction models with an MAE of 0.84°C and RMSE of 0.96°C for national PTF,and MAE of 0.66°C and RMSE is 0.78°C for zonal PTFs.Both spatial prediction models had relatively higher accuracy than the previous models (Barringer 2000; Zhangetal.2008; Zhangetal.2009).Also,the MAST50 prediction was slightly better than predictions from another similar study based on 2 287 meteorological stations using regression kriging (Zhang 2008).In addition,the MAE and RMSE of the zonal PTF model were smaller by 0.18°C compared to the national PTF.The zonal PTF better reflected the environmental conditions of topographic steps,especially for FTS and TTS.
The Lin’s concordance correlation coefficients (CCF) (Lin 1989) of the predicted MAST50 for the national model based on cross-validation and the external validation were 0.97 and 0.92,respectively,compared to zonal models with values of 0.98 and 0.92,respectively (Fig.5).Overall,the zonal PTFs performed better than the national PTF and were selected to predict the MAST50 and spatially map soil temperature regime of China.
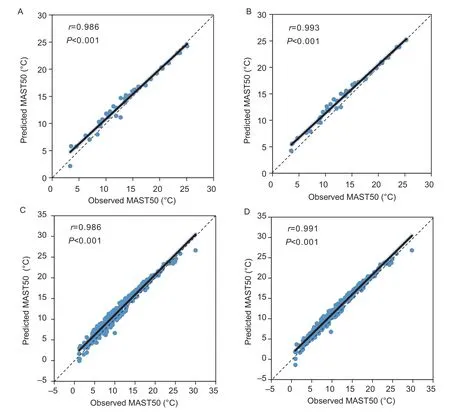
Fig.5 Predicted vs.observed of mean annual soil temperature at a depth of 50 cm (MAST50).A,external validation for national pedotransfer function (PTF) model.B,external validation for zonal PTF models.C,cross-validation for the national model.D,crossvalidation for zonal models.Concordance correlation coefficient and linear fit are shown by dotted line and solid line,respectively.
3.4.Spatial distribution of MAST50 across China
The spatial distribution map of MAST50 (10 km×10 km) based on zonal PTFs showed distinct patterns related to both elevation and latitude (Fig.6-A).The FTS and northwestern China (i.e.,most of the Qinghai–Tibet Plateau and parts of Xinjiang) had the lowest MAST50.By contrast,the southern margin of the Qinghai–Tibet Plateau and southern China had the highest MAST50.The MAST50 in eastern China decreased with latitude from south to north,ranging from –18.3 to 28.9°C.The MAST50 for northern China was less than 10°C,especially for northern Inner Mongolia and Heilongjiang.On the contrary,the MAST50 in Jianghuai areas ranged from 15 to 20°C and had the largest value on Hainan Island.The MAST50 also varied with evaluation,with larger values for the Tarim and Turpan Basin and lower values for the Qinghai–Tibet Plateau and the alpine areas of the Altai mountains,Tianshan Mountains and Qilian Mountains.
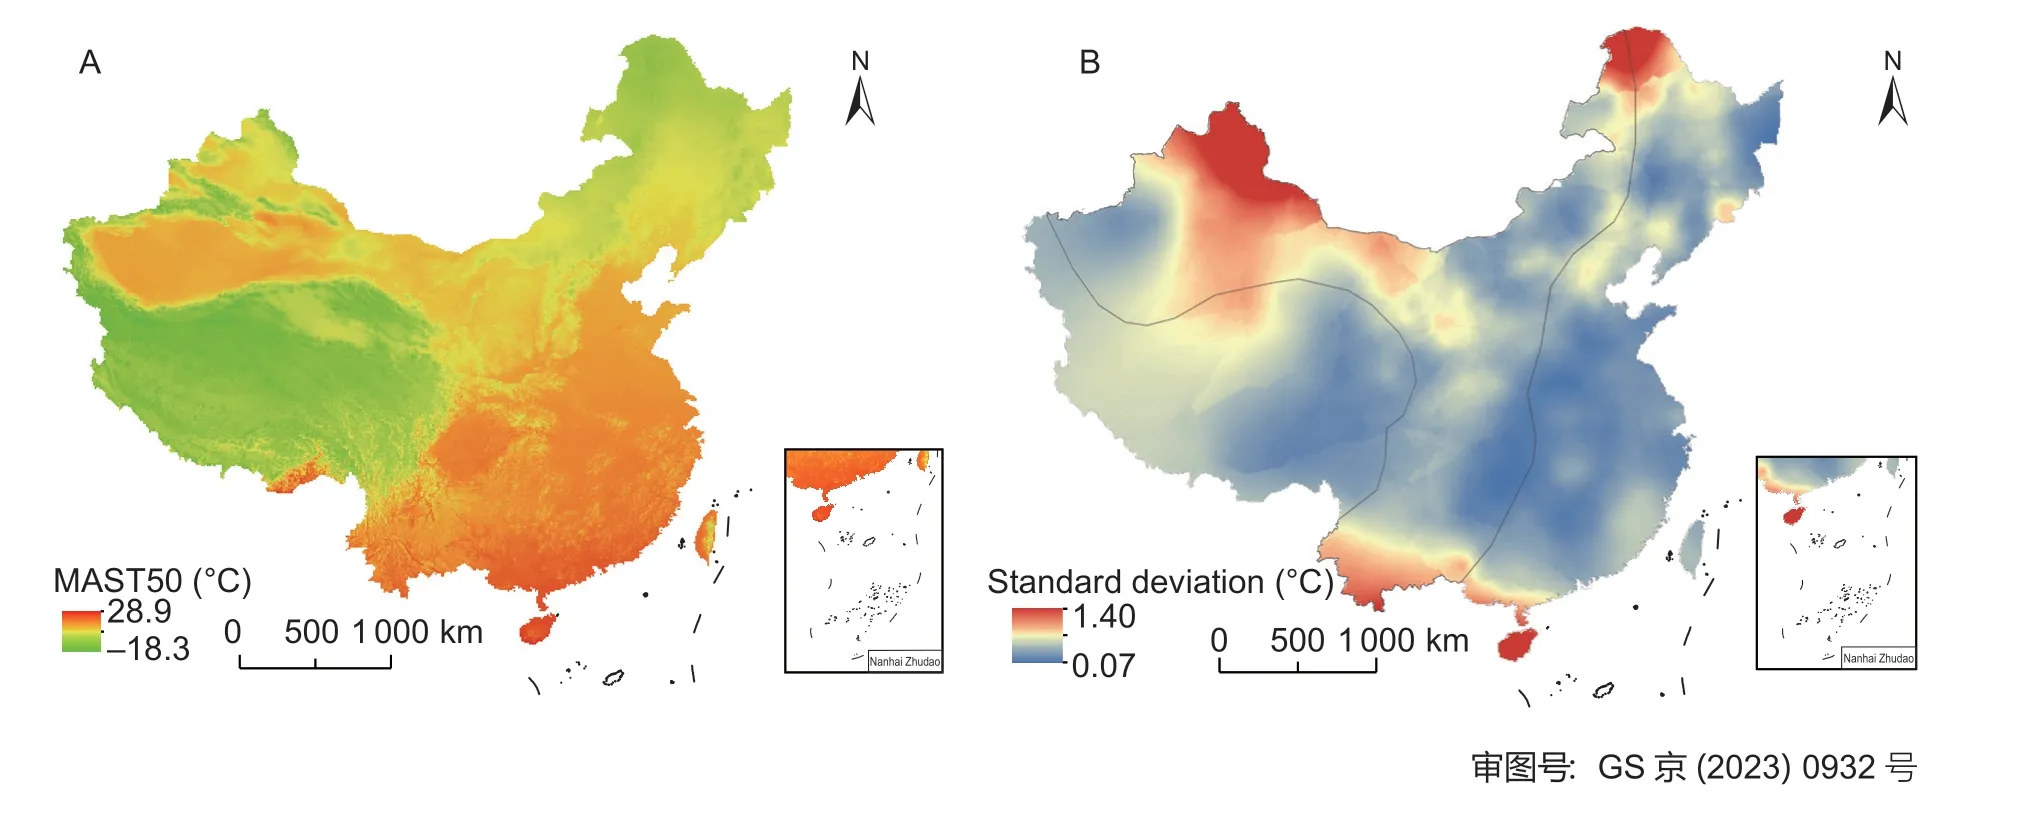
Fig.6 Predicted spatial distribution of mean annual soil temperature at a depth of 50 cm (MAST50; A) and their estimated errors (B) across China based on the zonal pedotransfer function model.
The mean value of standard deviation (SD) for the zonal PTFs was 0.32°C and varied from 0.07 to 1.40°C (Fig.6-B).However,the SD in Qinghai–Tibet Plateau and other high-elevation areas was larger,which was likely due to the distribution and density of meteorological stations,strong radiation,and the complex vegetation coverage.As expected,the MAST50 spatial patterns were similar to the MAAT,also demonstrated by previous studies (Qianetal.2011; Trnkaetal.2013; Jungqvistetal.2014).
3.5.Soil temperature regimes
Soil temperature regimes were delineated and mapped based on the Chinese Soil Taxonomy using the predicted MAST50 (Fig.7).The frigid and cryic temperature regimes had the same mean annual soil temperature.However,this study did not assess other classification criteria,like the presence of organic horizons and soil moisture conditions used to distinguish frigid and cryic temperature regimes.Therefore,the frigid and cryic temperature regimes were not mapped separately.The frigid and cryic temperature regimes were mainly distributed in northeast China (i.e.,Heilongjiang,Jilin,Liaoning,and Inner Mongolia),north and east Qinghai–Tibet Plateau,and foothills of the Altai Mountains and Tianshan Mountains.The regions with a daily soil temperature at 50 cm depth lower than 0°C were classified and mapped as the permagelic temperature regime.

Fig.7 Delineated soil temperature regime map of China based on the mean annual soil temperature at a depth of 50 cm (MAST50)predicted by zonal pedotransfer function models.
The permagelic and gelic temperature regimes predominated the Qinghai–Tibet Plateau,Daxing’anling Mountains,Altai alpines,and Tianshan Mountains (Figs.1 and 7).The spatial distribution of permagelic and gelic soil temperature regimes was consistent with the spatial distribution of permafrost regions of China (Qiu and Cheng 1995; Ran and Li 2018).The boundary between permagelic/gelic and mesic temperature regimes was associated with the borders of STS and TTS.The mesic temperature regimes mainly covered the Tarim Basin,Junggar Basin,Turpan Basin,Inner Mongolia Plateau,northwest of Yunnan–Kweichow Plateau and Loess Plateau in the STS and Circum–Bohai–Sea regions in the TTS.The thermic temperature regimes covered mainly the southern part of the North China Plain,the Middle-lower Yangtze Plain,the Sichuan Basin,most Yunnan–Kweichow Plateau,and the south margin of the Qinghai–Tibet Plateau.The hyperthermic soil temperature regimes occurred mostly in the southern areas of the Tropic of Cancer.
3.6.Soil temperature regimes and vegetation distribution
The delineation of STR was also consistent with the distribution of natural plant communities,cropping systems,and main crop types as observed by others (Smith 1986; Luetal.2016; D’Avelloetal.2021).The distribution of alpine vegetations in the Qinghai–Tibet Plateau and cold temperate coniferous forests in Northeast China was mainly associated with the permagelic and gelic STR as found by others (Fang and Zhang 2013; Hanetal.2017).The typical crops include cold and drought-resistant highland barley (Hordeumvulgarevar.oeleste L.) and peas (PisumsativumL.) on the Qinghai–Tibet Plateau and soybeans (Glycinemax(Linn.) Merr.) and potato (SolanumtuberosumL.) in the cold temperate zone in Northeast China.Because of low MAST50 temperatures,the farming system is only one crop a year.
The temperate grassland and coniferous and broadleaf mixed forests were mainly distributed in the frigid and cryic STR regions.The farming system in these regions is only one crop a year,like spring wheat (TriticumaestivumL.) and corn (Zeamays).The west and east areas of the mesic STR region are dominated by temperate desert and warm temperature deciduous broad-leaf forests,respectively (Fangetal.2002).The STR mesic regions are suitable for multiple cropping systems and crops,including winter wheat,corn,cotton (Gossypiumspp.),peanut (ArachishypogaeaLinn.),rice (OryzasativaL.) and soybean (Glycinemax(Linn.) Merr.) (Qinetal.2015).The subtropical evergreen broad-leaf forests were mainly distributed in thermic STR regions and are the largest areas for rice production in China under the rice–upland crop rotation system (Nie and Peng 2017).Tropical monsoon forests and rainforests were mainly distributed in hyperthermic STR regions,with the main crops being rice,sugarcane (SaccharumofficinarumL.),and natural rubber (Heveabrasiliensis).The hyperthermic STR regions are also suitable for growing litchi (Litchichinensis),logan (Dimocarpuslongan),banana (MusananaLour.),and pineapple (Ananascomosus(Linn.) Merr.) (Zhao and Wu 2014; Chen 2015; Xuetal.2018).
3.7.Study limitations and perspectives
The quantity and type of the soil temperature data influenced the accuracy predictions of the MAST50 and subsequent delineations of the STR.One of the major limitations of this study was the distribution and number of stations with measured soil temperatures.The FTS region with the highest elevation and temperature amplitude also had the lowest number of stations with measured soil temperature.In addition,the MAST50 was calculated as the average of 40 and 80 cm depth from the daily soil temperature.The use of regression equations to predict MAST50 from MAAT further added the uncertainty of accuracy predictions.The regression kriging MAST50 was another source of uncertainty for spatial predictions of MAST50.Soil moisture,which significantly modifies the soil temperature and is especially critical for frigid and cryic temperature regimes,was not considered as a criterion for delineating the STR due to the lack of such data.Therefore,the interpretation of the STR map is limited,especially for finer scales like landscapes within mountain ranges,plateaus,and basins.It is obvious that more georeferenced sites with measured soil temperature and moisture from 0 to 80 cm would improve the STR map of China to support the management of soils,crops and other ecosystem functions.
4.Conclusion
This study predicted the MAST50 across China using the zonal PTFs and regression–Kriging models.Among environmental factors,the MAAT was the most important variable related to MAST50.Based on the validation results,the zonal PTFs better predicted the MAST50 with an MAE of 0.66°C and RMSE of 0.78°C.Results demonstrated that the proposed PTFs could improve the accuracy of the spatial prediction of MAST50 for complex terrain and environment conditions like the FTS.
Based on predicted MATS50 from MAAT using PTFs,seven major STR according to the CST were delineated: hyperthermic,thermic,mesic,frigid or cryic,gelic,and permagelic temperature regimes.However,the frigid and cryic temperature regimes were not separated due to lack of data on the soil moisture conditions.Data and studies on soil moisture are needed to classify the frigid and cryic temperature regimes separately.The STR map was consistent with the spatial distribution of natural plant communities and major crops.Therefore,it can be used for supporting decisions on land use,crop management,and soil classification at the regional scale.
Acknowledgements
The authors sincerely thank the students and staff involved in the data collection.The study was funded by the National Key Basic Research Special Foundation of China (2021FY100405),the National Natural Science Foundation of China (U20A20114,42201069 and 42077002),and the Fundamental Research Funds for Central Non-profit Scientific Institution,China (1610132018012).
Declaration of competing interest
The authors declare that they have no conflict of interest.
杂志排行
Journal of Integrative Agriculture的其它文章
- Combining nitrogen effects and metabolomics to reveal the response mechanisms to nitrogen stress and the potential for nitrogen reduction in maize
- Natural variations and geographical distributions of seed carotenoids and chlorophylls in 1 167 Chinese soybean accessions
- Carbon sequestration rate,nitrogen use efficiency and rice yield responses to long-term substitution of chemical fertilizer by organic manure in a rice–rice cropping system
- ldentification and epitope mapping of anti-p72 single-chain antibody against African swine fever virus based on phage display antibody library
- Dissecting the genetic basis of grain color and pre-harvest sprouting resistance in common wheat by association analysis
- The PcERF5 promotes anthocyanin biosynthesis in red-fleshed pear (Pyrus communis) through both activating and interacting with PcMYB transcription factors
