The PcERF5 promotes anthocyanin biosynthesis in red-fleshed pear (Pyrus communis) through both activating and interacting with PcMYB transcription factors
2023-09-16CHANGYaojunCHENGuosongYANGGuangyanSUNCongruiWEIWeilinSchuylerKORBANWUJun
CHANG Yao-jun,CHEN Guo-song,YANG Guang-yan,SUN Cong-rui,WEI Wei-lin,Schuyler S.KORBAN,WU Jun#
1 College of Horticulture,State Key Laboratory of Crop Genetics & Germplasm Enhancement and Utilization,Nanjing Agricultural University,Nanjing 210095,P.R.China
2 Department of Natural Resources and Environmental Sciences,University of Illinois at Urbana-Champaign,Urbana,IL 61801,USA
Abstract
As there is a strong interest in red-skinned pears,the molecular mechanism of anthocyanin regulation in red-skinned pears has been widely investigated; however,little is known about the molecular mechanism of anthocyanin regulation in red-fleshed pears due to limited availability of such germplasm,primarily found in European pears (Pyrus communis).In this study,based on transcriptomic analysis in red-fleshed and white-fleshed pears,we identified an ethylene response factor (ERF) from P.communis,PcERF5,of which expression level in fruit flesh was significantly correlated with anthocyanin content.We then verified the function of PcERF5 in regulating anthocyanin accumulation by genetic transformation in both pear skin and apple calli.PcERF5 regulated anthocyanin biosynthesis by different regulatory pathways.On the one hand,PcERF5 can activate the transcription of flavonoid biosynthetic genes (PcDFR,PcANS and PcUFGT) and two key transcription factors encoding genes PcMYB10 and PcMYB114.On the other hand,PcERF5 interacted with PcMYB10 to form the ERF5-MYB10 protein complex that enhanced the transcriptional activation of PcERF5 on its target genes.Our results suggested that PcERF5 functioned as a transcriptional activator in regulating anthocyanin biosynthesis,which provides new insights into the regulatory mechanism of anthocyanin biosynthesis.This new knowledge will provide guidance for molecular breeding of red-fleshed pear.
Keywords: Pyrus communis,red-fleshed,anthocyanin biosynthesis,PcERF5,PcMYB10/PcMYB114
1.Introduction
Pear is one of the leading cultivated temperate fruit tree crops in China.The pear belongs to the genusPyrusof the subfamily Pomoideae or Maloideae in the family Rosaceae,and it is likely originated in the Tertiary period or even earlier (Rubtsov 1944).The pear is a functional diploid with a base chromosome number of 17 and a genome size of ~530.0 Mb (Wuetal.2013).Compared with other Rosaceae species,such as apple,strawberry and peach,the pear fruit usually has a rather plain and less attractive green/green-yellow color.However,between the two major pear groups,Asian and European pears,the European pear also has several red-skinned fruit cultivars and germplasm,while the Asian pear has only a few red-skinned fruit germplasm along with a lower number of high-quality red-skinned fruit cultivars.Moreover,there are no red-fleshed germplasm of Asian pears,and only a handful of red-fleshed germplasm,mostly wild small-fruited,of European pears.The red color in pear is attributed to the biosynthesis and accumulation of the anthocyanin pigment (Steynetal.2005; Huangetal.2009).Anthocyanins are an important class of flavonoids,polyphenolic secondary metabolites,and they are glucosides of anthocyanidins (Winkel-Shirley 2001).This class of water-soluble vacuolar pigments is synthesizedviathe phenylpropanoid and flavonoid pathways,wherein flavonoids are synthesized through the phenylpropanoid pathway,transforming phenylalanine into 4-coumaroyl-CoA,and this,in turn,enters the flavonoid biosynthetic pathway (Winkel-Shirley 2001).These pathways involve several enzyme-encoding structural genes,including those for phenylalanine ammonia lyase (PAL),chalcone synthase (CHS),chalcone isomerase (CHI),flavanone 3-hydroxylase (F3H),dihydroflavonol 4-reductase (DFR),anthocyanidin synthase (ANS) and UDP-glucose:flavonoid 3-O-glucosyltransferase (UFGT) (Holton and Cornish 1995; Winkel-Shirley 2001).Among these,PAL,CHS,andCHIare referred to as early biosynthetic genes (EBGs),as they participate as precursors in the flavonoid pathway,whileDFR,ANS,andUFGTare referred to as late biosynthetic genes (LBGs),and they are involved in the anthocyanin biosynthesis (Holton and Cornish 1995; Winkel-Shirley 2001).
Anthocyanin biosynthesis is commonly metabolized at the transcriptional level by various transcription factors (TFs),including MYB,basic helix-loop-helix (bHLH),and WD40 (Grotewold 2006).These regulatory TFs can form the well-known MYB-bHLH-WD40 (MBW) ternary complex that binds to the promoters of anthocyaninrelated genes,and promotes anthocyanin accumulation (Allanetal.2008; Dareetal.2008; Gonzalezetal.2008).Apart from the MBW complex,much attention has also focused on other complexes such as ERF-MYB-bHLH (Yaoetal.2017) and BBX-HY5 (Baietal.2019a,b),as well as various TFs and regulatory genes such asMADS(Nesietal.2002),NAC(Morishitaetal.2009),PIF3(Shinetal.2007),ELONGATED HYPOCOTYL 5 (HY5) (Shinetal.2013),COP1(Maieretal.2013),JASMONATE ZIM domain (JAZ) genes (Qietal.2011),and SQUAMOSA PROMOTER BINDING PROTEIN-LIKE (SPL) genes (Gouetal.2011).These latter regulatory genes are reported to interact with the MBW complex or to coordinately activate multiple genes of the anthocyanin biosynthetic pathway in various angiosperms (Luoetal.2022).
To date,the molecular mechanism of anthocyanin regulation in red-skinned pears has been well studied.It was reported that MYB TFs played essential roles in skin coloration,and thatPyMYB10,fromPyruspyrifolia,was found to participate in the regulation of anthocyanin biosynthesis in some pear cultivars (Fengetal.2010; Zhangetal.2011; Yuetal.2012).Yaoetal.(2017) reported that PyMYB114 interacted with PyERF3 and its partner PybHLH3 to co-regulate anthocyanin biosynthesis.Subsequently,other TFs received attention such as PybZIPa which was reported to be involved in light-induced anthocyanin accumulation by binding to the tandem G-box in the promoter ofPyUFGTto activate this gene (Liuetal.2019).Moreover,PyWRKY26 and PybHLH3 were found to co-target the promoter ofPyMYB114; thus,resulting in anthocyanin accumulation in red-skinned pears (Lietal.2020).Additionally,severalBBXfamily genes were reported to participate in anthocyanin biosynthesis in fruit skin of pear (Baietal.2019a,b; Ouetal.2020).For example,BBX16was found to positively regulate lightinduced anthocyanin biosynthesis through its activation ofMYB10,whilePpBBX18andPpBBX21,both fromP.pyrifolia,antagonistically regulated anthocyanin biosynthesis via their competitive associations with HY5 in pear fruit skin (Baietal.2019a,b).Furthermore,a 14 nucleotide deletion mutation in the coding region of thePpBBX24gene was reported to be associated with the red skin color in pearcv.‘Zaosu Red’ (Ouetal.2020).
More recently,many ERF TFs are reported to play either positive or negative roles in skin coloration.Baietal.(2017) found several ERF TFs responded to light,suggesting that they may be involved in anthocyanin biosynthesis.Nietal.(2019) reported that both Pp4ERF24 and Pp12ERF96 interacted with PpMYB114 regulate blue light-induced anthocyanin biosynthesis in pear pericarp.Moreover,it was observed thatPbERF22promoted lanolin-induced anthocyanin biosynthesis in ‘Zaosu’ pear (Wuetal.2020),whilePpERF105inhibited anthocyanin biosynthesis in red-skinned pear by inducing expression of inhibitory R2R3-MYBPcMYB140(Nietal.2021).All the above findings demonstrated the complexity of the regulatory mechanism underlying anthocyanin biosynthesis in pear skin coloration.
On the other hand,several studies have been conducted to explore the mechanism of fruit flesh coloration in various fruit crops,including apple (Malus×domestica),strawberry (Fragariachiloensis),peach (Prunuspersica),and kiwifruit (Actinidiachinensis).For example,regulators controlling anthocyanin biosynthesis have been well investigated in red-fleshed apples.It was reported thatMdMYB10controlled red pigmentation in the flesh of phenotype type-1 apple (characterized by red coloration throughout the fruit core,cortex,and foliage),whileMdMYB110awas responsible for the red-fleshed phenotype type-2 apple (characterized by red pigmentation only in the fruit cortex) (Chagnéetal.2007,2013; Espleyetal.2007).Following transcriptomic analysis of the red-fleshed apple,it was also observed thatMdWRKY11played a novel role in anthocyanin biosynthesis (Wangetal.2018).Subsequently,MdNAC42 was found to participate in anthocyanin accumulation of red-fleshed phenotype type-1 appleviaits interaction with MdMYB10 (Zhangetal.2020).Studies in strawberry(F.chiloensis) reported thatFcMYB1played a negative role in anthocyanin accumulation in red fruits (Salvatierraetal.2013).In comparative transcriptomic analysis in peach,theNACgeneBLOOD(BL) was identified and implicated in the blood-fleshed traitviaits activation ofPpMYB10.1(Zhouetal.2015).In kiwifruit,Liuetal.(2017) reported that expression profiles ofAcMYBF110correlated with changes in anthocyanin content and red flesh coloration in three cultivars.
There has been increased interest and advances in breeding for the red flesh fruit trait in fruit crops due to consumer interest in fruits with high levels of antioxidants.However,there is little knowledge of the molecular regulatory mechanism of the red flesh color trait in pear.This is due to the very limited available germplasm resources carrying this trait,which is mainly detected in European pears (Pyruscommunis).In this study,an ERF transcription factor,designated PcERF5,was observed to play a critical role in anthocyanin accumulation,as well as in the regulatory mechanism of anthocyanin biosynthesis in red-fleshed pear.These findings provide new insights into the regulatory mechanism of anthocyanin biosynthesis in red flesh pear.
2.Materials and methods
2.1.Plant materials and fruit harvest
Fruits of European pear (P.communis) germplasm were collected from orchards at the U.S.National Clonal Repository (Corvallis,Oregon).This germplasm included a red-fleshed pear with yellowish-green skin ‘Summer Blood Birne’ (SB),a white-fleshed pear with yellowish-green skincv.‘Bartlett’ (B),and a white-fleshed pear with red skincv.‘Rosired Bartlett’ (RB),a mutant of ‘Bartlett’,used as control.Fruits of the two whitefleshed pear cultivars were collected at stage 1 (S1) on June 7,2015,while fruits of the red-fleshed pear were collected at stage 1 (S1),on June 7,2015,and stage 2(S2),on July 25,2015.Following harvest,fruit flesh was immediately vacuum-dryed,frozen,and stored in an ultrafreezer at –80°C until use.
2.2.Anthocyanin extraction and measurement
Anthocyanins were extracted as previously reported by Yaoetal.(2017) with a slight modification.Briefly,approximately 0.4–0.5 g of pear skin/flesh,of each of the three genotypes at each of the stages described above,and of apple calli were ground separately in liquid nitrogen,and each were then suspended in cold methanol with 0.1% HCl at 4°C for 24 h.The mixture was centrifuged at 12 000 r min–1for 10 min and supernatants were collected,then transferred to a new tube.Absorbance of each of the extracts was measured at 530,620,and 650 nm using a UV-VIS spectrophotometer (MAPADA UV-1800,Shanghai,China).Anthocyanins of each extract were eluted with 1 mL methanol,filtered through a 0.22-μm Millipore membrane,and analyzed using the UPLC system (Waters Acquity TM Ultra-Performance LC®,Milford,MA,USA) with a PDA detector,a cooling autosampler,and a column oven for temperature control of the analytical column.An Acquity UPLC BEH C18 column,2.1 mm×50 mm,with a 1.7-μm particle size (Waters) was used.
Anthocyanin concentrations in each extract were determined by comparing peak areas to standard curves of each of cyanidin 3-galactoside,cyanidin 3-glucoside,cyanidin 3-arabinoside,peonidin 3-galactoside,peonidin 3-glucoside,and peonidin 3-arabinoside.The analytical column was sequentially eluted using a mobile phase A(formic acid: water,5:95,v/v) and a mobile phase B (acetonitrile) at a flow rate of 0.4 mL min–1.The linear gradient of phase A was as follows: 0–0.4 min,95% A;0.4–6 min,80% A; and 6.1–7 min,95% A.The wavelength of the PDA detector was set at 498 nm.All analyses were performed at room temperature (25°C),and data were collected and processed using the chromatographic software Empower (Waters).
2.3.Genomic DNA and total RNA isolation
Genomic DNA (gDNA) was extracted from fruit flesh of each of the three pear genotypes at each of the stages to clone promoter regions using the Plant DNA Isolation Kit (Foregene,Chengdu,China),according to the manufacturer’s instructions.Total RNA was extracted using the Plant Total RNA Isolation Kit Plus (Foregene),and subjected to DNase I treatment using the DNA-free Kit (Applied Biosystems,Waltham,MA,USA).The concentration and quality of RNA of each sample were determined using a NanoDrop™ 2000 UVVIS spectrophotometer (Thermo Scientific,Waltham,MA,USA) and gel electrophoresis on 1% agarose,respectively.
2.4.RNA-sequencing (RNA-seq) library construction
A TruSeq Stranded mRNA Sample Prep Kit (Illumina,San Diego,CA,USA) library preparation kit was used to generate sequencing libraries,according to the manufacturer’s instructions.Each of the libraries was quantified by qPCR,and 101 cycles were sequenced from both ends of a fragment on a HiSeq 2500 system (Illumina) using a HiSeq SBS Sequencing Kit.
A FASTQ file was generated for each library,and was demultiplexed using a bcl2fastqv2.17.1.14 conversion software.Original readings of a sample were first processed by an internal perl script,and high-quality reads were retained by deleting adapter sequences,low-quality reads,and reads containing poly-Ns from the original data using a Trimmomatic 0.39 tool.All subsequent analyses were based on high-quality clean reads.
2.5.Genome alignment analysis and data processing
The genome sequence for the European pear,available at our laboratory website (http://peargenome.njau.edu.cn/),was used as a reference,and an index of the reference genome was established.Clean reads at ends of a pairing were compared to the reference genome using the HISAT2 2.1.0 alignment program.Then,the online software Samtools 1.9 (https://github.com/samtools/samtools) was used to transform and sort sequence alignments and map files.Moreover,quantification of gene expression levels was calculated using FeatureCounts 1.6.3 software and an internal Python script.Then,these were displayed by Reads Per Kilobase per Million mapped reads (RPKM).
2.6.Screening of differentially expressed genes (DEGs)
DEGs were screened using a DESeq2/R software package (http://www.bioconductor.org/packages/release/bioc/htmL/DESeq2.htmL).The ‘DESeq’ function was applied for differential expression analysis.Those genes with correctedP-values of less than or equal to 0.05 and with log2(fold-change) of either greater than or equal to 1 or less than or equal to –1 were deemed as DEGs.These DEGs were used for further functional annotation and enrichment analysis.
2.7.Gene ontology (GO) and kyoto encyclopedia of genes and genomes (KEGG) enrichment analysis
To assess and assign potential functions of DEGs,GO and KEGG were used to annotate their functions.The functional enrichment analysis of DEGs was carried out by using the online tool KOBAS 3.0 (http://kobas.cbi.pku.edu.cn/kobas3/genelist/).The results of enrichment analyses were displayed using the ggplot2 package (https://github.com/tidyverse/ggplot2).
2.8.Real-time quantitative PCR (RT-qPCR) analysis
Approximately,1 000 ng (1 μg) of total RNA was used for the first-strand cDNA synthesis using the One-step gDNA Removal and cDNA Synthesis Kit (Transgen,Beijing,China).An RT-qPCR analysis was conducted using gene-specific primers in a 20-μL volume containing 150 ng cDNA as a template,0.2 μmol L–1of each primer,and 10 μL of LC480 SYBR Green I Master mix (Roche,Mannheim,Germany),according to the manufacturer’s protocol.The amplification program was carried out using a LightCycler 480 II®(Roche,Indianapolis,IN,USA) with a single preincubation cycle of 2 min at 95°C,followed by 45 cycles of 3 s at 95°C,10 s at 60°C,30 s at 72°C,and then a melting curve with one cycle of 30 s at 95°C,1 min at 60°C,and a final cycle of 30 s at 40°C.A melting curve analysis was used after 45 cycles to ensure appropriate amplification of the target genes.The transcript abundance was determined using a 2–ΔΔCTalgorithm,and a housekeeping gene,aPyrusGAPDH(glyceraldehyde-3-phosphate dehydrogenase,accession number AB266449) was used for normalization.All analyses were repeated three times using three technical replicates with error bars.A list of all primers used is provided (Appendix A).
2.9.Subcellular localization of PcERF5
For subcellular localization of the gene of interest,a fulllength cDNA ofPcERF5,without a termination codon,was fused to the N-terminal green fluorescent protein (GFP) gene,under the control of the constitutivecauliflowermosaicvirus(CaMV) 35S promoter,and introduced into the binary vector pCAMBIA1302,yielding the fusion vector PcERF5-GFP by using the CloneExpress®II One Step Cloning Kit (Vazyme,Beijing,China),according to the manufacturer’s instructions.Following confirmation of the correct fusion by DNA sequencing,each of the plasmid PcERF5-GFP and a negative control vector (GFP alone) was transferred intoAgrobacteriumtumefaciensstrain GV3101 using the freeze-thaw method.
When the OD600of theAgrobacteriumsuspension culture reached 0.6–0.8,abaxial leaf surfaces of ~3-weekold tobacco (Nicotianabenthamiana) seedlings were used for infiltration (Kumar and Kirti 2010).After 60–72 h,whole leaf tissues at infiltration sites were collected,and stained with a DAPI staining buffer.A confocal microscope LSM780 (Carl Zeiss,Leipzig,Germany) was used to monitor green fluorescence signals and unclear DNA,and an Adobe Photoshop CS6 (Adobe Systems,San Jose,CA,USA) was used to process all photoimages.Laser intensity,pinhole,and photomultiplier gain settings were maintained constant among samples for comparative analysis of these images.All primers used for the PcERF5-GFP constructs are listed in Appendix A.
2.10.Yeast two-hybrid (Y2H) assay
Full-length coding sequences ofPcERF5,PcMYB10,andPcMYB114were cloned using appropriate primers (Appendix A),and PCR products were purified using a FastPure DNA Gel Extraction Kit (Vazyme).The open reading frame (ORF) ofPcERF5was introduced into the pGBKT7 vector to generate the PcERF5-pGBKT7 construct.To assay the transactivation activity of PcERF5,the plasmid PcERF5-pGBKT7 was transferred into yeast strain AH109.Transformed yeast cells were selected using SD plates lacking either tryptophan (SD/–Trp) or lacking tryptophan–histidine–adenine (SD/–Trp/–His/–Ade) at 30°C for 3 days.The ORFs ofPcMYB10andPcMYB114were seperately inserted into the pGADT7 vector to generate PcMYB10-pGADT7 and PcMYB114-pGADT7 constructs.The plasmids of PcERF5 and PcMYB10 or PcMYB114 were co-transformed into AH109 using the LiAC-PEG method,and yeast transformants were transferred to SD/–Trp/–Leu selection plates.Single colonies derived from SD/–Trp/–Leu plates were streaked onto fresh SD/–Trp/–Leu and SD/–Trp/–Leu/–His/–Ade plates to detect interactions.Then,transformed yeast cells were selected,and cultured on a SD/–Leu/–Trp liquid medium with 220 r min–1of shaking until the OD600reached 0.8.Subsequently,5 μL of liquid culture were pipetted onto SD/–Trp/–Leu and SD/–Trp/–Leu/–His/–Ade plates,and incubated for 3 days.The co-transformation of either pGBKT7-53 and pGADT7-T or pGBKT7-Lam and pGADT7-T were used as positive and negative controls,respectively.Photographic images were taken using a Canon digital camera.For transactivation assessments,photographic images were taken 3–5 days after inoculation on media,as well as for the Y2H experiment.
2.11.Bimolecular fluorescence complementation (BiFC) assay
For BiFC analysis,the full-length coding sequence (CDS) ofPcERF5,excluding the stop codon,was PCR-amplified,and fused with pSPYCE-35S to generate the PcERF5-YCE vector.Moreover,full-length cDNAs ofPcMYB10andPcMYB114,without stop codons,were separately integrated into the pSPYNE-35S vector to generate the PcMYB10-YNE and PcMYB114-YNE constructs.These recombinant constructs were transformed into young tobacco leavesviaAgrobacterium-mediated genetic transformation.Subsequently,fluorescence signals were observed using a confocal microscope LSM780 (Carl Zeiss),and photo-images were processed with ZEN 2012 (Carl Zeiss).
2.12.Luciferase complementation imaging (LCI) assay
The full-length cDNA ofPcERF5was introduced into pCAMBIA1300-cLUC to generate the PcERF5-cLUC fusion vector.Subsequently,cDNAs of each ofPcMYB10andPcMYB114were separately introduced into the pCAMBIA1300-nLUC vector to generate PcMYB10-nLUC and PcMYB114-nLUC plasmids.The plasmids of these recombinant constructs were transferred intoA.tumefaciensGV3101 cells.
Suspension cultures ofAgrobacteriumcells (OD600=0.6–0.8) carrying each of the recombinant constructs were infiltrated into abaxial surface of young tobacco leaves.Whole infiltrated leaves were collected after 48–60 h,sprayed with D-Luciferin Potassium Salt (Goldbio,St.Louis,MO,USA),and images were acquired using a charge-coupled device imaging system PIXIS 1024B (Princeton,USA).
2.13.Dual-luciferase assay of transiently transformed tobacco leaves
For dual-luciferase assay,to construct the effector construct,the full-length cDNAPcERF5along with the CaMV 35S promoter was inserted into the pSAK277 vector to form PcERF5-pSAK277.To prepare reporter constructs,promoters ofPcMYB10,PcMYB114and the following anthocyanin biosynthetic genesPcDFR,PcANS,andPcUFGTwere amplified from the genomic DNA of pear ‘Summer Blood Birne’ using primers listed in Appendix A and then independently introduced into the binary vector pGreenII 0800-LUC vector to drive expression of theLUCgene (Hellensetal.2005).Plasmids of each of the fusion constructs,other than PcERF5-pSAK277,were transferred intoA.tumefaciensstrain GV3101 (pSoup-p19) (Shanghai Weidi Biotechnology Co.,Ltd.,Shanghai,China).
Tobacco leaves were transfected with a single reporter construct,a negative control,or a reporter construct together with an effector construct,a positive construct,to detect the effects of PcERF5 on activation of different promoters.A luciferase detection kit Dual-Luciferase®Reporter Assay System (Promega,Madison,WI,USA) was used to detect the LUC/REN activity.
2.14.Anthocyanin induction via transient gene expression in ‘Zaosu’ pear fruits
The coding sequences of each ofPcMYB10andPcMYB114were independently fused to pSAK277,ligated to the CaMV35S promoter,to generate PcMYB10-pSAK277 and PcMYB114-pSAK277 constructs.Each of these constructs were transferred intoA.tumefaciensstrain GV3101 using the freeze-thaw method,and incubated for 2–3 days at 28°C.About 10 μL loop of confluent bacterium was resuspended in 10 mL of infiltration buffer (10 mmol L–1MgCl2; 10 mmol L–12-(N-morpholino) ethanesulfonic acid,pH 5.5; 150 μmol L–1acetosyringone) until the OD600reached 0.8–1.0.Bacterial strains containing either PcERF5,PcMYB10,or PcMYB114 constructs were infiltrated or co-infiltrated into green-skinned pear fruits.Fruitlets transformed with the empty vector pSAK277 were used as the negative control.Photoimages were taken 5–7 days following infiltration,and fruits were collected for anthocyanin content measurement and for gene expression analysis.
2.15.Genetic transformation of apple calli
Proliferating calli of applecv.‘Orin’,derived from leaf tissues,were used forAgrobacterium-mediated genetic transformation as previously described by Anetal.(2018).Briefly,PcERF5-pSAK277-OE (overexpression of PcERF5-pSAK277) apple calli were generated by co-cultivating bacterial cells ofA.tumefaciensstrain GV3101 carrying the plasmid PcERF5-pSAK277 with wild-type (WT) apple calli for 30 min.Then,these calli were transferred to a selection medium consisting of Murashige and Skoog (MS) salts,0.5 mg L-12,4-dichlorophenoxyacetic acid (2,4-D),1.0 mg L-16-benyzladenine (6-BA),8 g L-1agrose powder,and supplemented with 250 mg L-1cefotaxime and 100 mg L-1kanamycin.Transgenic apple calli were selected and periodically transferred to a fresh selection culture medium.
For color development assays,transgenic apple calli were transferred to a fresh culture medium,as described above,and maintained in a controlled environment incubator under continuous cool-white light (70 μmol m–2s–1) and 20°C for different time periods.At each of these different time periods,0.5 g of callus tissue was collected,and used for determining anthocyanin accumulation and measurement.
3.Results
3.1.Phenotypic comparisons and anthocyanin contents of pear fruits
In this study,two of the cultivars,‘Bartlett’ (B) and ‘Rosired Bartlett’ (RB),developed white-colored fruit flesh at midmaturity (S1),while the third pear accession,‘Summer Blood Birne’ (SB) developed red-pigmented flesh at midmaturity (S1),and this red pigmentation in the flesh increased at full-maturity (S2) (Fig.1-A).The total anthocyanin content in these fruits showed that there were almost no anthocyanins in the white-fleshed pear cultivars B and RB,while the red-fleshed pear SB accumulated significantly higher levels of anthocyanin at the mid-maturity stage (S1) than those in both white-fleshed cultivars (used as control) and this level increased even higher at full-maturity (S2) (Fig.1-B and C).Overall,anthocyanin accumulation in red-fleshed fruit was significantly higher than that in white-fleshed fruits.Following ultra-high performance liquid chromatography (UPLC) analysis to measure anthocyanin component contents,it was observed that the predominant component of anthocyanin in pear fruit was cyanidin-3-galactoside,which was detected accumulated in red-fleshed fruit (Fig.1-D).Moreover,the level of this anthocyanin component was significantly higher at maturity than at mid-maturity (Fig.1-D).These results indicated that the anthocyanin content of SB was significantly higher than that of B and RB.
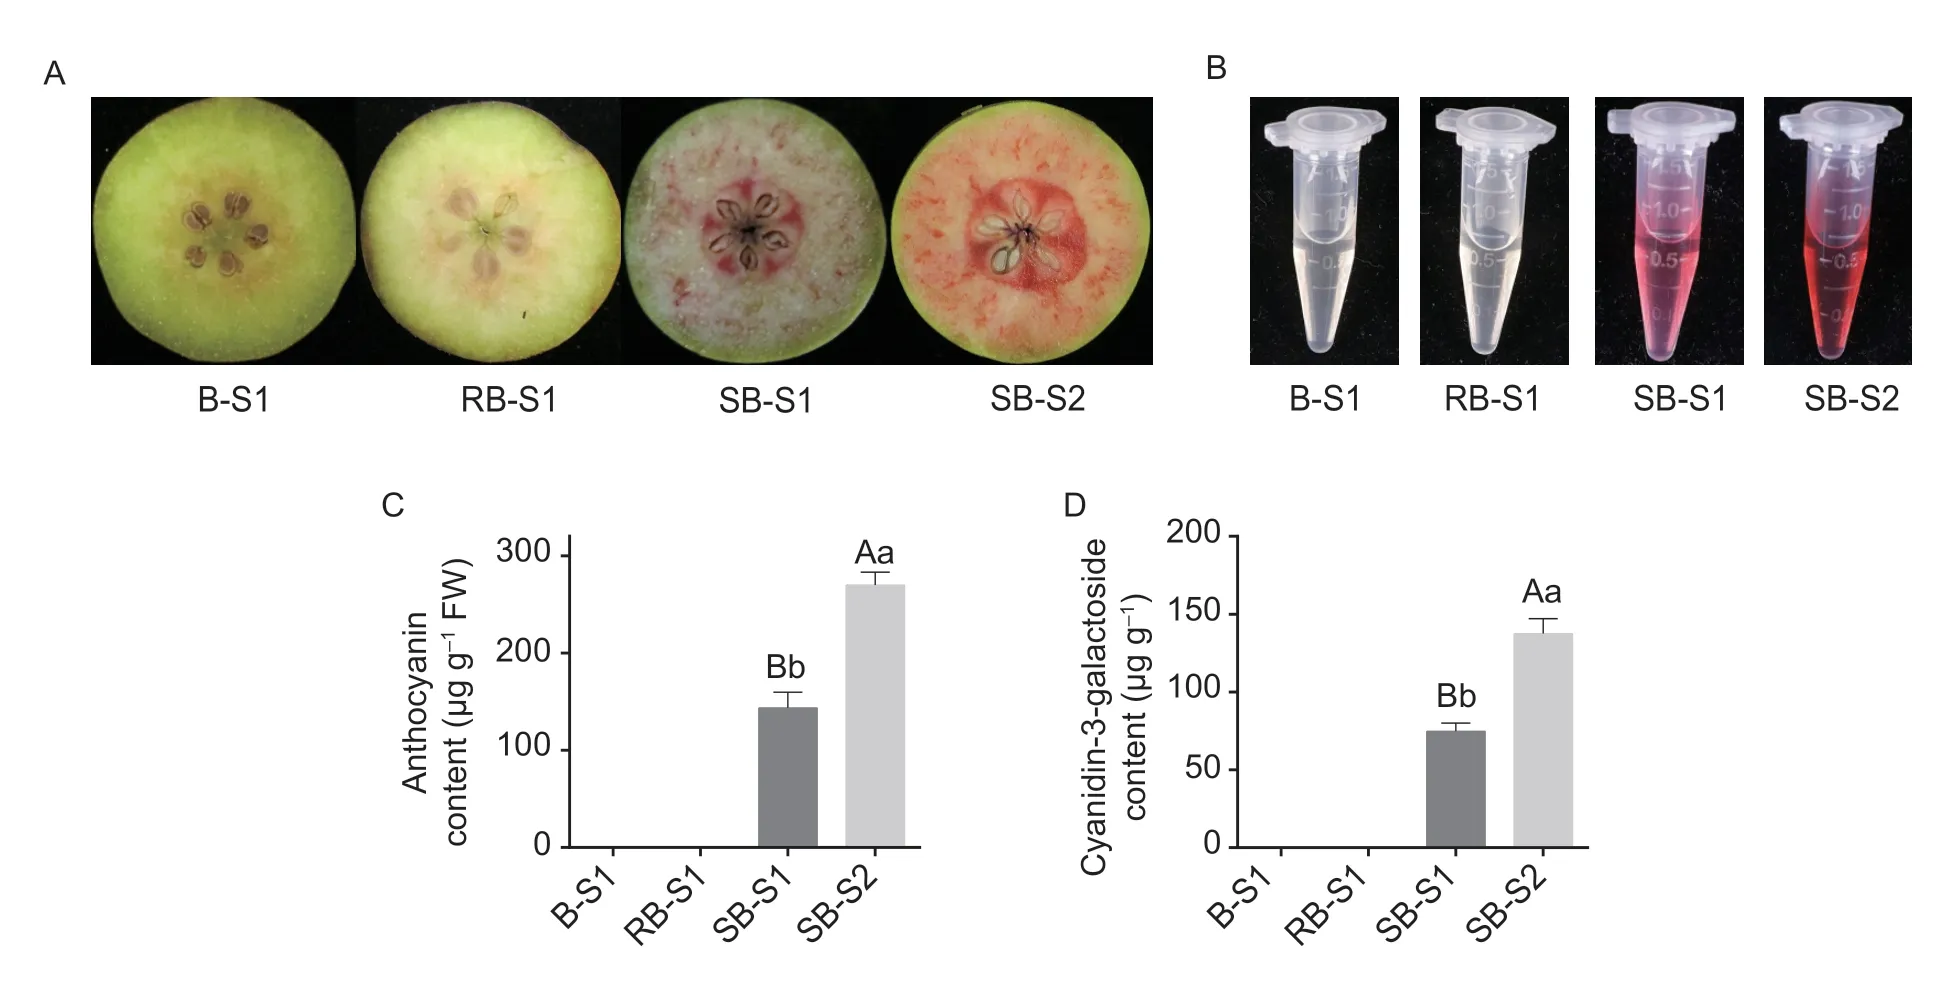
Fig.1 Phenotypic comparisons and anthocyanin contents in three pear accessions.A,the phenotypes of fruits of white-fleshed cvs.‘Bartlett’ (B-S1),‘Rosired Bartlett’ (RB-S1),and the red-fleshed pear ‘Summer Blood Birne’ (SB) at different stages of fruit collection.S1,semi-mature fruit; S2,mature fruit.B,anthocyanin extraction from pear flesh.C,anthocyanin contents in different pears.D,detection of cyanidin-3-galactoside contents as determined by ultra-high performance liquid chromatography (UPLC).Mean comparisons±SD were conducted using least significant difference (LSD) analysis,based on three replications and different letters above the columns indicate significant differences at 1% (uppercase letter) and 5% (lowercase letter) levels of probability.
3.2.Transcriptomic analysis identified candidate genes involved in anthocyanin biosynthesis in redfleshed pear
RNA-seq library construction was conducted using tissues from both white- and red-fleshed fruit,at different stages of maturity.A total of 24 RNA samples were sequenced three times from each maturity stage of each of the three pear cultivars,and about 852 million original reads were obtained,through double-ended sequencing,with an average of 35.48 million reads per sample.Following removal of both low-quality and unknown base reads,as well as of sequenced adapters,each sample retained an average of 32.28 million clean reads,with an average clean read ratio of 90.98% (Appendix B).Overall,a total of 45 217 transcripts were obtained.
To assess the reliability of transcriptome data,12 random genes were selected for RT-qPCR analysis,and it was observed that there was a good correlation between relative expression levels and RPKM values of the corresponding genes (Appendix C).Based on transcriptome analysis,a total of 4 307 and 4 339 genes were significantly up-regulated,while 5 248 and 5 527 genes were significantly down-regulated in B-S1vs.SB-S1 and RB-S1vs.SB-S1,respectively (Fig.2-A).Furthermore,a total of 7 947 common genes were identified as DEGs among these comparative groups,and within this set of common DEGs 3 555 were up-regulated and 4 392 were down-regulated DEGs (Fig.2-B).
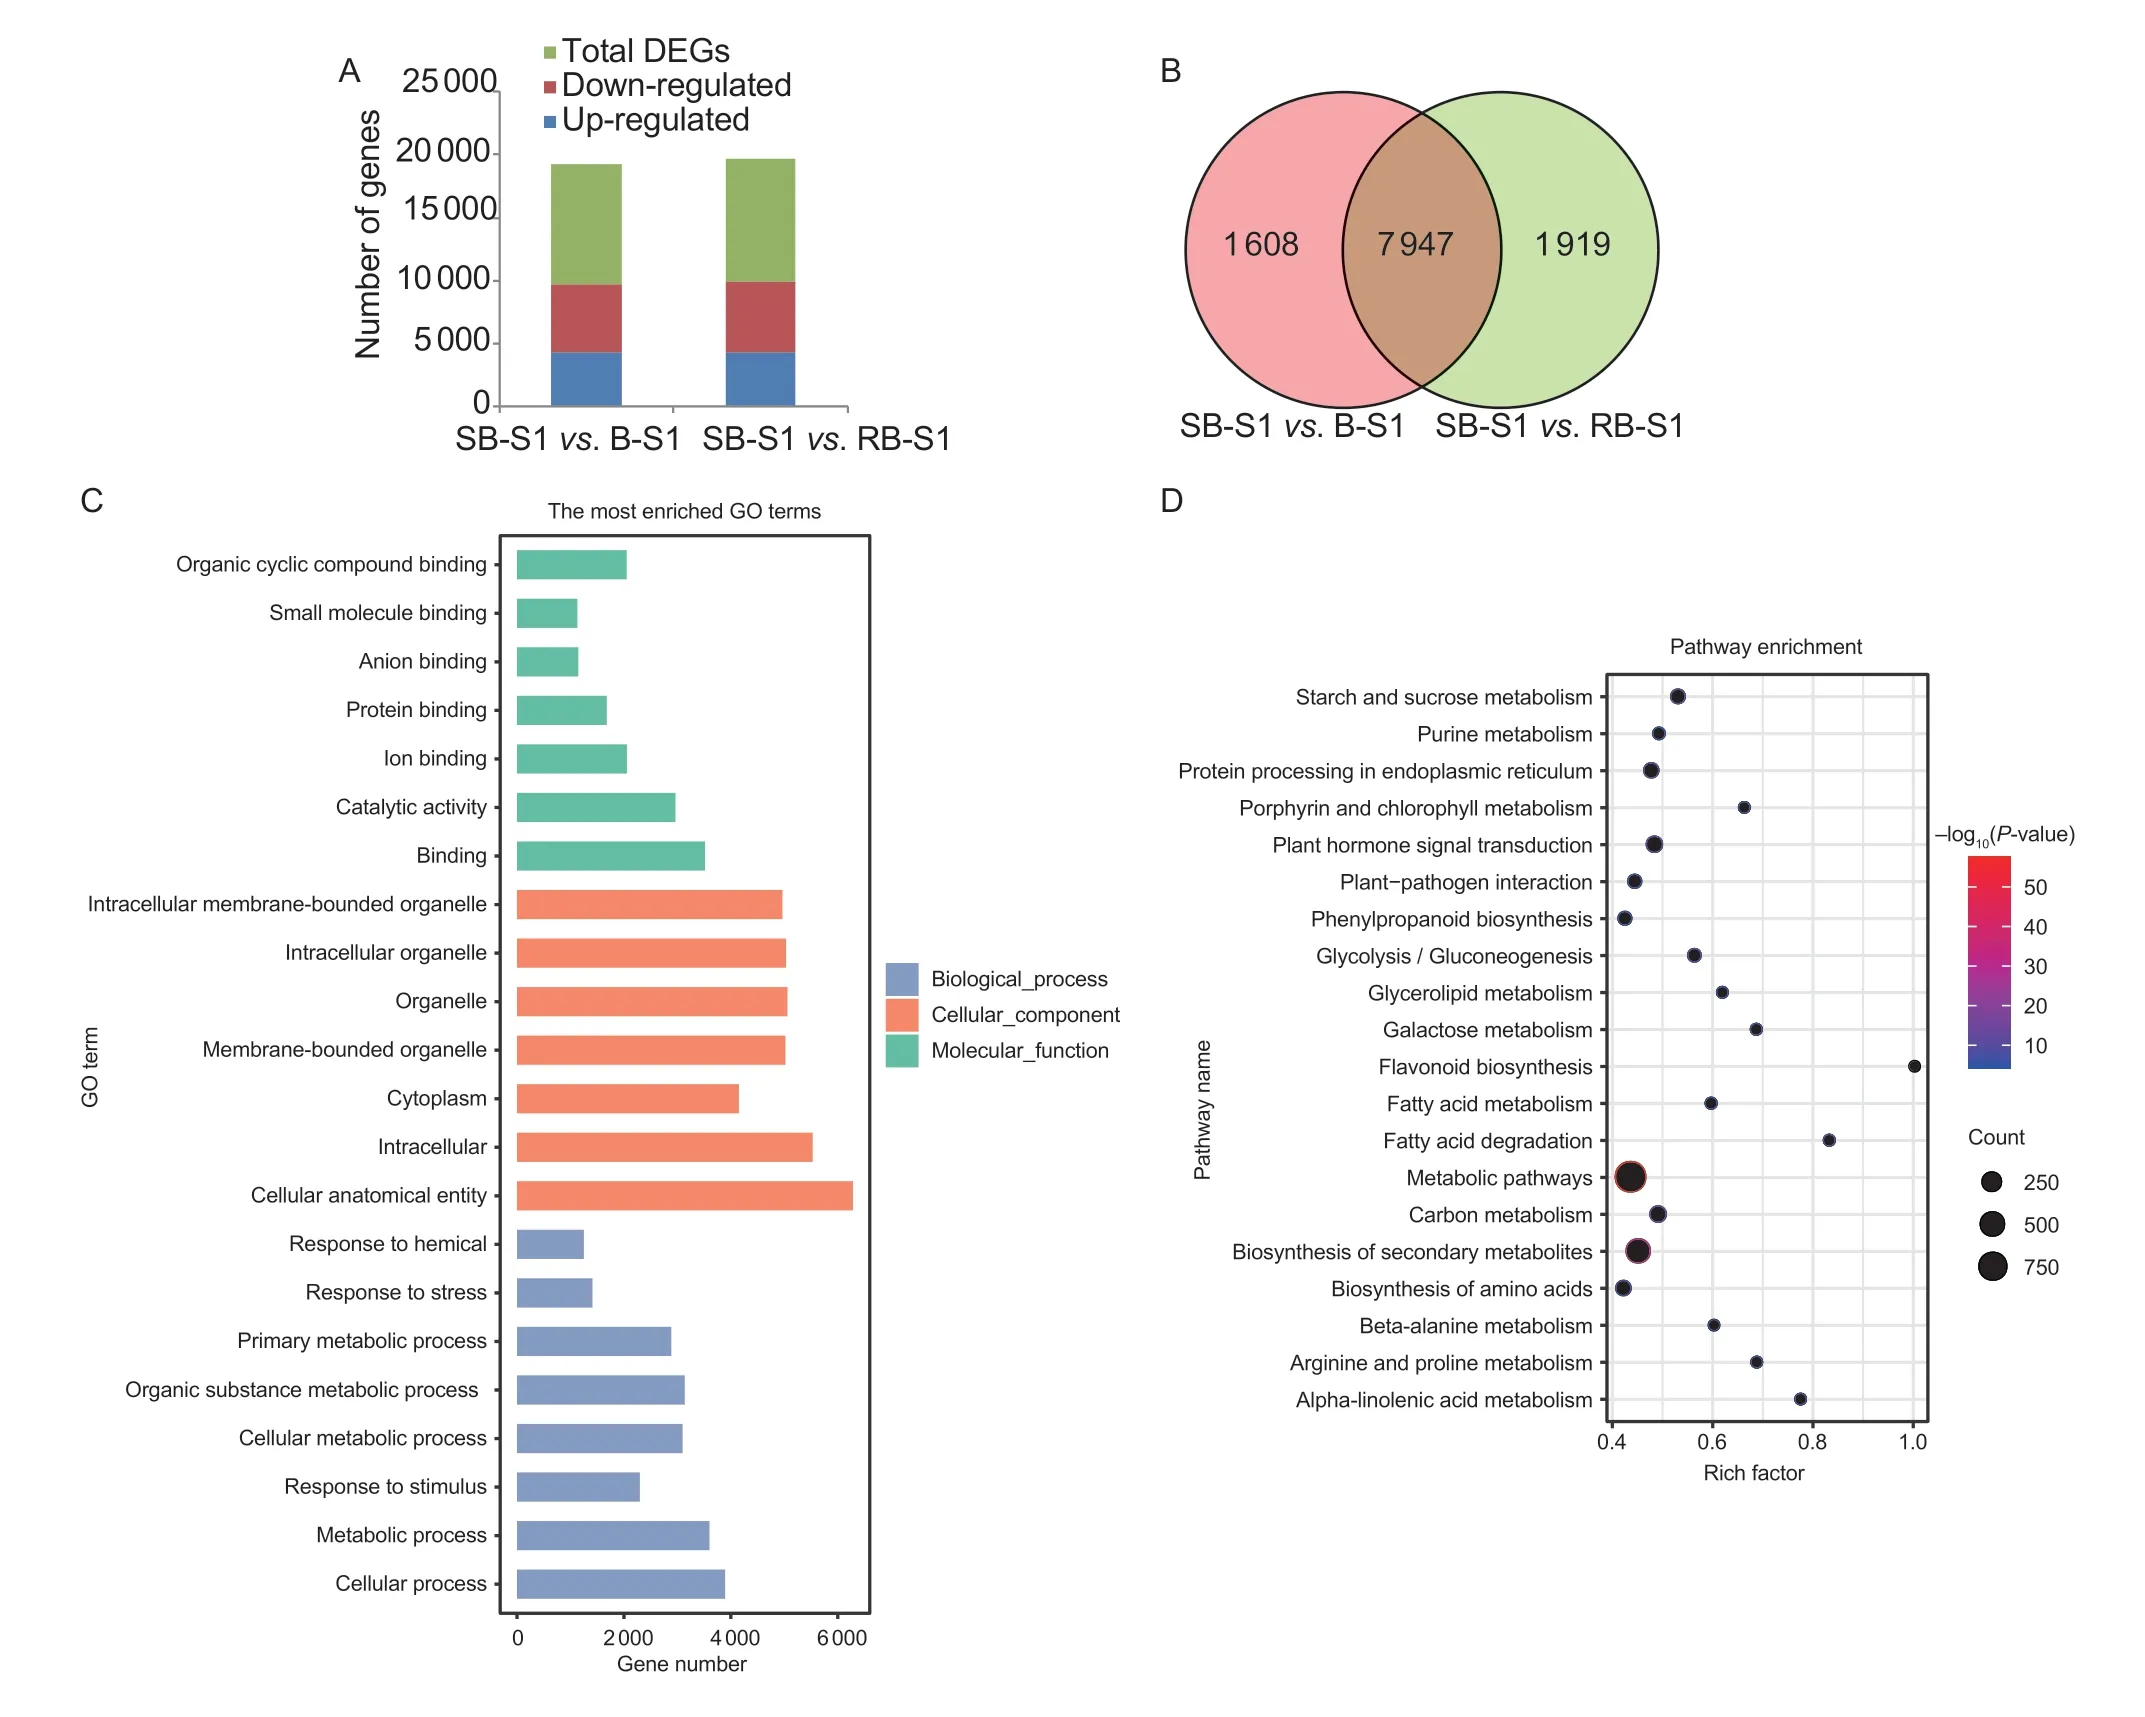
Fig.2 Screening of differentially expressed genes (DEGs) from RNA-sequencing (RNA-seq) data.A,the number of up- and downregulated genes and DEGs in two comparison groups,SB-S1 vs.B-S1 and SB-S1 vs.RB-S1.B,the number of co-differentially expressed genes.C,the histogram of gene ontology (GO) classification enrichment analysis.D,the bubble diagram of kyoto encyclopedia of genes and genomes (KEGG) pathway enrichment analysis.The size of the bubbles indicates the number of genes enriched to the pathway.The colors represent the significance.The red color corresponds to a higher –log10(P-value) and higher significance,while the blue color corresponds to a lower –log10(P-value) and lower significance.
The GO analysis revealed that these 7 947 common DEGs were classified into three functional categories.Among these,the top three terms in each of the categories were ‘binding’,‘catalytic activity’,and ‘organic cyclic compound binding’ in the ‘molecular function’ category; ‘cellular process’,‘metabolic process’,and ‘organic substance metabolic process’ in the ‘biological process’ category; ‘cellular anatomical entity’,‘intracellular’,and ‘organelle’ in the ‘cellular component’ category (Fig.2-C; Appendix D).These candidate genes included previously reported transcription factors (TFs) related to anthocyanin biosynthesis,such as AP2/ERF,MADS,MYB,WD40,and bHLH; structural genes such asUFGTin the anthocyanin biosynthetic pathway; and the GST related to anthocyanin transport.The KEGG enrichment analysis further revealed that these genes were mainly enriched in three different pathways,including the metabolic pathway,the biosynthesis of secondary metabolites,and the plant hormone signal transduction (Fig.2-D).
Among 3 555 common up-regulated genes,1 349 genes had higher RPKM values in SB-S2 than that in SB-S1,and demonstrated similar trends with changes of anthocyanin contents in red flesh pear.Upon further detailed analysis of these 1 349 genes,eightERFgenes were identified,of which sevenERFgenes had RPKM values less than 11,while only a single geneERFhad a RPKM value that was significantly different in white-fleshedvs.red-fleshed pears (Appendix E).Therefore,this latter gene was deemed as a candidate gene that might be involved in anthocyanin biosynthesis of red-fleshed pear.
3.3.Expression profile of a candidate ERF gene correlated with anthocyanin biosynthetic related genes
To investigate whether the candidateERFgene was involved in anthocyanin biosynthesis,a correlation analysis was conducted between theERFgene and several anthocyanin biosynthetic genes,including twoDFRgenes,12ANSgenes,and 12UFGTgenes,all found to be up-regulated in the red-fleshed pear based on transcriptome data (Appendix F).It was observed that the expression level ofERFwas highly correlated with expression levels of all these anthocyanin biosynthetic genes,includingDFR(r2=0.8940 and 0.9300),ANS(r2ranging between 0.6736 to 0.9898),andUFGT(r2ranging between 0.7794 to 0.9994) genes.Moreover,the expression level of theERFin red-fleshed pear SB were higher than those in white-fleshed pears B and RB,with a significantly high correlation coefficient of 0.9984 (Appendix G).
Subsequently,expression patterns of anthocyanin biosynthesis-related TFs,includingPcMYB10andPcMYB114,were analyzed (Appendix G).It was observed that this candidateERFwas highly co-expressed with these anthocyanin biosynthesis-related TFs,with correlation coefficients of 0.6598 and 0.8914,respectively (Appendix H).This suggested that there were likely associations between this candidateERFand each ofPcMYB10andPcMYB114.The above findings further demonstrated that this candidateERFgene might be involved in anthocyanin biosynthesis of red-fleshed pear.
3.4.PcERF5 was a transcription factor localized in the nucleus
The CDS of the above candidateERFgene was cloned from fruit flesh of SB pear.Homology and blast search in NCBI revealed that this candidateERFgene had the highest degree of similarity withPbrERF5(XM_009335421.2),fromP.bretschneideri; therefore,this gene was designated asPcERF5(P.communisERF5).Sequence analysis revealed thatPcERF5,localized on chromosome 4,had a full-length of 984 bp,along with a complete ORF (Fig.3-A).Furthermore,this gene encoded a protein of 327 amino acid residues with an isoelectric point of 5.88 and a calculated molecular weight of 36.9 kDa.Following phylogenetic analysis,it was observed that PcERF5 was clustered into the same group with PbrERF5,as they shared 97.86% protein sequence identity (Fig.3-B; Appendix I).Multiple sequence alignments showed that PcERF5 had only a single AP2/ERF domain (Fig.3-C).
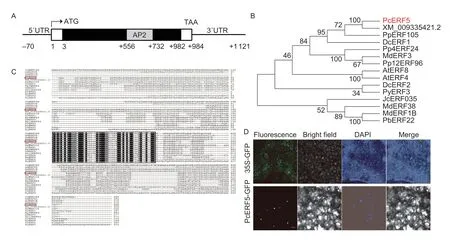
Fig.3 Structure of the PcERF5 genomic sequence,protein sequence alignments and phylogenetic analysis of previously reported ERFs associted with anthocyanin biosynthesis,and subcellular localization of PcERF5.A,the coding sequence (CDS) length of PcERF5 was 984 bp.The AP2 domain was shown as a rectangular grey box.B,phylogenic relationship of the identified ERF genes in different species.PcERF5 (red font) was clustered into the same clade along with PpERF105.C,alignment of protein sequences of previously reported ERFs in different plant species,including Arabidopsis thaliana AtERF4 (NP_188139.1),AtERF8 (NP_175725.1); Jatropha curcas JcERF035 (XP_012093083.1); Malus×domestica MdERF1B (XP_008368126.2),MdERF3 (MDP0000787281),and MdERF38 (MDP0000153436); Daucus carota DcERF1 (BAF75651.1),DcERF2 (BAF75652.1); Pyrus bretschenideri PbERF22 (XP_009357206.1); Pyrus pyrifolia Pp4ERF24 (XP_009333695.1),Pp12ERF96 (XP_018505750.1); and Pyrus pyrifolia PyERF3 (ASY06613.1).The protein domain was highlighted with a black box and PcERF5 was marked with a red rectangle as shown in the figure.D,subcellular localization of PcERF5.Epidermal cells of young leaves of Nicotiana benthamiana were transiently transformed with constructs containing either control GFP alone or a fusion protein PcERF5-GFP.Scale bars,20 μm.
To determine the subcellular localization of PcERF5,the fusion protein PcERF5-GFP and the control GFP were separately and transiently expressed in epidermal cells of tobacco leaves.It was observed that the control GFP was distributed within whole cells,while the fusion protein PcERF5-GFP was detected exclusively in the nucleus (Fig.3-D).These results indicated that PcERF5 was a typical ERF transcription factor protein,and it was localized in the nucleus.
3.5.Overexpression of PcERF5 promoted anthocyanin accumulation in pear fruits
To investigate the role ofPcERF5in anthocyanin accumulation of pear,we generatedPcERF5overexpres- sion construct PcERF5-pSAK277.The construct and empty vector pSAK277 were separately transferred into mature fruit of pearcv.‘Zaosu’ using agroinfiltration.Stronger pigmentation at the site injected withPcERF5overexpression construct was observed than the site injected with the empty control vector (Fig.4-A),suggesting thatPcERF5alone could promote anthocyanin accumulation.Furthermore,the ratio of a* to b* in pigmentation areas of pear fruit transformed withPcERF5,as determined by a chromometer (Minoltachromameter,Japan),was significantly higher than that of the ratio of pear fruit transformed with empty vector (Fig.4-B).Compared with the empty vector injection sites,overexpression ofPcERF5significantly increased the anthocyanin contents (Fig.4-C).The expression level ofPcERF5increased significantly to confirm that it was successfully transformed into pearcv.‘Zaosu’ (Fig.4-D).In addition,overexpression ofPcERF5resulted in higher transcription levels ofPyCHS,PyCHI,PyF3H,PyDFR,PyANS,andPyUFGTas compared with the control (Fig.4-E).Taken together,these findings suggested thatPcERF5played a positive role in the regulation of anthocyanin biosynthesis in pear fruit flesh.
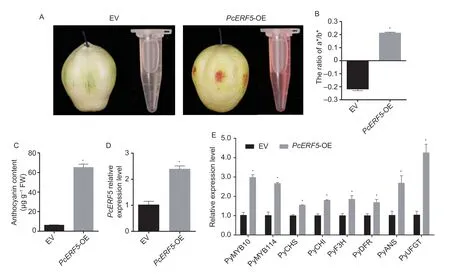
Fig.4 Transient transformation of PcERF5 in ‘Zaosu’ pear.A,the phenotype of ‘Zaosu’ following infiltration.EV means empty vector.B,measurements of red-colored regions in pear fruits using a Minolta chromameter.The changes of a*/b* ratios,from negative to positive,correspond to skin color changes from green to red.C,anthocyanin content of PcERF5-OE and EV from ‘Zaosu’ pear skin.D,expression level analysis of PcERF5 in pear skin using real-time quantitative PCR (RT-qPCR).E,expression levels of selected anthocyanin biosynthetic genes and PyMYB10/114 using RT-qPCR.Bars correspond to means±SD of three independent biological replicates.* denotes significance at 5% level of probability.
3.6.Overexpression of PcERF5 in apple calli induced anthocyanin biosynthesis
To further confirm the function ofPcERF5in anthocyanin accumulation,genetic transformation ofPcERF5was performed in apple calli.A total of five independent transgenic lines,L1 to L5,were generated,and relative expression levels ofPcERF5in WT and transgenic lines were analyzed.Among these lines,L1 and L5 exhibited significantly higherPcERF5expression level compared with that of the control,and therefore,these were selected for phenotype observation (Fig.5-A).Under UV-B light along with a low temperature treatment,red color pigmentation was visible in apple calli of both L1 and L5,while the color of WT apple calli remained white (Fig.5-B and C).The anthocyanin content in transgenic apple calli L1 and L5 was significantly higher than that of WT calli (Fig.5-D).In addition,RT-qPCR analysis revealed that expression levels of flavonoid pathway genes,includingMdCHS,MdCHI,MdF3H,MdDFR,MdANS,andMdUFGT,in both L1 and L5 were up-regulated (Fig.5-E).These findings demonstrated that PcERF5 was a positive regulator involved in promoting anthocyanin biosynthesis by up-regulating expression levels of structural genes in the anthocyanin/flavonoid biosynthetic pathway.
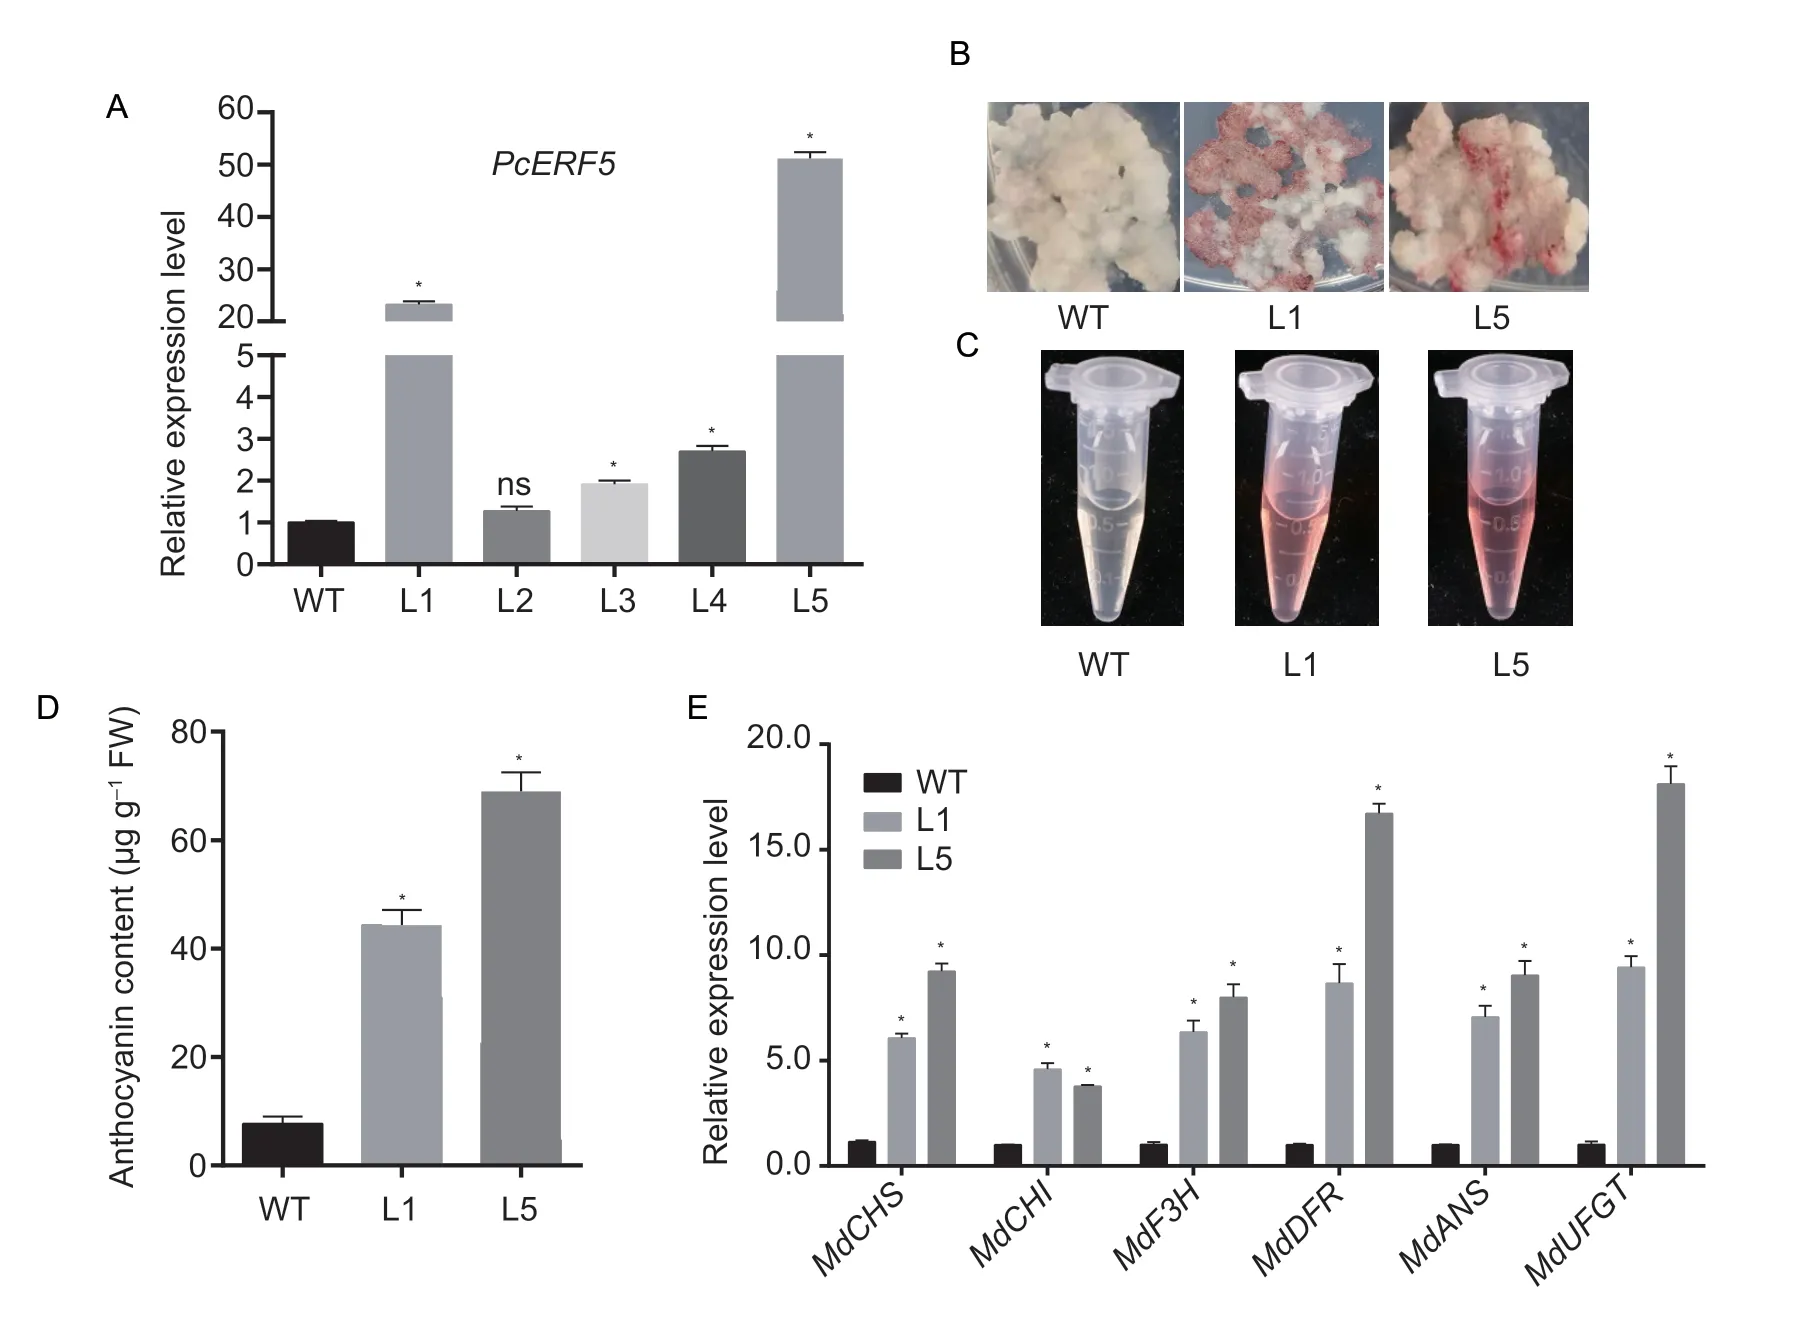
Fig.5 Overexpression of PcERF5 promoted anthocyanin accumulation in apple calli.A,real-time quantitative PCR (RT-qPCR) analysis of transcript levels of PcERF5 in transgenic apple calli lines (L1 to L5) and WT; MdActin was used as a housekeeping gene for Malus×domestica to normalize expression levels.B,phenotypes of two independent PcERF5 transgenic apple calli lines (L1 and L5) and WT when visualized under UV-B light and at a low temperature.C,anthocyanin extraction from two independent transgenic apple calli lines (L1 and L5) and WT.D,anthocyanin content detection of transgenic apple calli and WT.E,expression levels of anthocyanin biosynthetic genes in WT and transgenic calli.Bars correspond to mean±SD of three independent biological replicates.* denotes significance at 5% level of probability; ns,not significant.
3.7.PcERF5 interacted with PcMYB10,but not with PcMYB114
In order to identify the transactivation activity ofPcERF5,full-length and truncated CDS ofPcERF5were independently introduced and fused into the pGBKT7 vector to generate the following constructs,PcERF5-pGBKT7,PcERF-I-pGBKT7,PcERF-II-pGBKT7,PcERFIII-pGBKT7,and PcERF-IV-pGBKT7.Each of these plasmids were transferred into competent cells of the yeast strain AH109.Yeast cells transformed withPcERF5grew normally,not only on the SD/–Trp medium,but also on the SD/–Trp/–His/–Ade selection medium (Fig.6-A).This indicated that PcERF5 had a transactivation activity.In contrast,yeast cells transformed with truncated CDS ofPcERF5grew normally on SD/–Trp media,but cannot grow on SD/–Trp/–His/–Ade selection media (Fig.6-A).This indicated that truncated PcERF5 CDS did not have transactivation activities.
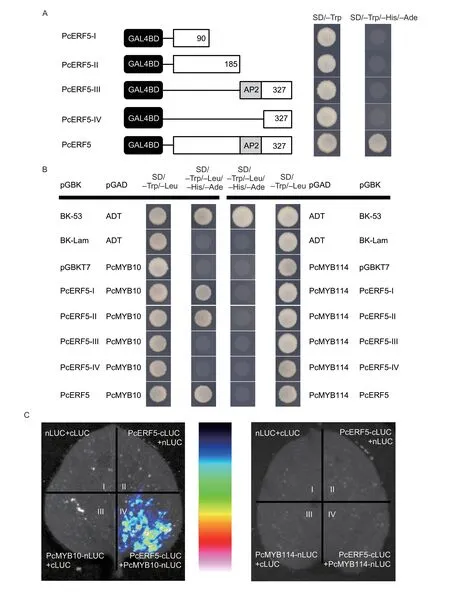
Fig.6 Investigation of PcERF5 and PcMYB10/PcMYB114 interaction in yeast two-hybrid (Y2H) system and luciferase complementation imaging (LCI) assay.A,in vivo transactivation activity of PcERF5.B,in vivo interactions of the full-length and different truncated coding sequence (CDS) of PcERF5 with PcMYB10 and PcMYB114 using Y2H assay.Each of fragment of PcERF5 was fused into the GAL4 DNA binding domain in the pGBKT7 vector and transformed into yeast strain AH109.Yeast transformants were plated on SD/–Trp or SD/–Trp/–His/–Ade plates,and incubated at 30°C for 3 days to assay transcriptional activity.The co-transformation of pGBKT7-53 and pGADT7-T or pGBKT7-Lam and pGADT7-T were used as positive and negative controls,respectively.C,LCI assay showing the interaction of PcERF5,PcMYB10 and PcMYB114 in Nicotiana benthamiana cells containing different pairs of constructs.Luminescent images were captured using a cooled charge-coupled device imaging apparatus.
To explore the relationship between PcERF5 and each of PcMYB10 and PcMYB114,a Y2H experiment was conducted.The full-length and truncated CDS ofPcERF5were cloned into pGBKT7,while those of each ofPcMYB10andPcMYB114,were cloned and fused independently into pGADT7.It was observed that regardless of the length of the coding sequence ofPcERF5; i.e.,full sequence or truncated sequences includingPcERF-I,PcERF-II,PcERF-III,andPcERF-IV,yeast cells could grow normally on SD/–Trp/–Leu media when independently co-transformed with PcMYB10 (Fig.6-B).Moreover,the following co-transformants of PcERF5-pGBKT7 and PcMYB10-pGADT7; PcERF5-IpGBKT7 and PcMYB10-pGADT7; PcERF5-II-pGBKT7 and PcMYB10-pGADT7 could also grow normally on SD/–Trp/–Leu/–His/–Ade selection media (Fig.6-B).This finding combined with our above finding that PcERF-I and PcERF-II did not have transcriptional activation further confirmed that PcERF5 interacted with PcMYB10,and that interaction regions lied within the first segments of the coding sequences.On the other hand,regardless of the length of the sequence ofPcERF5; i.e.,full-length or truncated sequencesPcERF-I,PcERF-II,PcERF-III,andPcERF-IV,yeast cells could grow normally on SD/–Trp/–Leu media when they were independently co-transformed with PcMYB114 (Fig.6-B).However,when these cotransformed yeast cells grew on SD/–Trp/–Leu/–His/–Ade selection media,they demonstrated growth defects; thus,indicating there was no interaction between PcERF5 and PcMYB114 (Fig.6-B).
In order to further confirm the interaction between PcEFR5 and PcMYB10 or PcMYB114,BiFC and LCI assays were performed in tobacco leaves.LCI assay showed that strong LUC luminescence could be detected in the co-transformation of PcERF5-cLUC and PcMYB10-nLUC,whereas no signals were detected in the cotransformation of PcERF5-cLUC and PcMYB114-nLUC (Fig.6-C).Furthermore,BiFC assay revealed that green fluorescence signals of the co-transformation of PcERF5-YCE and PcMYB10-YNE were detected specifically in nuclei of theNicotianabenthamianaleaves (Appendix J).In contrast,no fluorescence was detected when PcERF5-YCE and PcMYB114-YNE were co-transformed (Appendix J).Based on the above three assays,it can be confirmed that PcERF5 interacted with PcMYB10,but not with PcMYB114.
3.8.The PcERF5 significantly activated promoters of PcMYB10,PcMYB114,and LBGs
In order to determine the regulatory relationship between PcERF5 and genes involved in anthocyanin biosynthesis,we cloned the promoter regions of thePcMYB10,PcMYB114and LBGs into the pGreenII 0800-LUC vector (Fig.7-A).A dual-luciferase reporter assay indicated that PcERF5 could activate the promoters ofMYBgenes (PcMYB10andPcMYB114) and anthocyanin biosynthetic genesPcDFR,PcANS,andPcUFGT(Fig.7-B).In addition,PcMYB10 also demonstrated a higher transactivation with the promoter of these five genes (Fig.7-B).These results showed that PcERF5 alone recognized the promoters of anthocyanin biosynthetic genes to activate their transcription.Furthermore,when PcERF5 and PcMYB10 were co-transformed into young tobacco leaves,it was observed that activation of the promoters ofPcDFR,PcANS,andPcUFGTwas significantly enhanced compared with transformation PcERF5 alone (Fig.7-B).All of these results indicated that the protein complex PcERF5-PcMYB10 enhanced the transcriptional activation of PcERF5 on its target genes.
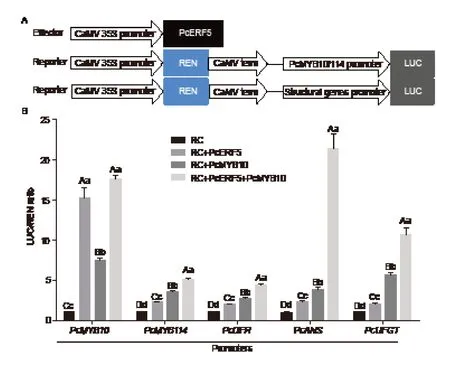
Fig.7 Verification of activation of PcERF5 using a dual-luciferase assay.A,diagrams of the effector and reporter constructs used for the dual-luciferase assay.B,the ratio of LUC to REN showing the activity of PcERF5 and PcERF5 together with PcMYB10 on PcMYB10,PcMYB114,PcDFR,PcANS and PcUFGT promoters after transformation of young Nicotiana benthamiana leaves.RC,reporter gene construct; LUC,firefly luciferase; REN,renilla luciferase; DFR,dihydroflavonol 4-reductase; ANS,anthocyanidin synthase; UFGT,UDP-glucose:flavonoid 3-O-glucosyl transferase.Mean comparisons±SD were conducted using least significant difference (LSD) analysis,based on three replications and different letters above the columns indicate significant differences at 1% (uppercase letter) and 5% (lowercase letter) levels of probability.
4.Discussion
The MYB family of TFs consists of a large number of genes that are widely involved in various processes during plant growth and development,and these have been identified and characterized in several plant species (Matusetal.2008; Dubosetal.2010; Felleretal.2011).Furthermore,various studies have been undertaken to investigate the regulatory roles of these MYB TFs in various plant species (Espleyetal.2007; Zhouetal.2014; Liuetal.2017; Wangetal.2017; Yaoetal.2017).Among these TFs,MYB10 has been identified and investigated in apple (Espleyetal.2007).It was observed that overexpression ofMYB10can significantly enhance anthocyanin accumulation in transgenic apple seedlings.Furthermore,it was found that five repetitive 23-bp motifs in the promoter region ofMYB10were responsible for its transcriptional activation,and served as the main driving force for an increase inMYB10transcriptional abundance and anthocyanin synthesis (Espleyetal.2007,2009).Later on,MYB10 was identified and characterized in pear (Fengetal.2010,2015).It was reported that the interaction of MYB10 with bHLH promoted the biosynthesis of anthocyanin in pear.Subsequently,MYB114 was identified in pear (Yaoetal.2017).This discovery not only validated the hypothesis that there were various MYB genes,other than MYB10,involved in the regulation of anthocyanin biosynthesis in the pear pericarp (Dondinietal.2008; Pierantonietal.2010),but also put forward,for the first time,a new transcriptional regulation complex ERF-MYB-bHLH,besides that of the MYB-bHLHL-WD40 (MBW).
Early studies have investigated the roles of TFs,in particular of MYB10,on anthocyanin content and accumulation in red color pigmentation of red-skinned fruits,including those found in some pear cultivars (Zhangetal.2011; Yuetal.2012).However,there is little knowledge of the role of TFs in red-fleshed pear cultivars,as this is another highly desirable trait of economic importance.In this study,efforts were undertaken to investigate and delineate the regulatory role of TFs in red color pigmentation in the flesh of pear fruits.Following transcriptome data of three pear accessions,including one red-fleshed fruit and two white-fleshed pears,1 349 candidate genes that were differentially expressed among these genotypes were identified.Among these candidate genes,a single gene,PcERF5,involved in the anthocyanin biosynthetic pathway and deemed likely to be responsible for the red-fleshed color in pear was identified and characterized.In order to delineate the regulatory mechanism of anthocyanin accumulation and content of the red-fleshed trait,a yeast two-hybrid analysis,a bimolecular fluorescence complementation assay,and a luciferase assay were conducted.These experiments demonstrated that there was an active interaction between PcERF5 and PcMYB10 (Fig.6; Appendix J); thus,suggesting that PcERF5 might be involved in the synthesis and regulation of anthocyanins in red-fleshed pear.There are many reports on ERF transcription factors that regulate anthocyanin biosynthesis in Oriental pear.PyERF3,located on chromosome 5,was the first reported transcription factor involved in anthocyanin synthesis in pear.It interacted with PyMYB114 and PybHLH3 to form ERF3-MYB114-bHLH3 transcription regulatory complex,which jointly regulated the coloration of redskinned pear (Yaoetal.2017).Subsequently,Pp4ERF24located on chromosome 4,PpERF105andPp12ERF96both located on chromosome 12 andPbERF22gene located on chromosome 15 were found and participated in anthocyanin biosynthesis positively or negatively (Nietal.2019,2021; Wuetal.2020).In this study,PcERF5was identified by transcriptomic analysis and located on chromosome 4.It had the highest sequence similarity with PbrERF5 (XM_009335421.2),and the phylogenetic tree showed that PcERF5 and its homologous genes were clustered with PpERF105 which negatively regulated anthocyanin biosynthesis (Fig.3-B).However,unlike PpERF105,PcERF5 was involved in the biosynthesis of pear anthocyanin as a positive regulatory factor.
It is known that bothPcMYB10andPcMYB114belong to theMYBgene family and both have R2R3 domains (Espleyetal.2007; Yaoetal.2017).In this study,the truncated yeast two-hybrid experiment proved that the interaction between PcERF5 and PcMYB10 was in the range of 1–90 amino acids (Fig.6-B).Through amino acid sequence alignment,it was found that the homology of the first 90 amino acid sequences between PcMYB10 and PcMYB114 was only 59.60%.The difference in sequence will lead to the difference in structure,which may explain why PcERF5 interacted with PcMYB10 but not with PcMYB114.This interaction pattern was also reported in apple.MdMYB1 showed the highest sequence homology with PcMYB10.Anetal.(2020) found that MdERF38 interacted with MdMYB1 under drought conditions,thus promoting anthocyanin biosynthesis.Different from the research result of Nietal.(2019),it was found that both Pp4ERF24 and Pp12ERF96 interacted with MYB114,not with MYB10.
It has been previously reported thatERFgenes either promote (Wuetal.2020) or inhibit (Nietal.2021) anthocyanin biosynthesis by regulating relatedMYBgenes.In this study,dual-luciferase assay showed that PcERF5 activated the promoter activity of each ofPcMYB10andPcMYB114(Fig.7-B).This finding indicated that bothPcMYB10andPcMYB114were involved in PcERF5-mediated anthocyanin biosynthesis.The same result was also found in apple (Anetal.2020).A transient transformation experiment demonstrated that whenPcERF5was overexpressed,expression ofPcMYB10andPcMYB114significantly increased compared with their respective controls (Fig.4-E).This suggested that whenPcERF5alone was overexpressed,increased expression ofPcMYB10 andPcMYB114was the result of the direct regulation ofPcERF5.Nietal.(2019) also found the same result.When Pp4ERF24 or Pp12ERF96 alone transiently infected ‘Zaosu’ pear,the expression levels ofPpMYB10andPpMYB114increased significantly.
We previously reported that the ERF-MYB-bHLH protein complex was formed to regulate anthocyanin biosynthesis in red-skinned pear (Yaoetal.2017).In Rosaceae species,including pear,apple,peach,other various stone fruits,among others,this interaction model has been discovered and well verified (Zhangetal.2018; Nietal.2019).The interaction between PcERF5 and PcMYB10 was also discovered in our research (Fig.6; Appendix J).Previous report showed that MYB10 promoted anthocyanin biosynthesis by directly activating expression ofDFRandUFGT(Yaoetal.2017).In this study,we confirmed this result (Fig.7).Besides,it was found that PcERF5 also exhibited the same function (Figs.4,5 and 7).Considering the interaction between PcERF5 and PcMYB10 and that they were both positive regulators in anthocyanin biosynthesis,we speculated that the co-existence may further enhance the activating expression of related genes.To verify this hypothesis,a dual-luciferase experiment was carried out.It was found that the interaction not only enhanced the activation onPcMYB10andPcMYB114,but also enhanced the activation on promoters of structural anthocyanin genes,includingPcDFR,PcANS,andPcUFGT(Fig.7-B).This finding was different from Nietal.(2019).Although both Pp4ERF24 and Pp12ERF96 interacted with PpMYB114,they promoted anthocyanin biosynthesis by enhancing the interaction between PpMYB114 and PpbHLH3 and then activating the expression ofUFGT.The above results indicated that the molecular mechanism of differentERFgenes in regulating anthocyanin biosynthesis was different.Taken together,these findings above suggested thatPcERF5regulated anthocyanin biosynthesis by different regulatory pathways.The same with the complexity of the regulatory mechanism underlying anthocyanin biosynthesis in pear skin coloration,the mechanism of anthocyanin biosynthesis mediated by PcERF5 in redfleshed pear also exhibited a complex network.
It has been reported thatERFgenes can regulate downstream target genes (Chakravarthyetal.2003) by directly binding to GCC-box or DRE elements,but they are not the only binding elements.ERFgenes can also bind to othercis-acting elements such as VWRE,CE1,and as-1 to participate in the regulation of target genes (Sasakietal.2007; Wuetal.2008).In this study,PcERF5 was not only found to directly bind to the promoters ofPcMYB10andPcMYB114,but also can activate the promoters of downstream genes in the anthocyanin biosynthetic pathway ofPcDFR,PcANS,andPcUFGT(Fig.7-B).Following cloning andcis-acting element analysis of promoters ofPcMYB10,PcMYB114,PcDFR,PcANS,andPcUFGT,acis-acting element DRE1 (ACCGAGA) was detected in the promoter ofPcMYB10and an as-1 (TGACG) was detected in the promoters ofPcMYB114,PcDFR,andPcANS.Both DRE1 (ACCGAGA) and as-1 (TGACG)cis-acting elements were also found in the promoter ofPcUFGT.Based on these findings,it was suggested thatPcERF5promoted anthocyanin biosynthesis by binding to differentcis-acting elements; however,additional studies should be conducted to further verify this observation.
5.Conclusion
In this research,PcERF5was screened from transcriptome data and was confirmed to play a positive role in regulating anthocyanin accumulation by genetic transformation in both pear skin and apple calli.Our findings suggested that PcERF5 functioned as a transcriptional activator in regulating anthocyanin biosynthesis by different regulatory pathways,which provides new insights into the regulatory mechanism of anthocyanin biosynthesis in pear.
Acknowledgements
This work was funded by the National Natural Science Foundation of China (31820103012),the earmarked fund for China Agriculture Research System (CARS-28),and the earmarked fund for Jiangsu Agricultural Industry Technology System,China (JATS[2022]454).We thank the Bioinformatics Center of Nanjing Agricultural University,China for providing the high-performance computing platforms.
Declaration of competing interest
The authors declare that they have no conflict of interest.
Appendicesassociated with this paper are available on https://doi.org/10.1016/j.jia.2023.07.007
杂志排行
Journal of Integrative Agriculture的其它文章
- Combining nitrogen effects and metabolomics to reveal the response mechanisms to nitrogen stress and the potential for nitrogen reduction in maize
- Natural variations and geographical distributions of seed carotenoids and chlorophylls in 1 167 Chinese soybean accessions
- Carbon sequestration rate,nitrogen use efficiency and rice yield responses to long-term substitution of chemical fertilizer by organic manure in a rice–rice cropping system
- ldentification and epitope mapping of anti-p72 single-chain antibody against African swine fever virus based on phage display antibody library
- Dissecting the genetic basis of grain color and pre-harvest sprouting resistance in common wheat by association analysis
- Core collection construction of tea plant germplasm in Anhui Province based on genetic diversity analysis using simple sequence repeat markers
