Disruption prediction based on fusion feature extractor on J-TEXT
2023-09-05WeiZheng郑玮FengmingXue薛凤鸣ZhongyongChen陈忠勇ChengshuoShen沈呈硕XinkunAi艾鑫坤YuZhong钟昱NengchaoWang王能超MingZhang张明YonghuaDing丁永华ZhipengChen陈志鹏ZhoujunYang杨州军andYuanPan潘垣
Wei Zheng(郑玮), Fengming Xue(薛凤鸣),2, Zhongyong Chen(陈忠勇),†, Chengshuo Shen(沈呈硕),Xinkun Ai(艾鑫坤), Yu Zhong(钟昱), Nengchao Wang(王能超), Ming Zhang(张明),Yonghua Ding(丁永华), Zhipeng Chen(陈志鹏), Zhoujun Yang(杨州军), and Yuan Pan(潘垣)
1International Joint Research Laboratory of Magnetic Confinement Fusion and Plasma Physics,State Key Laboratory of Advanced Electromagnetic Engineering and Technology,School of Electrical and Electronic Engineering,Huazhong University of Science and Technology,Wuhan 430074,China
2Institute of Artificial Intelligence,Huazhong University of Science and Technology,Wuhan 430074,China
Keywords: feature extractor,disruption prediction,deep learning,tokamak diagnostics
1.Introduction
Disruption is a sudden termination of the plasma current that will terminate a magnetically confined plasma.Disruption will also result in large heat and electromagnetic load,as well as runaway current that will damage the device.[1–3]For large tokamaks such as ITER, disruptions at high performance discharge are unacceptable.Hence, disruption prediction, disruption prevention and disruption mitigation are of great significance.[4,5]Common ways for disruption mitigation such as massive gas injection (MGI) and shattered pellet injection (SPI) are effective to mitigate and alleviate the event.[6,7]Thus, disruption forecasting and precursor recognizing are of much importance in spite of their difficulty.Rulebased and data-driven methods are two common ways to realize disruption prediction.Rule-based methods usually combine with traditional machine learning algorithms,and largely rely on understanding of the phenomenon to manually extract features from raw data of diagnostics.With a relatively small amount of data and limited hyperparameter tuning, an explainable result could be reached.Some of the traditional machine learning methods have obtained acceptable result on their own devices.JET developed algorithms based on statistical approaches,[8]CART(classification and regression trees)based on ensemble decision trees,[9]and APODIS based on support vector machine(SVM).[10]DIII-D has also developed disruption prediction using random forests(DPRF).[11]However, the manual feature extraction is based on knowledge of disruptions already known.Some disruption related features may be ignored or difficult to extract as they cannot be described based on current knowledge.Meanwhile,deep learning methods, mostly based on neural network, require more data to reach better performance in exchange for more complex structure to design and establish.Also,a great number of studies have reached reasonable results on their own machines.HL-2A has developed a disruption predictor based on 1.5D CNN.[12]EAST has developed disruption predictors based on CNN and LSTM,separately.[13,14]Fusion recurrent neural network(FRNN)has also been developed and has been applied to JET and DIII-D.[15]Though data-driven methods do not necessarily need to manually extract features, it is important to combine proper characteristics of disruption precursors.All deep learning-based methods mentioned above are designed with comprehension of disruption precursors.
Deep learning has been widely applied in various scenarios, especially in computer vision (CV) and natural language processing(NLP).[16,17]Rapid progress and promising results have been made,based on the comprehension towards the features of the data acquired.Compared with traditional machine learning methods with manual feature extracting, deep learning methods have the potential to extract more features unknown or difficult to describe.With abundant data in terms of both quantity and quality, deep learning methods could reach a higher performance level than traditional machine learning methods.However,deep learning methods are black box models.The model is likely to be informed by some clues specific to the tokamak it is trained on, to tell whether the disruption will occur.Thus, the model may not be generalized well and can hardly be used on future tokamaks.
Most currently deep learning-based disruption prediction methods refer to state-of-art CV and NLP models.The FRNN structure combines convolution neural network and recurrent neural network together.[15]The hybrid deep-learning(HDL)disruption-prediction framework is inspired by the work in machine translation.[18]Though performance of the model could be improved, models it referred to are designed for the specific tasks in other fields, which are able to better extract features in their own fields rather than disruption prediction.Few models have been designed specifically for disruption prediction or for tokamak diagnostics feature extracting.
Characteristics of diagnostics from tokamak do have something in common with data acquired from computer vision and natural language processing.For each moment,data obtained from various tokamak diagnostics can be grouped together to form a matrix, which bears resemblance to images and is able to refer to ideas from CV.Similarly, for the sequential process of a discharge, the matrices form a time series, which is a time sequence and is able to refer to ideas from NLP.However,the similarities end here.Data of CV and NLP are homogeneous.Every dimension of the feature has the same physical quantity.Meanwhile,tokamak diagnostics produce high dimensional heterogeneous time series data, both different from images and regular sequences.The largest difference between data obtained from tokamak diagnostics and from other fields such as CV or NLP is that, tokamak diagnostics data are acquired from all different sensors with different physical meaning and temporal resolutions rather than the same,unlike a speech sequence obtained by a microphone in NLP or a picture captured by a pixel sensor in CV.Network structures referred from CV and NLP are not able to extract tokamak diagnostics related features with high accuracy.Meanwhile,different kinds of data are supposed to be handled by different kinds of networks.Inductive bias can also be informed to the network to better describe the known knowledge of disruption.In disruption prediction,CNNs are supposed to capture local details of the signals,such as the temporal cycle of sawtooth oscillations and the spatial radiation asymmetry,while LSTMs or other RNNs to capture characteristics of the time series in a larger time scale.Performance of the model may even be reduced with improper use.Therefore, characteristics of tokamak diagnostics are supposed to be taken into consideration.
Though current deep learning-based disruption prediction methods have reached positive results with state-of-art models referring from other fields, the majority of them still have room for improvement by informing characteristics of tokamak diagnostics rather than feeding raw data.For those methods which have already taken them into consideration, more detailed work is to be accomplished.For instance,diagnostics with different time resolution are often resampled to the same sample rate,leading to information loss or redundancy.Also,diagnostic arrays bear spatial features that are able to provide more information of the plasma edge.Diagnostics bearing features of different time scales and spatial information should be processed separately.To realize the methodology for deep learning disruption prediction methods to transfer across tokamak,a feature extractor general for all tokamaks is needed.All tokamaks have similar and common diagnostics for essential operation and basic experiments.Moreover,based on current understanding of disruptions, these diagnostics provide most of the disruption related information.Hence, if a feature extractor is designed for these diagnostics, the feature extractor could be used across different tokamaks.The lower layers of the feature extractor are supposed to capture low or medium level of features, which tend to be common characteristics across different tokamaks.Based on the feature extractor, a disruption predictor could be designed by combining the extractor along with a classifier.
To realize the deep learning-based disruption prediction method,a deep hybrid neural network feature extractor is designed, applied and tested on J-TEXT.The feature extractor evolves gradually with the deepening understanding of tokamak diagnostics data.Simple comprehension of disruption and its precursors and inductive bias of different diagnostics are informed in the feature extractor.Performances between the feature extractor and other neural networks are compared.Performances between different sizes of training set are compared.Also, performances between the extractor and rulebased manual feature extracting models are compared.
The remainder of the paper is organized as follows.The disruption dataset and diagnostics chosen is described in Section 2.In Section 3, the feature extractor is evolved with the gradual deepening understanding of physical mechanisms of disruption and tokamak diagnostics.Performances between the evolutions are compared.In Section 4,a disruption predictor based on SVM with manual feature engineering is established.A few comparisons between manual feature engineering and deep learning feature extracting are made.Section 5 presents discussions about the feature extractor and a conclusion follows in Section 6.
2.Dataset description
The studies are conducted on the J-TEXT tokamak(2017-2018 campaigns).[19]J-TEXT is a mid-sized limiter configuration tokamak with a minor radiusa=0.25 m and a typical plasmaIpof around 200 kA, a toroidal fieldBtof around 2.0 T, a pulse length of 800 ms, a plasma densitiesneof 1–7×10¹⁹m−3, and an electron temperatureTeof about 1 keV.[20]The J-TEXT tokamak has a complete diagnostic system.The three-wave FIR laser polarimeter-interferometer system(POLARIS)is provided to obtain electron density and current profiles with high temporal and spatial resolution.A 24-channel heterodyne electron cyclotron emission(ECE)radiometer is provided to measure electron temperature profile,covering the frequency range between 80–125 GHz.Two 18-channel photodiode arrays are provided for CIII and Hαmeasurement,which offers edge information.Five 16-channel arrays are provided for SXR, with three of them observing the internal plasma region and the other two observing the plasma core and boundary.Four Mirnov arrays and one saddle loop array are provided to measure the perturbed magnetic fields due to MHD activity.In addition,regular diagnostics are provided to obtain information including plasma current,toroidal field,displacement and other information.

Table 1.Channels in J-TEXT for input of the predictor.
The work is conducted on the J-TEXT disruption database based on the previous work.[21]82 channels of diagnostics are selected,as is shown in Table 1.Different channels cover different physical features.Thus,different sampling rates are applied to the diagnostics according to the typical frequencies of their corresponding features.For basic diagnostics such as the plasma current,a sampling rate of 1 kHz is enough to represent the variation within a period.For Mirnov coils and other diagnostics which are able to measure high frequency MHD instabilities,a higher sampling rate is applied to make sure that all instabilities are captured.874 shots (495 disruptive)are selected.The dataset excludes disruption shots caused by intentional and engineering factors.All shots chosen have a full access to the 82 channels.Split of datasets are shown in Table 2.
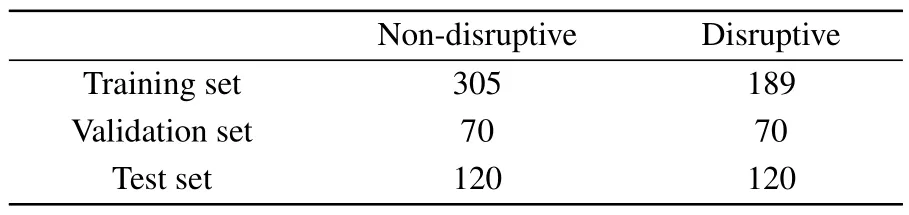
Table 2.Split of datasets of the predictor.
Before feeding the data into the neural network for training, normalization is carried out to map all signals within a similar numerical range.After necessary feature extraction,which would be described in detail in Section 3,stacked features are cut into slices in form of sliding windows.To meet the timing requirements of the disruption mitigation system, enough warning time before disruption should be kept.Thus, slices 20 ms before disruption are labelled as “disruptive”,while slices from non-disruptive shots labelled as“nondisruptive”.It is worth noting that, the 20 ms duration is not definite,and the rest slices of the disruption shot are not used because there are still enough non-disruptive slices from the non-disruptive shots.Considering non-disruptive and disruptive slices are obviously out of proportion,a larger step is taken when sliding non-disruptive shots to reduce their slices.When training, disruptive shots account for 2/3 of the total in each batch.Each epoch covers all shots and corresponding slices.
Now that the training set is fully prepared, the methodology of designing transferable deep neural network focusing on tokamak diagnostics is then to be presented, using diagnostics and data from J-TEXT as an example.The key of the methodology is the feature extractor with tokamak diagnostics characteristics and physical mechanisms of disruption and its precursors informed, offering it ability to extract general features of disruption and thus is easy for transfer between different tokamaks,and will need less data from the target tokamak.The input diagnostics are selected considering the typical frequency of 2/1 tearing mode on J-TEXT, the amplitude of the locked mode,the cycle of sawtooth oscillations,the radiation asymmetry and others.It is worth noting that, none of these features is explicitly extracted.Characteristics of the features are considered,adding inductive bias into the network without constraining it to known physical mechanisms of disruption.The inductive bias is the set of assumptions that the learner uses to predict outputs of given inputs that it has not encountered.In this work, the structure of the feature extractor and the input signals are designed with the guidance of the characteristics of tokamak diagnostics data and physical mechanisms of disruption.The feature extractor gradually evolves with more physical mechanisms of disruption and inductive bias on tokamak diagnostics informed.To verify the effectiveness of the feature extractor, performance between it and manual feature engineering guided by physical mechanisms will also be compared.
3.Evolution of the feature extractor driven by comprehension of tokamak diagnostics
The disruption predictor could be separated into two parts, a feature extractor and a disruption classifier.For a disruption predictor based on deep neural networks, features obtained from the feature extractor are fed into the classifier which mainly consists of fully connected layers.The classifiers are basically designed the same.Thus, the key is the processing and feature extraction of the data.Intuitively, the performance of the feature extractor should become better as it evolves with the deepening comprehension of tokamak diagnostics.Considering the characteristics of data acquired from various diagnostics from tokamak,several kinds of neural network are to be applied.To start with,no characteristics of the diagnostics or physical mechanisms are informed to the network and the most common fully connected neural network is taken for its general performance to extract features.With more details informed when designing the feature extractor,the performance is expected to improve.
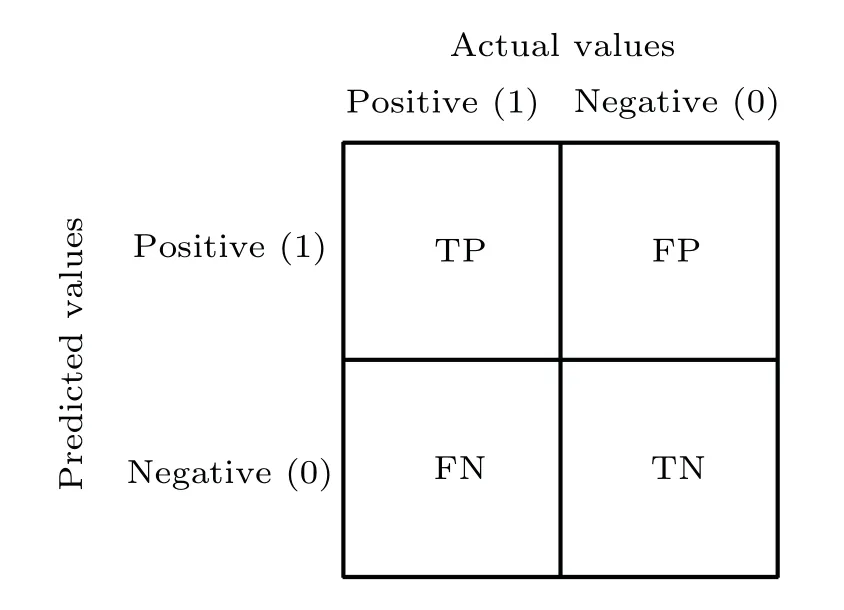
Fig.1.Confusion matrix.
In a binary classification task, confusion matrix is often used to evaluate the performance of the model,which is shown in Fig.1.In disruption prediction, TP refers to an actual disruptive shot correctly predicted.FP refers to an actual nondisruptive shot misclassified as disruptive.TN refers to an actual non-disruptive shot correctly identified.FN refers to an actual disruptive shot not recognized.Short warning time can hardly meet the requirement to trigger the disruption mitigation system in time.Thus,any predicted disruption with a warning time less than 10 ms is reckoned as FN.True positive rate(TPR),false positive rate(FPR)F-score and warning time are selected to judge the performance of the disruption predictor.The receiver operating characteristic (ROC) curve is introduced to visualize the performance.TPR,FPR and Fscore are calculated as follows:
3.1.Baseline feature extractor:no physical mechanism informed
A feature extractor made up with fully-connected layers is used as baseline feature extractor considering its simplicity and generality.The 82 channels of diagnostics are all down sampled to 1 kHz and are fed into the neural network directly.The framework of the feature extractor is shown in Fig.2.Each output of the disruption predictor tells the disruptivity of current slice.If the disruptivity of the slice is larger than a warning threshold,the slice is marked as disruptive.To reduce the possibility of false alarm,the tested shot is reckoned to be disruptive only when enough disruptive slices are accumulated within a duration.In our case, the warning threshold and the number of consecutive slices is the best practice from the validation set.Thus, each predictor applies a different warning threshold and number of consecutive slices based on performance on the validation set.The baseline predictor applies a threshold of 0.67, while the number of the consecutive slices is 3.

Fig.2.Structure of the feature extractor based on fully connected neural network along with its disruption classifier.
As a result, among the 240 test shots, TPR reaches only 57.50%while FPR 10.80%.The F-score of the model is 0.68.The average warning time is 119.14 ms.Apparently,the model hardly tells disruptive from non-disruptive shots.Necessary adjustments have to be assigned to the model to further improve the performance.
3.2.Evolution 1: temporal information with LSTM
The long–short term memory neural network (LSTM)has the capability of capturing information over arbitrary time intervals.[22]Data of each channel and diagnostic are continuous chronologically.In most cases,the physical phenomenon happening before disruption,also known as the precursor,will be reflected in the variation of some of the diagnostics.The LSTM will capture and memorize the variations during training and therefore is able to predict the disruption at inference.Thus, it is reasonable to extract general features using fully connected layers, and extract temporal features with the help of LSTM.Thus,LSTM is introduced into the structure to extract temporal features of disruption, as is shown in Fig.3.Features extracted by the fully connected layers of each millisecond concatenate together into a 32 ms time series,which is then fed into the LSTM for temporal feature extraction.The corresponding output of each millisecond’s input is then sent to the classifier to tell whether the current millisecond is disruptive or not.The predictor of evolution 1 applies a threshold of 0.53,while the number of the consecutive slices is 6.
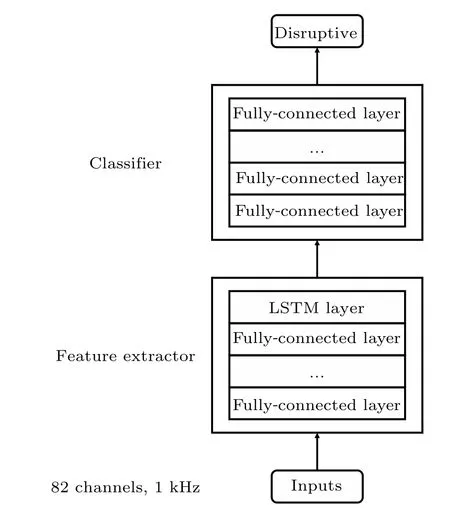
Fig.3.Structure of the feature extractor evolved with LSTM along with its disruption classifier.
Under the same size of parameters as the baseline, the TPR of the model raises to 74.17% while FPR 11.67%.The F-score raises to 0.79.The average warning time is 158.54 ms.As is shown in the results, introduction of LSTM has greatly improved the performance, indicating that temporal features from the time series of each channel are successfully extracted and make contribution to the final judgement of the predicted disruption.However,the performance of the model is still not good enough,leading CNN to local feature extraction.
3.3.Evolution 2: high-frequency temporal features with CNN
CNN is normally used to extract local features from data.Tokamak diagnostics produce high dimensional heterogeneous time series data.Thus,a basic idea is to extract local features using CNN and stack them chronologically to make up a time series.After necessary transformation of the features extracted, LSTM is introduced to extract temporal features with a relatively long duration compared with CNN.Finally,the output is fed into a disruption classifier to tell if the input slice is disruptive.The predictor of evolution 2 applies a threshold of 0.75, while the number of the consecutive slices is 5.
Since different diagnostics contains different physical information, it is not appropriate to perform convolution to all diagnostics in the same kernel.Thus, a parallel convolution 1D layer is introduced.The layer performs convolution and pooling to each channel that needs convolution separately,and captures local temporal features.Outputs of each layer concatenate together to make up a“feature frame”.A frame is a local feature.Even if the frame does contain temporal information,the feature is also local and does not contain evolution.A sequence of frames is fed to the LSTM to handle the evolution of temporal features,which is mapped to the output by the disruption classifier.The structure of the parallel convolution 1D layer is shown in Fig.4.

Fig.4.Structure of parallel convolution 1D layer.
CNNs take advantage of the hierarchical pattern in data and assemble patterns of increasing complexity using smaller and simpler patterns embossed in their filters.They decompose a large number of parameters into small ones,while keep necessary features at the same time.Thus, CNNs are able to reduce calculation in a large scale and extract features efficiently.Data of a much higher sample rate,which is 100 kHz,is provided as the input of the model to extract local features in a higher temporal resolution, hopefully.The input signals are processed as sliding windows with a duration of 1 ms.The features extracted by the parallel convolution 1D layer, also known as a frame, are then concatenated into a 32 ms long time series and is fed into the LSTM to extract temporal features of a relatively long period.And finally, the output is fed into the classifier to tell whether the shot is disruptive or not.The structure of the feature extractor based on CNN and LSTM is shown in Fig.5.

Fig.5.Structure of the feature extractor evolved with CNN and LSTM along with its disruption classifier.
Though both data and the structure of the whole disruption predictor have become more complicated, magnitude of the parameters still stays the same thanks to introduction of the parallel convolution 1D layers.Also,because the sample rate has been greatly improved, much more information has been led into the feature extractor.The TPR has raised to 85.83%while the FPR raises to 21.67%,indicating that the model becomes more aggressive in predicting disruptions.The F-score increases to 0.83 and the average warning time is 137.27 ms.The performance of the new model indicates that performance does improve to some extent.However, the FPR also raises greatly, possible because of more unnecessary information is also introduced raising sample rates of all diagnostics.Some of them do not need temporal feature extraction and thus lead to overfitting.Therefore, it is necessary to introduce a new kind of feature extractor to properly process all diagnostics with their own characteristics properly.
3.4.Evolution 3:characteristics with different frequencies and spatial information with fusion feature extractor
When it comes to each feature frame,more details should be noticed.Guided by known physical mechanisms of disruption, various kinds of phenomenon with different time scales and frequencies all lead to disruption.There is no need to extract features with low frequency using CNN because of their little variation in a frame span.For features bearing different frequencies and time scales,it is improper to slice the signals with the same window length and sampling rate.To ensure that features with high frequencies are to be captured in every frame,multiple cycles of the physical phenomenon should be covered within the duration of the sliding window.In addition,as has been proved in previous work,spatial information contained in diagnostics arrays are of great significance.[23]Thus,spatial information should also be extracted.Features to extract and their corresponding diagnostics and processing are introduced as follows:
High frequency featuresInstabilities in tokamak plasmas usually bear high frequencies.Mirnov coils, POLARIS,SXR and ECE are chosen so that MHD instabilities,as well as other possible features with high frequency in plasma density,radiation and temperature could be extracted.
Them/n=2/1 tearing mode is a common kind of MHD instability in tokamak, resulting in formation of magnetic island and loss in confinement.[2]Further growth of the magnetic island will do great harm to magnetic surface and finally lead to disruption.Two pairs of adjacent Mirnov coils,poloidal and toroidal,are used to capture the spatial structure of the magnetic island.The typical frequency of 2/1 tearing mode of J-TEXT is 3 kHz approximately.A sliding window of 2 ms with a sample rate of 50 kHz is selected as the input of the corresponding parallel convolution 1D layers to capture enough cycles of the phenomenon.The output of the convolution layer is considered to be the feature of the last millisecond of the sliding window.It is worth noting that,other MHD instabilities with higher typical frequencies will also cause confinement degradation and may lead to other serious instabilities.Thus,it is necessary to keep a high sample rate for Mirnov coils to capture possible features of MHD instabilities with higher frequencies.
Sawtooth oscillations are a periodic MHD initiated mixing event occurring in tokamak.[2]Sawtooth oscillations are possible to couple to locked modes and edge perturbations such as ELMs and external kinks,[24]and may also finally lead to onset of disruption.Sawtooth oscillations can be obtained from POLARIS, ECE and SXR diagnostics on J-TEXT.The typical frequency of sawtooth oscillations is around 600 Hz.Similarly, a sliding window of 10 ms with a sample rate of 10 kHz is selected as the input of the corresponding parallel convolution 1D layers to capture enough cycles of the phenomenon.The output is also considered as the feature of the last millisecond of the sliding window.Also, other possible features in these diagnostics may reflect variations in plasmas.A 10 ms long sliding window is long enough to cover these features on J-TEXT tokamak.
Spatial related featuresMuch more comprehensive information could be provided with the help of diagnostic arrays.For POLARIS and SXR, which are able to provide information of plasma density and radiation, only the single central channels of both are used to capture possible sawtooth oscillations.They concern more about information closer to the center of the plasma,losing information of the plasma edge,which may also affect the density limit.Arrays of the diagnostics are able to provide information of the edge of the plasma and also reflect the internal constraints.Impurities of the plasma also help to predict disruptions.Thus,CIII and Hαarrays are obtained.The design of the parallel convolution 1D layers can be reused.Not only can CNN extract local temporal features,but also spatial features of theRaxis of the plasma.Now that necessary high frequency features have been extracted,the diagnostic arrays are down sampled to 1 kHz.The channels of each array are concatenated with the duration of 1 ms as the input of the corresponding parallel convolution 1D layers, to extract spatial related features.
Low frequency featuresExcept for all diagnostics mentioned above, there are still a great many of diagnostics related with disruptions.Needless to extract features in a frame though,they still play an important role in composing a feature frame.
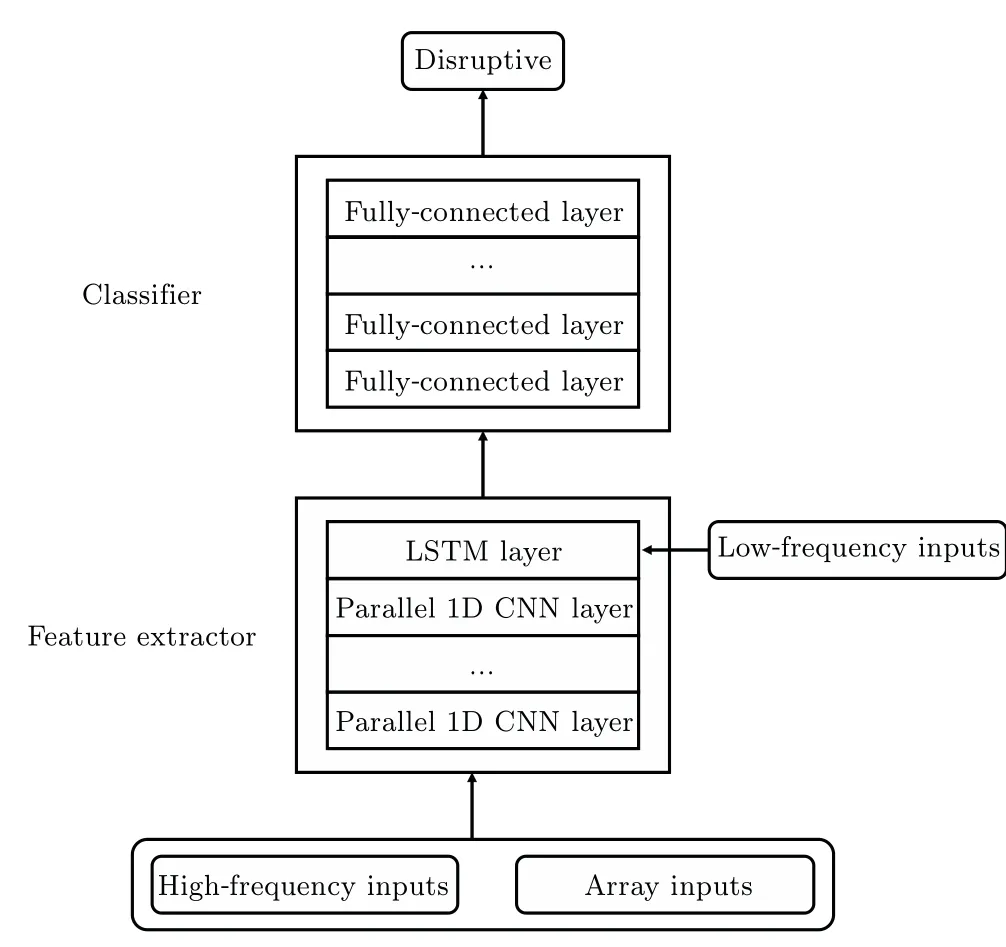
Fig.6.Structure of the feature extractor evolved with FFE along with its disruption classifier.
The structure of the fusion feature extractor(FFE),along with its disruption classifier is shown in Fig.6.Diagnostics arrays with spatial information and diagnostics with high sample rates are fed into the parallel convolution 1D layers to extract high-frequency temporal features and spatial features.After getting through the parallel convolution 1D layers, the features extracted are reshaped and concatenated with other 14 low frequency diagnostics, consisting of a feature frame of 1 ms.Multiple feature frames together make up a feature series and is fed into the LSTM for temporal feature extraction.Up till now,the FFE has finished its work.The feature extractor mixes temporal and spatial information together, and also mixes features of high frequency and low frequency together.The features extracted are then fed into the disruption classifier made up of fully connected layers to tell whether the slice input is disruptive or not.The predictor of evolution 3 applies a threshold of 0.72,while the number of the consecutive slices is 5.
Performance of the disruption predictor has been greatly improved under the same magnitude of hyperparameters.TPR has reached 90.80% and FPR falls to 15.00% compared with the predictor based on CNN + LSTM above.The F-score reaches 0.88.The average warning time is 152.87 ms.The comparison between the ROC curves is shown in Fig.7.
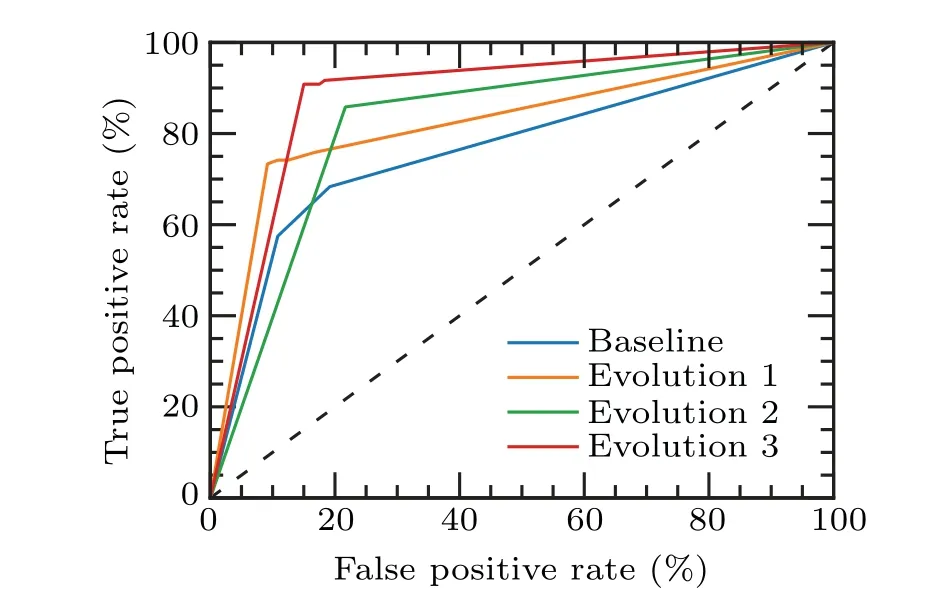
Fig.7.ROC curve of evolution 3.
Performances between disruption predictors based on deep learning is shown in Table 3.It is obvious that the more specific the feature extractor is designed, the better the final disruption predictor performs.It is also very noteworthy that,though the precision of the predictor keeps raising,more false alarms also appear with the introduction of more information.With proper and specific feature extraction, false alarms vanish to some extent.

Table 3.Performances comparison between disruption predictors based on deep learning.
A typical disruptive discharge caused by density limit is shown in Fig.8.The prediction is given by the predictor of evolution 3.At the beginning of the discharge, higher density and stronger radiation appear at the edge of high field side(HFS)than low field side(LFS),which is a main character of MARFE.However,the model does not give any warning.As the MARFE develops, the density of the edge of HFS gradually declines and evolves into detached plasmas at around 0.4 s, while the C-III impurity shows a significant rise close to the center of the plasma.As is shown in Fig.8(f), a small MHD instability also goes up.The discharge then disrupts as the density grows.The model gives out warning when the density at the edge of HFS starts to decline.Though no direct feature is fed to the model, the prediction demonstrates that the model recognizes the evolution towards detached plasmas and sends out a warning 65 ms ahead of the final disruption.

Fig.8.A typical density limit disruption discharge #1057203 and its prediction given by FFE.(a) The plasma current of the discharge and the prediction given by the FFE; (b) the central line-averaged density;(c)the line-averaged density at r=±24 cm;(d)the radiation power at r=±23 cm;(e)the C-III line emission at r=13 cm;and(f)the spectrum of the poloidal Mirnov coil.The green line indicates warning time while the red line indicates the disruption time.
Another typical disruptive discharge caused by locked mode is shown in Fig.9.The prediction is given by the predictor of evolution 3.As the discharge proceeds,both toroidal and poloidal Mirnov coils show significant rise.From the spectrum of the poloidal Mirnov coil, the frequency of the instability is around 5 kHz, which indicates a typicalm/n=2/1 tearing mode on J-TEXT tokamak.The tearing mode gradually speeds down and finally locks at around 0.318 s.The discharge soon goes disruptive at 0.323 s.The model sends out warning at the rise of the Mirnov coils,50 ms ahead of the disruption, indicating that the model has the ability to extract features related to tearing modes.
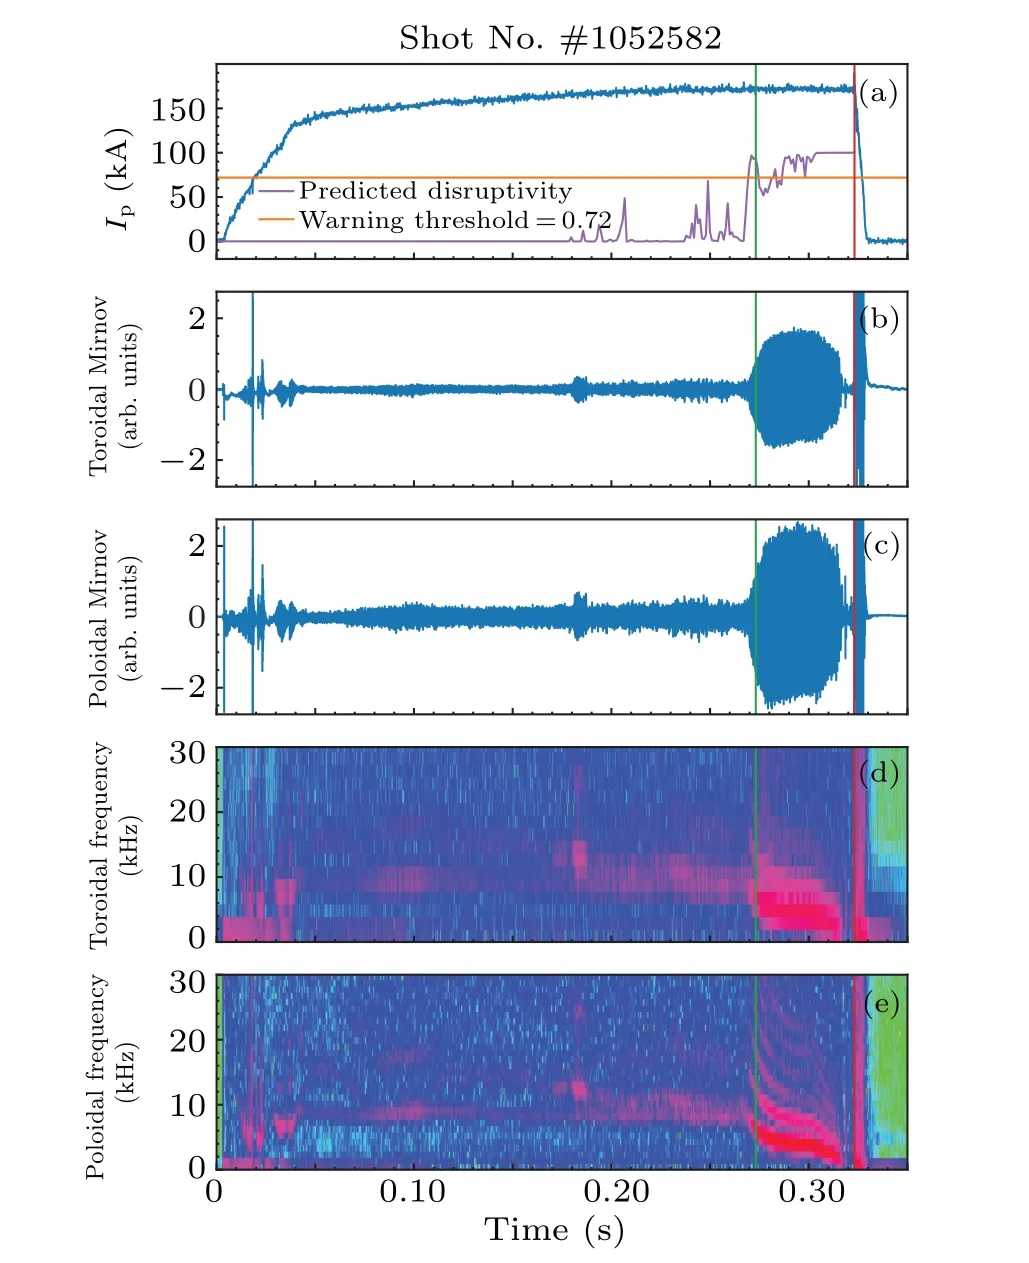
Fig.9.A typical locked mode induced disruption #1052582 and its prediction given by FFE.(a) The plasma current of the discharge and the prediction given by FFE; (b) and (c) the raw toroidal and poloidal Mirnov signals; (d) and (e) the spectra of the toroidal and poloidal Mirnov signals.The green line indicates warning time while the red line indicates the disruption time.
4.Comparison between FFE and physicsguided manual feature extraction based on SVM
Traditional machine learning is another way to implement disruption prediction.Deep learning methods are usually endto-end.Thus, data obtained from diagnostics are fed directly into the neural network with limited necessary mathematical pre-processing.Physics-guided manual feature engineering relies on comprehension of the mechanism and is only able to extract features within existing knowledge.Also, features currently unknown and difficult to describe are likely to be ignored and will cause loss of information.For end-to-end models,features would be extracted automatically and will be used directly to judge the final result.Meanwhile, as long as enough amount of data is fed into the model, patterns or features beyond human comprehension can be extracted.Features within comprehension can also be extracted by informing corresponding knowledge when designing the structure of the model.Traditional machine learning methods rely on feature engineering based on comprehension of phenomenon.Data acquired from diagnostics needs enough feature engineering before fed into the model.
4.1.Baseline manual feature engineering: raw signal input
SVM is one of the most typical machine learning methods.[25]Given a set of training examples labeled as two different categories,the SVM maps the training examples into kernel space, especially when dealing with non-linear tasks,and maximizes the distance between the two categories to implement its classification.New examples to be classified are also mapped in the same way as the training ones and are predicted based on the closer side to both categories.
A disruption predictor based on SVM without feature engineering is first established as the baseline.Channels and diagnostics selected as the input are exactly the same as those used in deep learning methods.The predictors also share the same train-test split.As a result, TPR reaches 70.83%while FPR is 18.33%.The F-score of the model is 0.75.Average warning time is 115.67 ms.Non-surprisingly, the disruption predictor based on SVM behaves normal without any feature engineering.In most cases,SVM performs better with low-dimensional and small scale of dataset.A suitable known kernel is also essential for the training process and final predictions.However, tokamak diagnostics produce high dimensional heterogeneous time series data.Under the circumstances, a higher-dimensional feature space increases the generalization error of SVM.It also takes much more time for SVM to search for appropriate hyperparameters.
4.2.Manual feature engineering guided by known physical mechanisms
Feature engineering has been accomplished guided by physical mechanism of disruption based on previous works.[26,27]Features containing temporal and spatial profile information are extracted,along with other general signals that do not need feature extraction.A total of 26 signals are extracted.All features are listed in Table 4.
Distribution of the features extracted shows great differences between disruptive and non-disruptive shots.Take plasma current for instance, it is found that more disruptions take place in high plasma current scenario, which is related to the reduction ofqa.Distribution of frequency of poloidal Mirnov signal of disruptive and non-disruptive shots is shown in Fig.10.As MHD instability occurs, it is more likely for disruption to take place.
Performance has been greatly improved with the features extracted.Number of the input signals reduces from 82 to 26.TPR of the improved disruption predictor based on SVM reaches 89.20% and FPR falls to 14.20%.The F-score of the predictor raises to 0.88.The average warning time is 120.81 ms.

Table 4.Disruption related features.
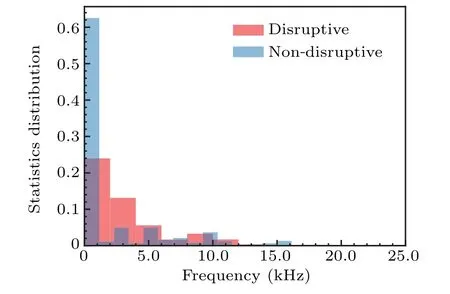
Fig.10.Distribution of frequency of poloidal Mirnov signal of disruptive and non-disruptive shots.
4.3.Comparison between fusion feature extractor and manual feature engineering with SVM
Feature extractionThere is no doubt that feature extraction plays an important role in disruption prediction.Both the disruption predictor based on the FFE and manual feature engineering overperform all other disruption predictors in this work.Feature engineering for traditional machine learning needs relatively deep comprehension towards the physical mechanisms of the phenomenon.Meanwhile,basic understanding of disruption and its precursors is needed to instruct the structure design.Feature extraction based on deep learning reduces the threshold of understanding the mechanism of disruption.Also, since the feature engineering for traditional machine learning is performed based on current knowledge,it is difficult to discover new mechanisms.Feature extraction with deep learning is flexible and still has much potential in extracting features of tokamak diagnostics data.A typical disruptive discharge is shown in Fig.11.The disruption is successfully predicted by the FFE while the SVM fails.There are no obvious precursors from the raw signals that can indicate the coming disruption and even operators cannot give the reason why it disrupts.Thus,the FFE has the ability to recognize features in a higher level of feature space.
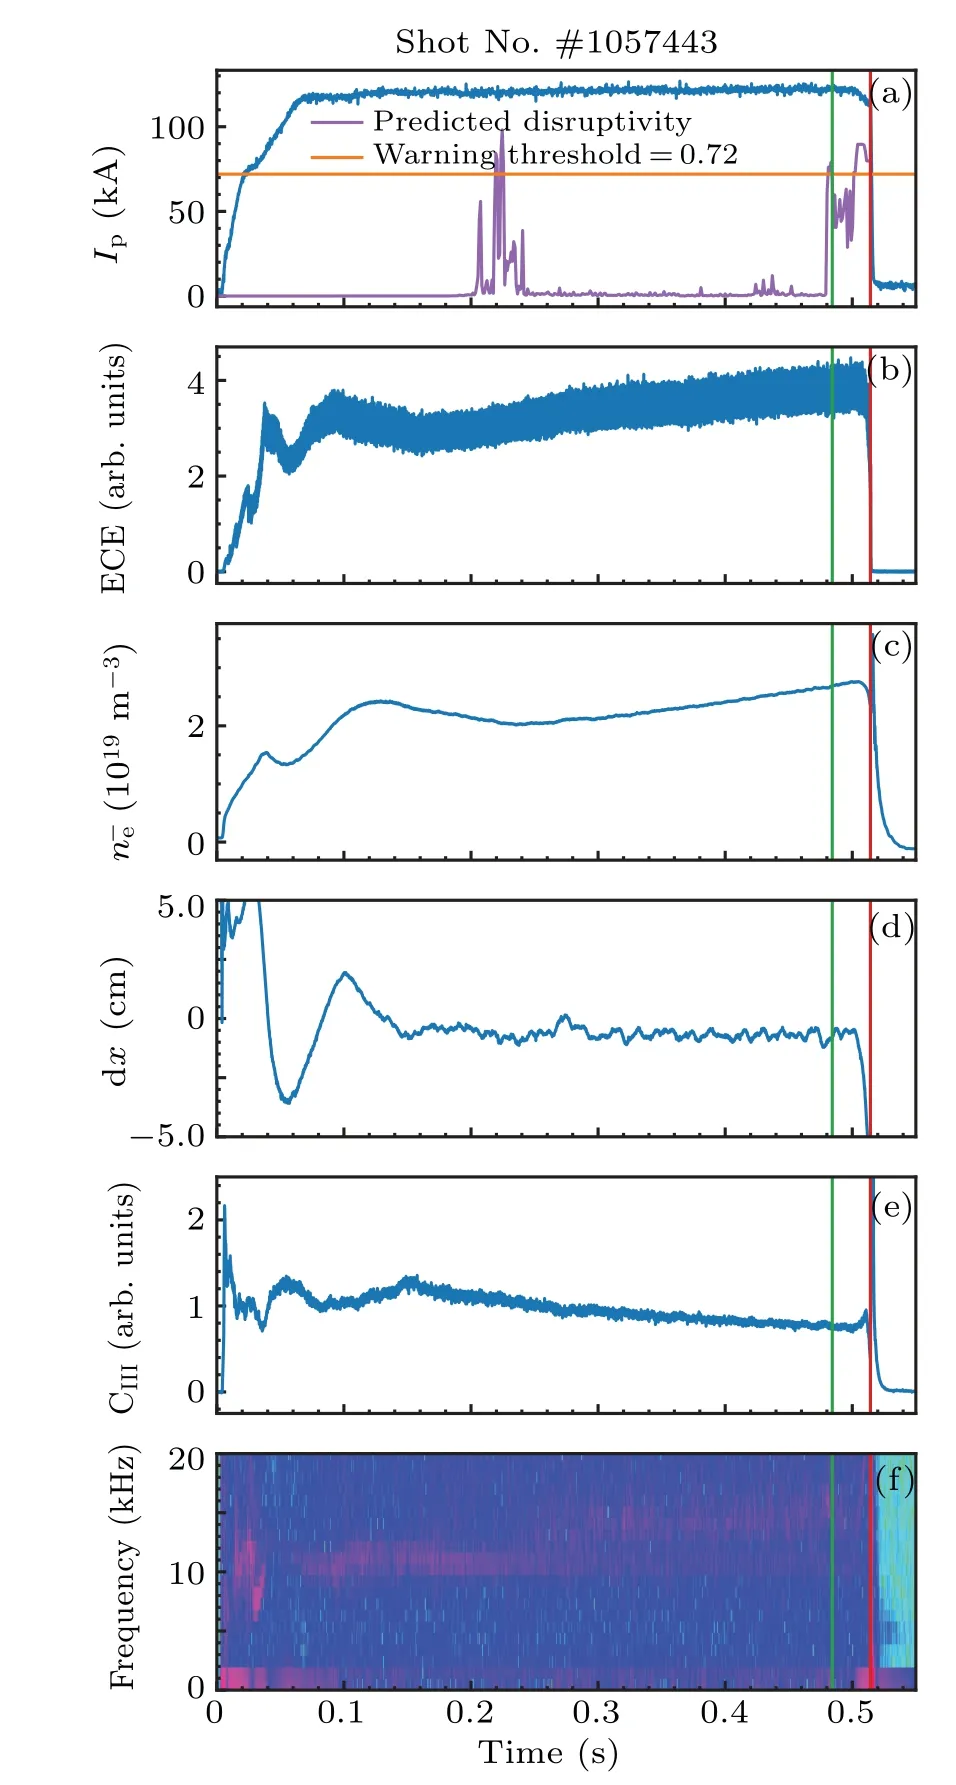
Fig.11.A typical disruptive discharge with no obvious precursor from raw signals #1052582, and its prediction given by FFE.(a) The plasma current of the discharge and the prediction given by FFE;(b)the ECE signal which indicates relative temperature fluctuation; (c) the central lineaveraged density; (d) the horizontal displacement of the plasma; (e) the C-III line emission at r = 13 cm and (f) the spectrum of the poloidal Mirnov signal.The green line indicates warning time while the red line indicates the disruption time.
PerformancePerformance comparison between disruption predictors based on manual feature engineering along with the FFE are listed in Table 5.
From Table 5,it is discovered that the disruption predictors based on manual feature engineering and the FFE behave similarly,far better than the predictor without any feature engineering.The result proves the effectiveness of the FFE preliminarily.The ROC curve of manual feature engineering and the FFE is shown in Fig.12.
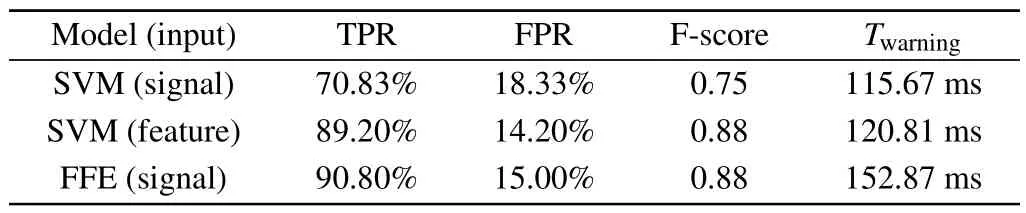
Table 5.Structure of the feature extractor evolved with LSTM along with its disruption classifier.

Fig.12.ROC curve of disruption predictor with manual feature engineering and the FFE.
Size of training dataThe F-score of the disruption predictor based on SVM with feature engineering and on FFE with different size of training data is shown in Fig.13.With the increase of the training size, the performance of the disruption predictor based on SVM increases at a slow pace,while that of FFE increases rapidly and shows vast potential to keep improving with more data fed into the predictor.However, with a small amount of data, disruption predictor based on SVM with feature engineering overperforms that based on FFE.
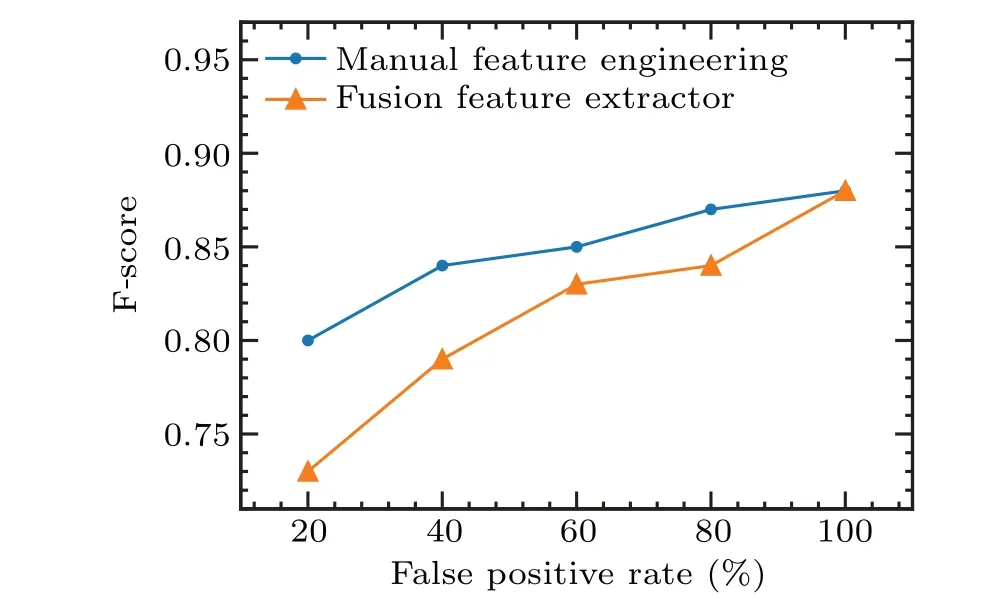
Fig.13.The F-score of disruption predictor based on SVM with feature engineering and FFE with different size of training data.
Both disruption predictors are not reliable enough with a small amount of training data.However,as data accumulates,the performance of the model gradually increases, while the performance of the FFE-based model improves rapidly and shows great potential to keep improving.In this work, the amount of data is still relatively small with consideration of access and consistency of all diagnostics used.A better result is predicted with more data acquired in future experiments.
HyperparametersOnly a few hyperparameters are to tune for traditional machine learning.Take SVM for instance,only two hyperparameters,Candγ, make the majority contribution to the performance of the model.For deep learning however,way too many hyperparameters are to tune,including number of layers,number of neurons,size and number of the filters for CNN, length of the time window, activation function,batch size and many other more.For traditional machine learning, a simple grid search for proper hyperparameters is the only thing needed.But deep learning methods take much to find the best model among all, which makes the structure design more important.An appropriately designed structure helps improve the performance even without careful hyperparameter search.
ComputationOffline testing results show that it takes∼375µs for the FFE-based predictor to predict each sample(1 ms), while∼85 µs for the SVM-based predictor without feature extraction.Though the SVM-based predictor predicts faster than the FFE-based predictor,manual feature extraction takes long.Since the FFE-based disruption predictor is an endto-end model,no extra computation is needed except for necessary resampling and generalization and cost little time.On the other hand, the physical-guided manual feature engineering needs more calculation to extract the features and takes more than 24 hours when preparing the whole dataset.This further proves the efficiency of the FFE.Feature engineering relies much on deep understanding of the physical mechanism of disruption and its precursors.Some of the features to be extracted need accurate formula derivation.With the help of deep learning, only basic comprehension of disruption is needed to help design the appropriate structure for diagnostics respectively.The training process of the FFE-based predictor is also able to be accelerated with GPUs,greatly reducing the time consumed compared with other methods.With further optimization and more accessible channels in real-time,the FFE-based predictor is likely to predict disruptions in realtime experiments.
Traditional machine learning vs.deep learningWith all comparisons above, both traditional machine learning and deep learning have their own pros and cons.Traditional machine learning together with manual feature engineering needs less amount of data to reach a relatively good performance.The model is easier to design and the hyperparameters are more convenient to tune.Also, with understanding of disruption and its precursors,the features extracted all have own physical significances and thus are interpretable to some extent.However, the feature extraction needs deep understanding of the mechanisms with accurate formula derivation.It is difficult to discover new mechanisms for the extraction is based on knowledge already known.It also takes much time for computation.Feature extraction based on deep learning seems capable of solving the concerns above.Current deep learning methods mostly refers to the state-of-art models designed for the fields of CV and NLP,which are not suitable for tokamak diagnostics data.In our case,the deep learning based feature extractors and disruption predictors gradually perform better in tokamak diagnostics feature extraction and disruption prediction with the evolution guided by physical mechanisms.Requirement for tuning hyperparameter is reduced with properly designed structure.Lack of interpretability could also be solved.Local contribution can be analysed through integrated gradients.Low level feature contribution to disruption can also be found with analysis methods.The threshold of comprehension of physical mechanisms is largely reduced.There is still great potential in tokamak diagnostics feature extraction with deep learning.
5.Discussions
TransferabilityManual feature engineering relies much on the specificity of the tokamak device.For each different tokamak, the way of feature extraction varies with different parameters and different layout of the diagnostics.Even if the features are extracted,they will be fed into another model to further be mapped to a new feature space before obtaining the final result.Both complexities are great limitation for manual feature engineering and traditional machine learning to transfer across tokamaks.Relatively, a use case for transferring across tokamaks based on FFE is presented in Fig.14.The bottom layers of the feature extractor are frozen while the layers to extract more specific features and the classifier are fine-tuned with limited epochs of training after data from new tokamaks is fed into the model.Since the model is end-to-end,there is no need to design a new method or structure to extract features.In addition,the top layers are general enough for fusion features,also informed with enough physical mechanism of disruption and inductive bias on tokamak diagnostics.Thus,they are frozen and is considered to extract general features of disruption from tokamak diagnostics.However, considering different parameters of different tokamaks, layers to extract more specific features along with the classifier should be adjusted to better fit the data from the new tokamak.Thus,these layers are to be fine-tuned.The design of the FFE offers potential for deep learning based disruption prediction methods to transfer across tokamaks.
Potential for multi-task learningMulti-task learning is an approach to inductive transfer that improves generalization by using the domain information contained in the training signals of related tasks as an inductive bias.It does this by learning tasks in parallel while using a shared representation; what is learned for each task can help other tasks be learned better.[28]Though the feature extractor is trained for disruption prediction, some of the results could be used for other fusion related purpose,such as operation mode classification.The pretrained model is considered to have extracted features containing physical information such as the typical frequency of the tearing mode, the cycle of sawtooth oscillation,the amplitude of the locked mode,the radiation asymmetry and other features that would help other fusion related tasks be learned better.The pretrained model would drastically reduce the amount of data needed for the new tasks.
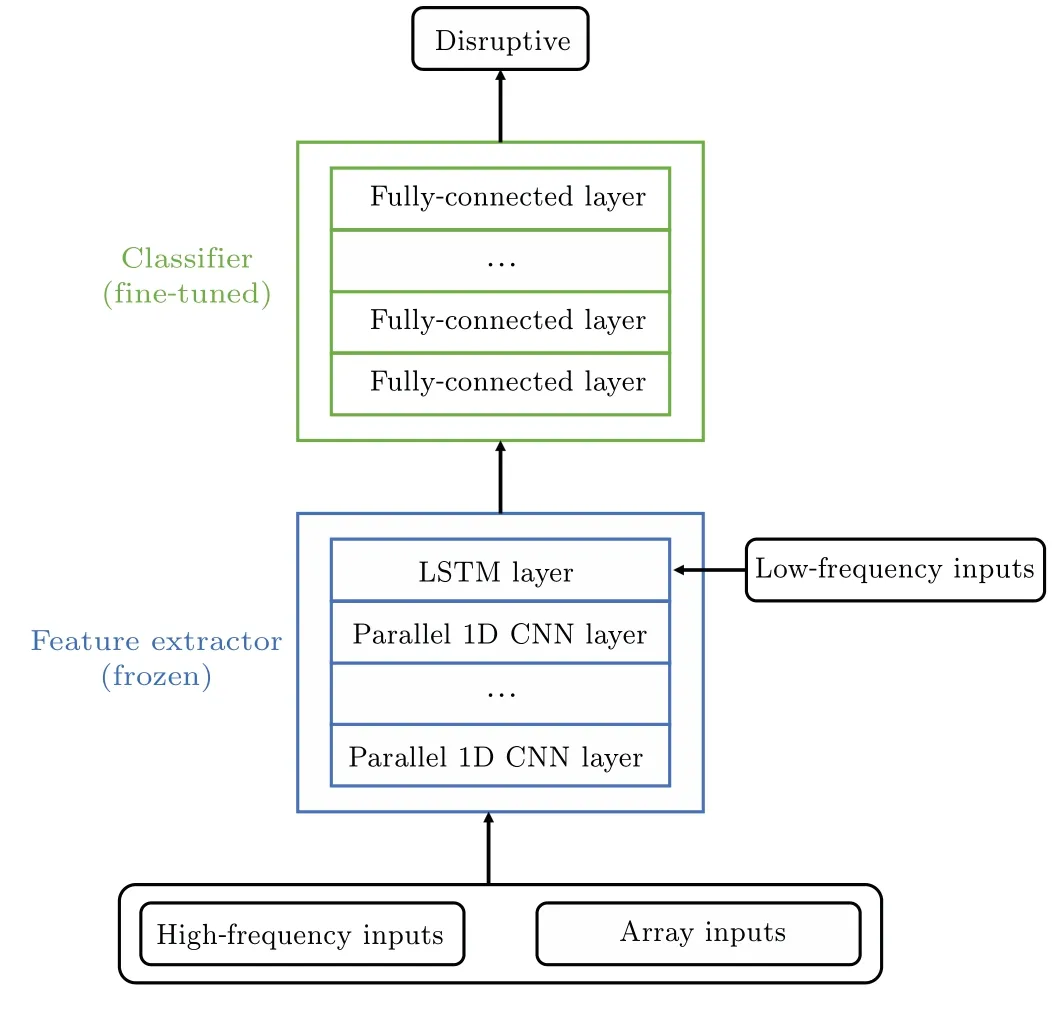
Fig.14.Possible use case for transferring across tokamaks based on FFE.
6.Conclusion
In this work, a deep hybrid neural network feature extractor designed specifically for tokamak plasmas, the fusion feature extractor, is presented.The FFE is designed to support deep learning based disruption prediction across tokamaks.The FFE evolves from the simplest fully connected neural network without considering any of the characteristics of tokamak diagnostics.With the gradual deepening comprehension of the disruption and inductive bias on diagnostics data informed to the network, the feature extractor is more flexible and specific.TPR of the model raises from 57.50% to 90.80%,while the F-score raises from 0.68 to 0.88.The FFE also overperforms all other methods with its ability to capture disruptions caused by tearing modes with plain understanding informed.The disruption predictor based on FFE is also compared with that based on SVM with and without manual feature engineering.Disruption predictor based on SVM with raw signals presents poor performance.Thus,feature engineering is conducted based on comprehension of disruption along with its precursors.The disruption predictor with the features extracted makes vast progress and reaches performance similar with that based on FFE,validating the effectiveness of the feature extracted with neural network.The disruption predictor based on FFE is expected to transfer across tokamaks with freeze-and-fine-tune technique.The FFE is also expected to be applied in multi-task learning to help with other fusion related tasks,and to reduce the amount of data for training.
Acknowledgements
The authors are very grateful for the help of J-TEXT team.
Project supported by the National Key R&D Program of China(Grant No.2022YFE03040004)and the National Natural Science Foundation of China(Grant No.51821005).
猜你喜欢
杂志排行

Chinese Physics B的其它文章
- First-principles calculations of high pressure and temperature properties of Fe7C3
- Monte Carlo calculation of the exposure of Chinese female astronauts to earth’s trapped radiation on board the Chinese Space Station
- Optimization of communication topology for persistent formation in case of communication faults
- Energy conversion materials for the space solar power station
- Stability of connected and automated vehicles platoon considering communications failures
- Lightweight and highly robust memristor-based hybrid neural networks for electroencephalogram signal processing