Sodium Abundances in Very Metal-poor Stars
2023-09-03YuFuShenAlexeevaGangZhaoShuaiLiuZemingZhouHongliangYanHainingLiTianyiChenXiaodongXuHuilingChenHuaweiZhangandJianrongShi
Yu-Fu Shen,S.A.Alexeeva,Gang Zhao,ShuaiLiu,Zeming Zhou,Hongliang Yan,Haining Li,Tianyi Chen,Xiaodong Xu,Huiling Chen,Huawei Zhang,and Jianrong Shi
1 CAS Key Laboratory of Optical Astronomy,National Astronomical Observatories,Chinese Academy of Sciences,Beijing 100101,China;gzhao@nao.cas.cn,hlyan@nao.cas.cn,sjr@bao.ac.cn
2 School of Astronomy and Space Science,University of Chinese Academy of Sciences,Beijing 100049,China
3 Department of Astronomy,School of Physics,Peking University,Beijing 100871,China
4 Kavli Institute for Astronomy and Astrophysics,Peking University,Beijing 100871,China
Abstract Chemical composition of very metal-poor(VMP)stars can provide observational constraints on current models of nucleosynthesis and the chemical evolution of the Galaxy.It has been found that the scatter of[Na/Fe]versus[Fe/H]in VMP stars is very large in contrast with most other elements.Moreover,a negative slope in[Na/Fe]versus[Fe/H]was found for giants,which is very unlikely according to the theory of nucleosynthesis.For the sample of 93 VMP stars in the metallicity range-4.25 <[Fe/H]<-1.64 we obtained NLTE sodium abundances using the line profile fitting method by employing accurate atmospheric parameters determined when taking into account NLTE line formation for both Fe I and Fe II.Originally selected from the LAMOST low-resolution spectral database,the spectra of stars were obtained with the High Dispersion Spectrograph of the Subaru Telescope.For 57 turn-off stars in metallicity domain -3.04 <[Fe/H]<-1.64,we obtained mean [Na/Fe]=-0.29±0.14 and positive slope 0.09±0.06.For 21 giants distributed over metallicity -3.59 <[Fe/H]<-2.19,we found mean[Na/Fe]=-0.35±0.1 and positive slope 0.07±0.07.Our[Na/Fe]trend is lower by~0.2 dex,compared to the modern GCE model.We believe the GCE model should be adjusted,by considering the associated scatter.Twelve stars in our sample are found to be outliers,with too low or too high Na abundances.
Key words: techniques: spectroscopic–stars: abundances–stars: atmospheres
1.Introduction
The very metal-poor (VMP) stars are considered to be among the oldest stars in the universe,as they are believed to have formed from the remnants of the first generation of stars that died in supernova explosions.These early stars were composed mostly of hydrogen and helium,with minimal amounts of heavy elements.The supernova explosions of these stars enriched the interstellar medium with heavy elements,which later generations of stars incorporated into their atmospheres.Therefore,studying VMP stars can provide important clues about the early universe and the processes of stellar and Galactic evolution (Beers &Christlieb 2005;Frebel &Norris 2015;Nissen &Gustafsson 2018;Helmi 2020).Specifically,VMP stars are defined as having a metallicity less than about one-hundredth that of the Sun([Fe/H]<-2.0).
Sodium (z=11,Na) is an odd-Z element,mainly produced by Type II supernovae (Kobayashi et al.2020) and its production increases with increasing metallicity.Determining the sodium (Na) abundance in VMP stars is an important step in understanding the early universe and the processes by which galaxies and stars have evolved over time.The relative abundance of sodium to iron can provide insights into the conditions under which the first stars formed,as well as the mechanisms by which heavy elements were synthesized and distributed throughout the Galaxy.Understanding the abundance and distribution of sodium in VMP stars can help shed light on the processes by which galaxies and their constituent stars evolve over time.
Precision spectroscopy provides accurate and detailed information on VMP stars.Many spectroscopic campaigns have been conducted to study the chemical composition of VMP stars.The studies mainly focus on the abundance trends of [X/Fe] versus [Fe/H] for particular chemical element X,because these trends provide observational constraints on current models of nucleosynthesis and the chemical evolution of the Galaxy(e.g.,Spite&Spite 1978;McWilliam et al.1995;Cayrel et al.2004;Kobayashi et al.2006;Bensby et al.2014;Zhao et al.2016).Despite the large number of studies that have been conducted on the chemical abundances of stars,the problem of star-to-star scatter and systematic abundance shifts remains an active area of research in this field (Griffith et al.2023).
Sodium is one of the elements with the biggest star-to-star scatter about the mean trend in VMP stars.As an example,in a recent study by Lombardo et al.(2022),a significant scatter of 0.17 dex was reported for sodium in a sample of 52 giant stars spanning a metallicity range of -3.59 <[Fe/H]<-1.79.Li et al.(2022) studied a sample of VMP stars spanning a metallicity range of -4.3 <[Fe/H]<-1.7 and reported a scatter of approximately 0.2 dex for [Na/Fe] when measuring the dispersion around a linear fit.Andrievsky et al.(2007)investigated 53 stars in the -4.2 <[Fe/H]<-1.6 metallicity range and found in the turn-off stars and “unmixed” giants:[Na/Fe]=-0.21±0.13.However,when excluding mixed giants,whose atmospheres may have been polluted by sodium during their evolution,the scatter for the entire sample of stars(36 stars)was found to be larger with[Na/Fe]=-0.17±0.19.
The dispersion observed in average trends can arise from different enrichment events,such as those from core-collapse supernovae (CCSNe),Type Ia supernovae (SNe Ia),or asymptotic giant branch (AGB) stars.Measuring the intrinsic scatter can give an idea of the number and variety of enrichment events,the degree of mixing in the interstellar medium and the mixing of stellar populations with different enrichment histories (Vincenzo et al.2021).
Another reason for this scatter is that measuring the chemical abundances of stars is a complex and challenging task,and different methods and assumptions can lead to different results.For example,different studies may use different techniques for measuring abundances,leading to discrepancies in the derived abundances.The discrepancies can be due to spectral normalization,stellar parameters,and atomic data like oscillator strengths.
It appears that another issue is prevalent among the studies,namely,negative slope of[Na/Fe]along the-2.8 ≤[Fe/H]≤-1.5.For example,a negative slope of [Na/Fe](-0.02±0.08) is reported by Reggiani et al.(2017) in a sample of 23 metal-poor stars.It is highly unlikely to observe a negative slope in the evolution of[Na/Fe]since the production of sodium heavily depends on the initial metallicity of the progenitor stars.The authors suggested that the problem may be related to issues with non-local thermodynamic equilibrium(NLTE) treatment of the data.Similar negative slopes of [Na/Fe] were reported in other studies (e.g.,Li et al.2022:-0.11±0.07 for giants).
NLTE effects are known to have a substantial influence on the spectral lines,particularly on the Na I resonance lines at 5890 and 5896 Å,which are commonly used for measuring the Na abundances in VMP stars.NLTE effects can lead to an overestimation of the Na abundance when using local thermodynamic equilibrium (LTE)-based analyses,especially in metal-poor giants where NLTE effects are more pronounced(e.g.,Li et al.2022;Lombardo et al.2022).The NLTE approach can help to reduce systematic errors in the derived Na abundances.
In this study,we present the Na abundances in a sample of 93 VMP stars by employing their high-resolution spectra and following an accurate analysis technique.The sample is selected starting from Aoki et al.(2022),Li et al.(2022).The sample is comprised of a range of 67 turnoff stars and 26 giants,uniformly distributed across the-4.3 ≤[Fe/H]≤-1.5 metallicity range,which is appropriate for research into Galactic chemical evolution (GCE).
A consistent set of effective temperatures (Teff),surface gravities (logg),metallicities,and microturbulence velocities(ξmic) was obtained using lines from two ionization stages of iron,Fe I and Fe II.Our study benefits from taking into consideration the NLTE line formation for both Fe I and Fe II.NLTE line profile fitting is employed to determine the abundance of each individual Na I line,with departure coefficients calculated for the specific physical parameters of the star using classical one-dimensional (1D) model atmospheres.The model atom for Na I used in this work was treated and tested by Alexeeva et al.(2014).
Our goal is to minimize observational scatter and measure the intrinsic scatter as accurately as possible.We analyze outliers,such as Na-rich and Na-poor stars,to determine the possible reasons for their “anomalous” abundance.
The paper is organized as follows.Section 2 describes the observation of the spectra,target selection,and the stellar parameters we used.Section 3 addresses the determination of Na abundance.Section 4 discusses the GCE.The conclusions are given in Section 5.
2.Observations,Parameters,and Stellar Sample
2.1.Observations
Our sample of VMP stars was selected from the Large sky Area Multi-Object fiber Spectroscopic Telescope (LAMOST,Zhao et al.2006;Cui et al.2012;Zhao et al.2012;Liu et al.2015;Yan et al.2022)low-resolution(R~2000)spectroscopic database as metal-poor candidates(Li et al.2018)and followed up with high-resolution spectroscopy(Aoki et al.2022;Li et al.2022)utilizing the High Dispersion Spectrograph(HDS)of the Subaru Telescope (Noguchi et al.2002;Sato et al.2002)through the JSPS-CAS Joint Research Program.High-resolution(R=36,000)spectra have wavelength range 4030–6800 Å with signal-to-noise ratio (SNR) more than 60.
We determine the locations of our sample stars based on the parallaxes given by Gaia Data Release 3 (DR3,Gaia Collaboration et al.2016,2022).We first convert the coordinates to Cartesian coordinates with the Sun as the center,and then make the Galactic center the coordinate center through translation.The Sun is placed atx=-8 andy=z=0.The Galactic locations of our sample are depicted in Figure 1.The positions of the stars in thex–yand thez–rGCplanes are also displayed in Figure 2.The star J1313-0552 (#51) is not included in Figure 2 due to extremely outlying coordinates.Coordinates and information about observations can be found in Table A1.

Figure 1.The locations for our sample of stars in the Galactic coordinates.

Figure 2.The positions of the VMP stars in the x–y plane(upper panel)and the z–rGC plane (bottompanel),wherex,yand z are the directions of the Cartesian system ofGalacticcoordinates,and The Sun is located atthe intersection of the dashed lines (x=-8, y=0, z=0).Some special stars are marked by the numbers.The number of the star follows its number from Table A1.
2.2.Stellar and Kinematic Parameters
Stellar parametersTeff,logg,and ξmicwere determined in this study applying different methods,including the spectroscopic one based on the NLTE analysis of lines of Fe I and Fe II.The stellar and kinematic parameters are listed in Table B1.The details of the determination of stellar parameters will be reported in Shi et al.(2023,in preparation).
The kinematic parameters:parallax,proper motion,and radial velocity are taken from Gaia DR3.A few radial velocities of stars are not provided by Gaia,so we use the radial velocities determined by spectra instead.We focus on space velocity components(U,V,W),whose calculation is based on Johnson&Soderblom (1987).According to Figure 3,16 stars within the circle with radius 180 km s-1can be referred to as belonging to the thick disk,while the remaining 77 stars belong to the Galactic halo (Venn et al.2004).The star J1313-0552(#51) is not included in Figure 3 due to its extremely high velocity components (U=-1695 km s-1,V=-84 km s-1,W=85 km s-1).

Figure 3. UVW velocity diagram for our sample of stars,except for #51.The dashed line is part of a circle whose radius is 180 km s-1.The markers are the same as Figure 2.
2.3.Stellar Sample
We have 93 metal-poor stars with metallicity range-4.25 <[Fe/H]<-1.64.Most of our sample stars (88) are in the metallicity range -3.14 <[Fe/H]<-1.64.
Among 93 stars,26 of them are giants and another 67 are turn-off stars.TheTeff–loggdiagram is shown in Figure 4.

Figure 4. Teff versuslogg of 93 stars.The solid line islogg=2.4,which is the most important basis for distinguishing between giants (blue) and turn-off stars (black).The other markers are the same as in Figure 2.
3.NLTE Sodium Abundance
3.1.Method of Calculation
The 1D model atmospheres for givenTeff,logg,and [Fe/H]were calculated using the code MARCS(Gustafsson et al.2008).The opacity-sampling (OS) code is based on the opacity distribution function (ODF) version of Gehren (1979).
The model atom of Na I and the adopted atomic data are described in Alexeeva et al.(2014).To solve the radiative transfer and statistical equilibrium equations,we used the code DETAIL (Butler &Giddings 1985) based on the accelerated Λiteration method (Rybicki &Hummer 1991).Theoretical NLTE spectra were calculated with the code SYNTHV_NLTE(Tsymbal et al.2019)using the obtained departure coefficientsbi=nNLTE/nLTE.Here,nNLTEandnLTEare the statistical equilibrium and thermal (Saha–Boltzmann) number densities,respectively.
To examine theoretical stellar spectra and compare them to observations we employed widget program BINMAG5http://www.astro.uu.se/~oleg/binmag.html(Kochukhov 2018).BINMAG interfaces with mounted code SYNTHV_NLTE which allows obtaining the best LTE and NLTE fits to the observed line profiles automatically to determine chemical abundances with high precision.
3.2.NLTE Sodium Abundance
In spectra of VMP stars,only the resonance doublet of Na I lines at 5889.95 and 5895.92 Å can be used to measure Na abundance.The adopted atomic data for these lines are given in Table 1.Both LTE and NLTE abundances were derived using line profile fitting.Figure 5 illustrates the quality of the fits for 5889 Å and 5895 Å lines in three representative stars:J0119+2425(Teff/logg/[Fe/H]=6412/4.27/-2.56),J0232+0545 (6091/4.08/-2.16),and J0626+6032 (5926/3.77/-2.18).It is worth noting that in some cases only one Na I line is available,because the second line is affected by interstellar medium Na I lines.The lines with visual asymmetry were discarded.The deduced abundances of 93 VMP stars are listed in Table C1.An error=0.0 means that the error is less than 0.01.The trend of[Na/Fe]along[Fe/H]is displayed in Figure 6.

Table 1The Line List Used in this Work

Figure 5.Best NLTE fits(solid curves)of the observed spectra of three representative stars(filled circles).The LTE profiles were computed with the corresponding NLTE abundances and are shown by dashed curves.

Figure 6.[Na/Fe] versus [Fe/H] determined in this work.The gray dashed line is the GCE model from Kobayashi et al.(2020).The markers are the same as in Figure 4.
The NLTE [Na/Fe] abundances are lower than the LTE abundances,on average,by 0.46 dex.Average value of[Na/Fe]NLTE=-0.28±0.23,while [Na/Fe]LTE=+0.18±0.32.Applying the NLTE approach leads to a decrease in the error of the average value for [Na/Fe].
3.3.Abundance Uncertainties
We calculate the abundance uncertainties by changing parameters by +80 K inTeff,+0.07 dex inlogg,and +0.1 km s-1in ξmicin atmospheres of two stars J1432+3755 (4585/1.34/-3.12) and J0244+0828 (6472/4.39/-2.26) (Table 2).These two stars are from our sample with the highest and lowest temperature we chose as an example.The total error was calculated by assuming all of the individual errors to be independent.In the atmosphere of a cool giant,the errors in[Na/Fe I]due to the uncertainties inTeffandloggare small compared to those of a hotter dwarf.

Table 2Sensitivity of the [Na/Fe] Abundance to the Atmospheric Parameters,Δ log ∈ Na,For Two Representative Stars,J1432+3755(4585/1.34/-3.15)and J0244+0828 (6472/4.39/-2.26)
3.4.Test on Determination of Sodium Abundances
We test the robustness of our sodium abundance determination to ensure the accuracy and reliability of our determination of sodium abundances in stars.Figure 7 displays differences in the Na abundances obtained from the two Na I lines used in this study.The abundances obtained from two lines show good agreement,with differences typically below 0.06 dex.However,there may be a very weak dependence of the [Na/Fe] onTeffand ξmic(Figure 8).

Figure 7.“5889–5895” means A(Na I 5889.95 Å)–A(Na I 5895.92 Å).The dashed line shows the average.The markers are the same as in Figure 4.
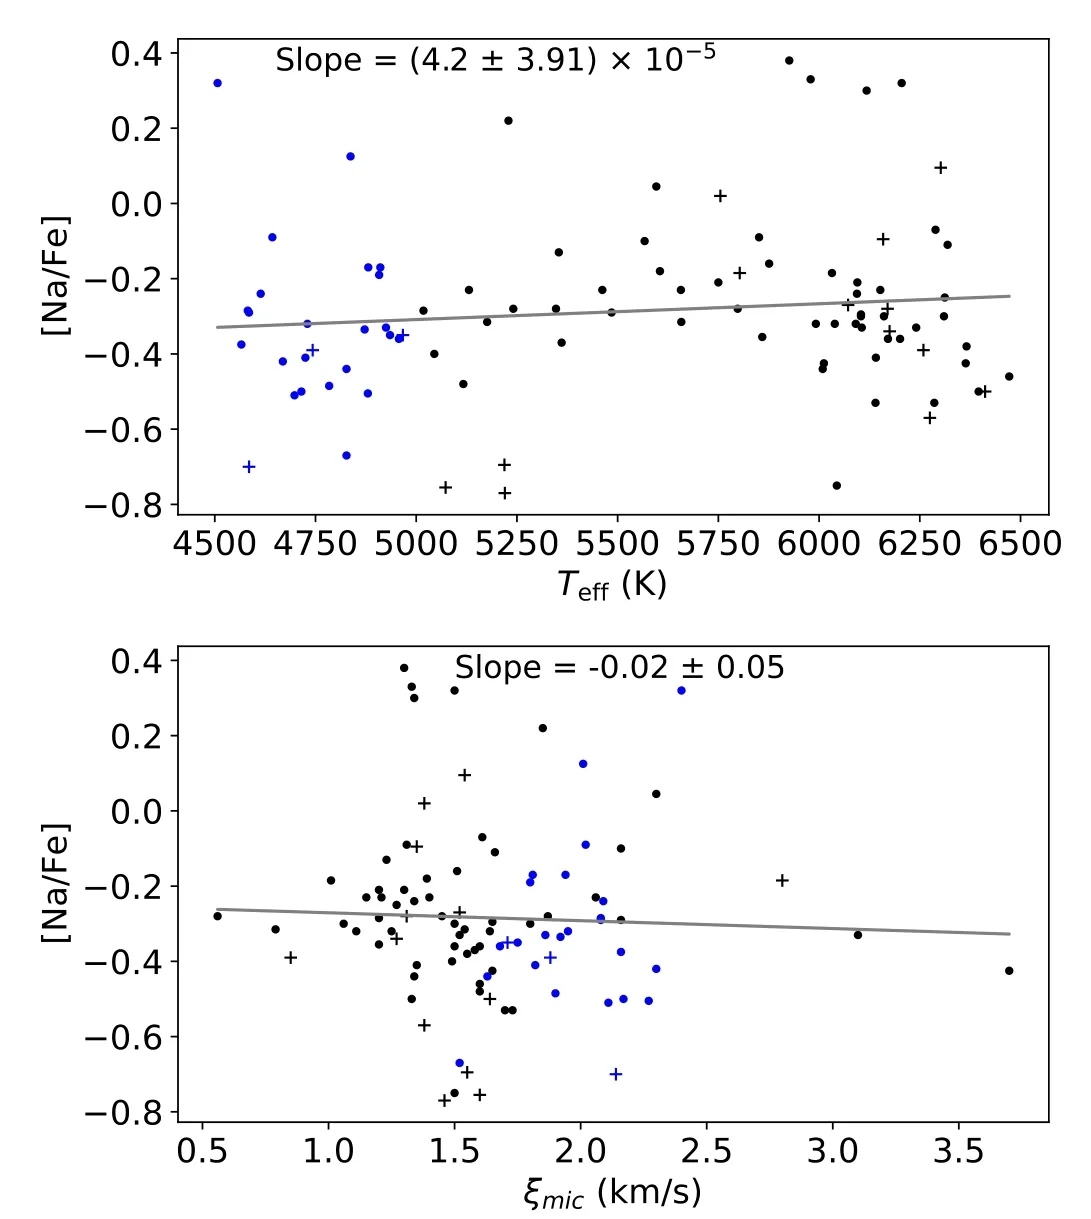
Figure 8.[Na/Fe] as a function of Teff (upper panel) and ξmic (bottom panel).The solid lines represent linear fits.The markers are the same as in Figure 4.
3.5.Differences Between LTE and NLTE
For our sample of stars,the NLTE abundance effects(defined asfor both lines,5889.95 and 5895.92 Å,are from -0.03 to -0.79 dex,depending on the stellar parameters.NLTE abundance effects mainly depend on metallicity (Figure 9).They are small if[Fe/H]<-3.5 and become larger in absolute value with increasing [Fe/H] from -3.5 to -2.0 dex.On one hand,in metal-poor stars,the density of particles is low so particles collide insufficiently,and the NLTE effect should be stronger.The difference between LTE and NLTE of metal-poor stars is much stronger than relatively metal-rich stars,which could be found in previous works(e.g.,Gehren et al.2006).On the other hand,with low metallicity,the line formation region for investigated lines is moving toward deeper layers,where LTE prevails.Below,we present an explanation of why in the atmospheres with [Fe/H]<-3.5 NLTE effects become weaker.

Figure 9.ΔNLTE versus [Fe/H].The line is the linear fit.The markers are the same as in Figure 4.
Figure 10 presents the departure coefficients for the three Na I levels in the atmospheres of two stars,J1231+5243(5755/3.67/-1.98)and J1253+0753(5750/3.73/-3.96).The stars have closeTeffandlogg,and the difference in [Fe/H] is almost 2.0 dex.It allows us to focus on the metallicity effect.

Figure 10.Departure coefficients b and bu/bl(upper level/lower level)for Na I versus optical depth.The parameters of the models are given on the top of the panels,in Teff (K)/logg/[Fe/H] format.Two vertical lines indicate the line formation regions for the cores of Na I 5889.95 and 5895.92 Å lines.
We know that flux depends on two functions: the source functionSνand the optical depth τν.For lines in the visual and ultraviolet (UV) region,we have
whereBνis the Planck function,andbuandblare departure coefficients for the upper (u) and lower (l) energy levels for transition l->u respectively.
In addition,τνdepends on opacity χν,and we have
so,whenbl>1 and (or)bu/bl<1,an NLTE strengthening of the line occurs.
As shown in the left panels of Figure 10,in model atmosphere 5755/3.67/-1.98,the Na I line at 5889 Å forms in layers around logτ5000=-2.75,wherebl=3.4,andbu/bl=0.32 <1.Both factors lead to a strengthening line in NLTE,and ΔNLTE=-0.56 for the line at 5889 Å.
In the model atmosphere 5750/3.73/-3.96,the Na I line at 5889 Å forms in deeper layers around logτ5000=-2.4,wherebl=1.25,andbu/bl=0.82 <1,and both factors also lead to a strengthening line in NLTE,and ΔNLTE=-0.04.The absolute value of ΔNLTEbecomes less with decreasing metallicity from-2.0 to -3.0 dex,because (1) the line formation of Na I lines moves toward deeper layers,where NLTE effects are weaker;(2)the departure coefficients of the lower level drop to smaller values.
4.The Galactic Chemical Evolution
The abundance trend of [Na/Fe] versus [Fe/H] determined in this work is shown in Figure 6.We compare our result with the GCE model (gray dashed line) from Kobayashi et al.(2020).GCE models consider that [Na/Fe] and [Fe/H] are positively correlated in metal-poor stars.We examine the slopes and mean [Na/Fe] values in the sample of stars,which was segregated into turn-off and giant stars (Figure 11).Some outliers are considered when examining the slopes and mean values.Stars with [Na/Fe]≥+0.1 are named “Na-rich” and stars with [Na/Fe]≤-0.67 are named “Na-poor.” For turn-off stars within the metallicity range of -3.04 to -1.64,we determine a slope of 0.17±0.06 when excluding only Na-rich stars,and a slope of 0.09±0.06 when excluding all outliers.The mean value of[Na/Fe]does not depend much on whether we take into account Na-poor stars or not and consists of-0.32±0.18 and -0.29±0.14,respectively.A similar result is obtained for giants.In the sample of 23 giants(Na-rich stars are excluded) in metallicity range -3.64 <[Fe/H]<-2.19,the slope is 0.12±0.08 with mean value -0.38±0.14.The scatter decreases after excluding two Na-poor stars resulting in the slope 0.07±0.07 and mean [Na/Fe] is -0.35±0.1.All obtained slopes are positive and results for turn-off stars and giants are consistent within the error bars.
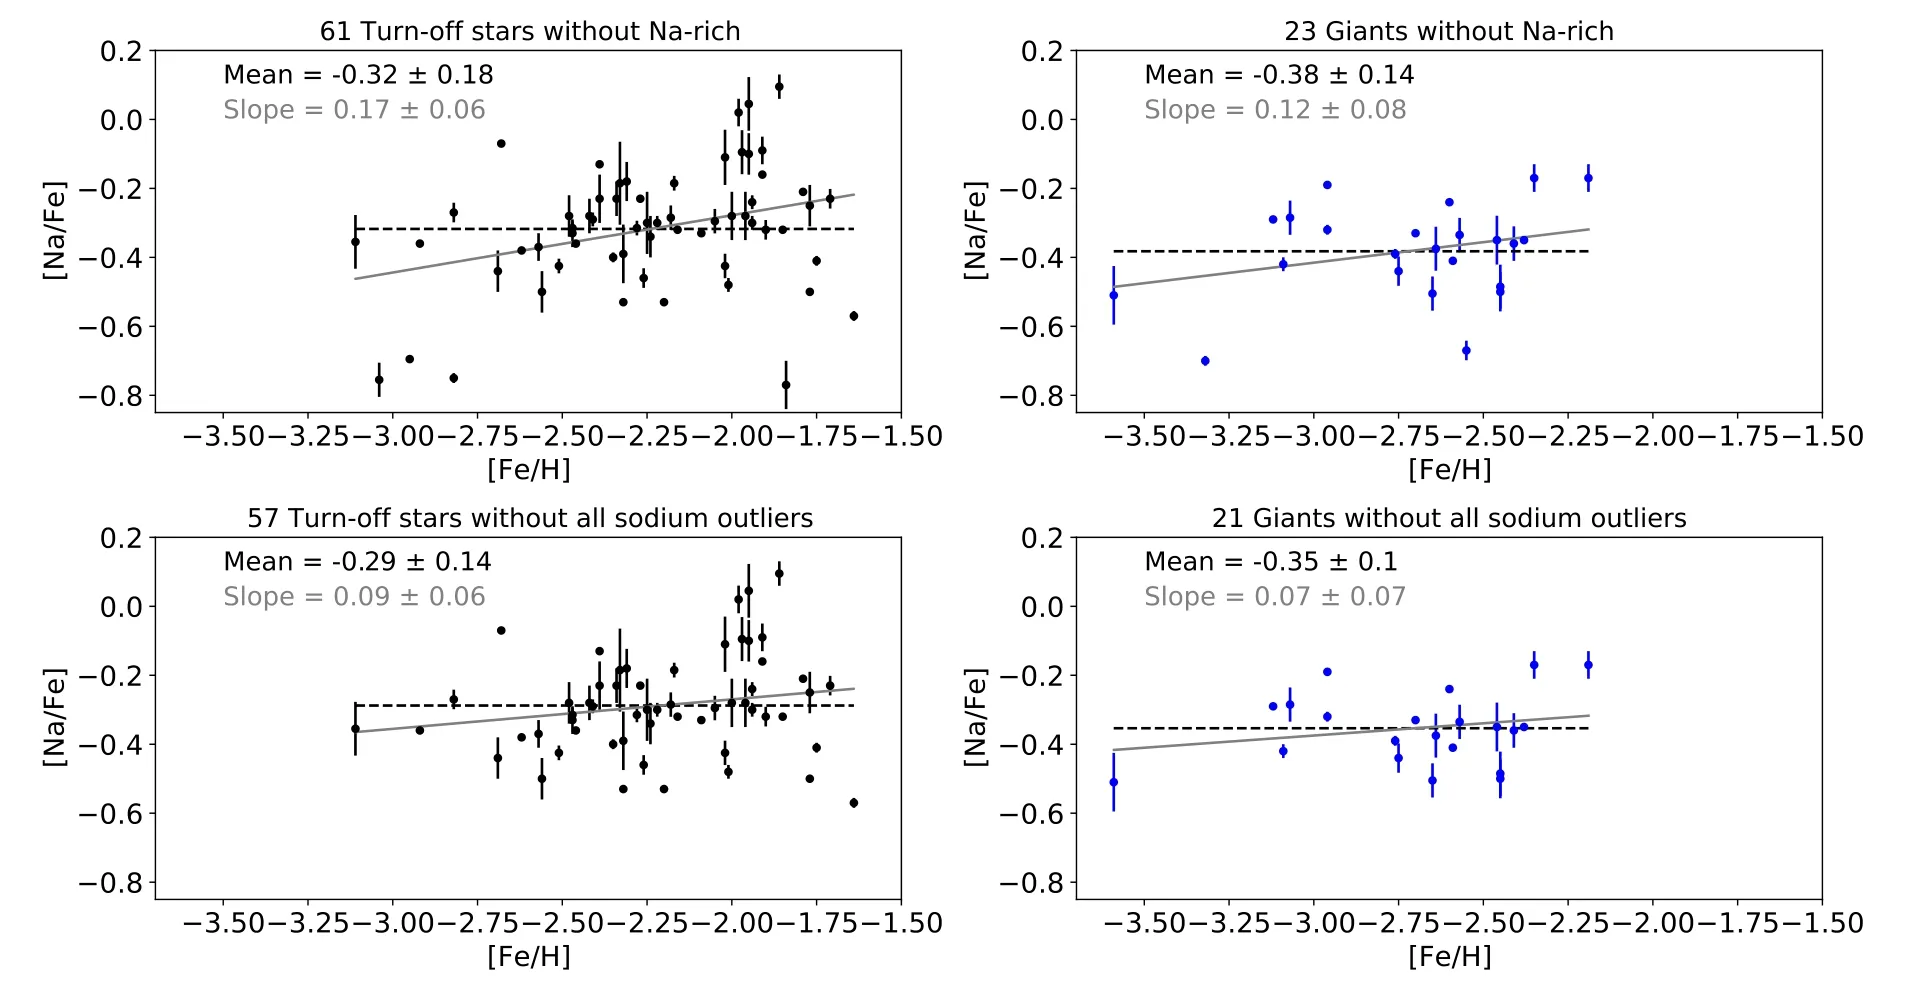
Figure 11.[Na/Fe]versus[Fe/H]in our sample stars,segregated into turn-off(left panels)and giant(right panels)stars.Two stars with[Fe/H]<-3.7 are excluded.The linear fits (gray solid lines) and averages (black dashed lines) of them are given.

Figure 12.[Na/Fe] versus [Fe/H] for our sample stars is marked by red squares (TW means this work).For comparison,we present data from literature: M17:Mashonkina et al.(2017);Z16: Zhao et al.(2016);R20: Reggiani et al.(2017,2020);and K20 is the GCE model given by Kobayashi et al.(2020).

Figure 13.Comparison of our trend of[Na/Fe]versus[Fe/H]with data from literature.TW means this work,A07 is Andrievsky et al.(2007),and L22 is Lombardo et al.(2022).The averages are indicated by the dashed lines.One outlier ([Na/Fe] >1.5) of Andrievsky et al.(2007) is excluded.
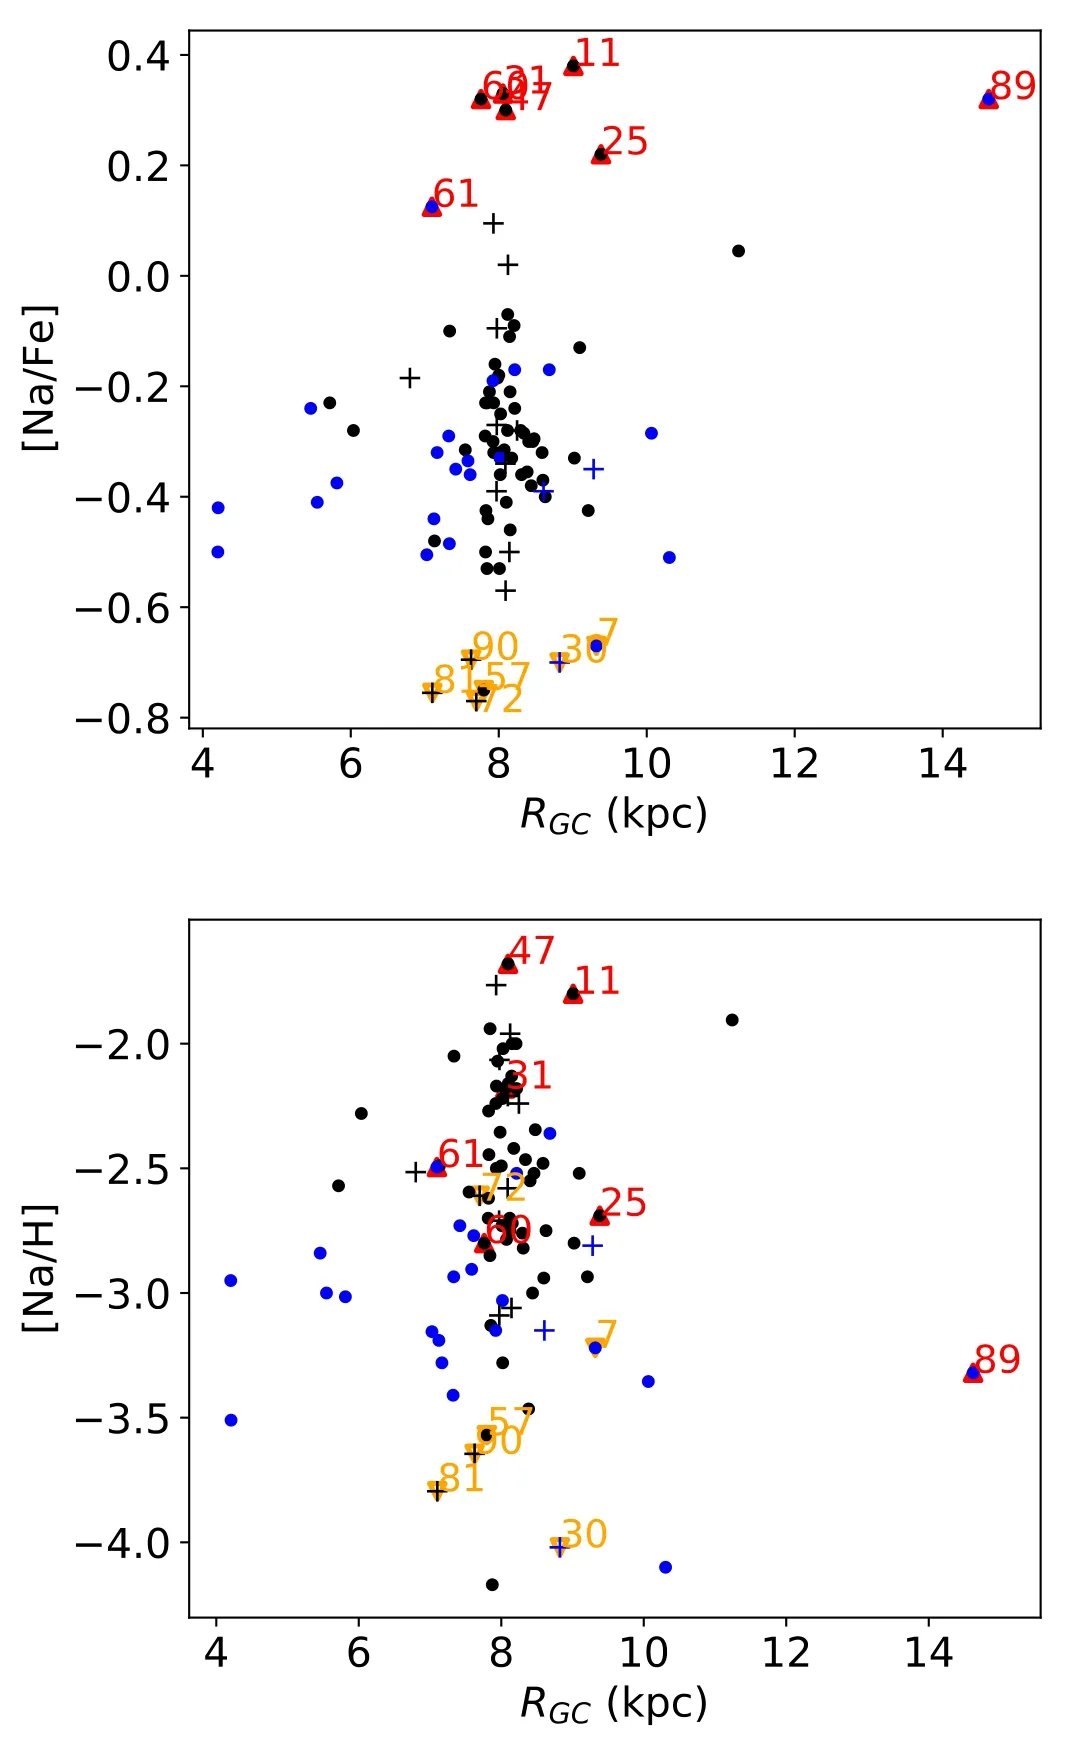
Figure 14.RGC versus[Na/Fe](upper panel)and[Na/H](lower panel)for our sample of stars.The markers are the same as in Figure 4.
The star-to-star standard deviation of[Na/Fe]in this work is 0.233 dex in case all 93 stars are taken into account.If we exclude the six Na-rich stars and the six Na-poor stars mentioned in Section 4.2,the scatter is reduced to 0.14 dex.However,even if the scatter is~0.14 dex,it is still larger than the scatter for stars with [Fe/H] >-1.5.
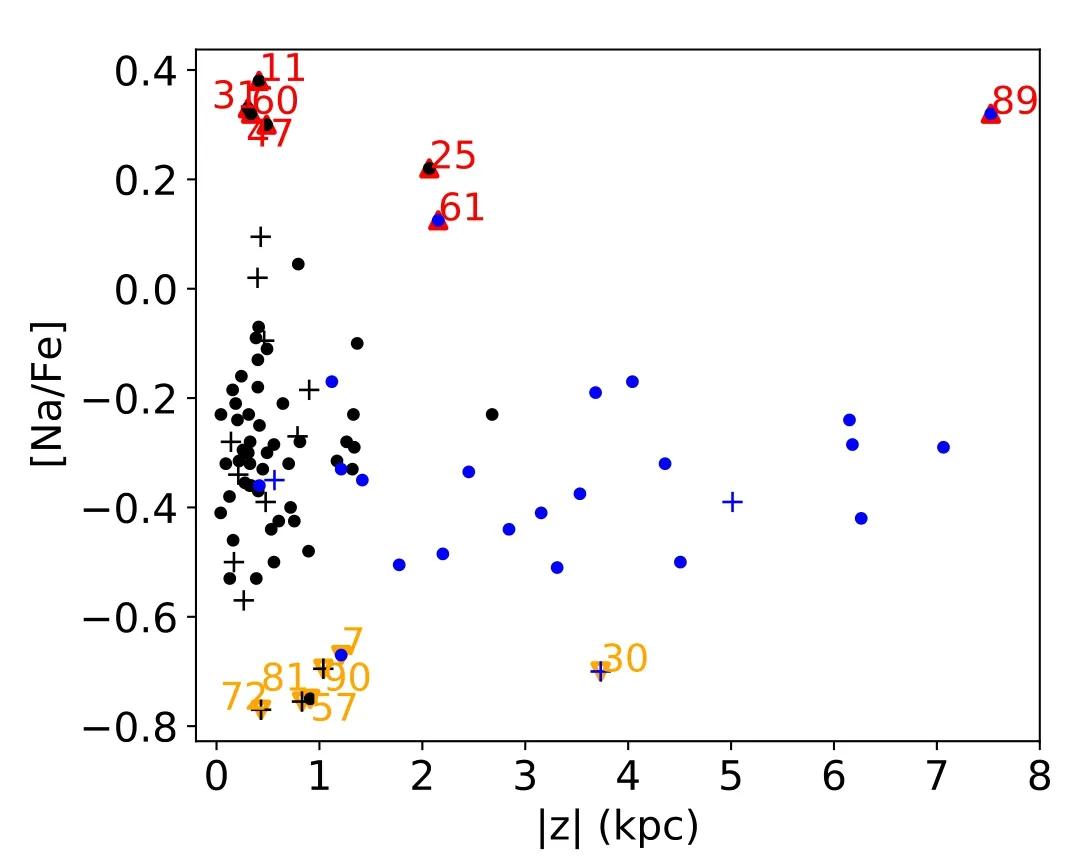
Figure 15.|z| versus [Na/Fe] (upper panel) and [Na/H] (lower panel) for our sample of stars.The markers are the same as in Figure 4.
Figure 12 displays our sample as well as samples from previous works,along with the prediction provided by the GCE model (Kobayashi et al.2020).It appears that the GCE model overestimates the [Na/Fe] ratio in stars with [Fe/H] between-3.0 and -2.0.In fact,this problem has already appeared in some of the previous samples;two previous works find a higher average (Andrievsky et al.2007;Lombardo et al.2022),and we will discuss this in detail in the next subsection.
4.1.Test on HD 122563
The comparison between our NLTE sodium abundances in 93 VMP stars and those from literature,specifically 33 VMP stars from Andrievsky et al.(2007) and 52 VMP stars from Lombardo et al.(2022)are displayed in Figure 13.Our sample of 93 stars has a mean value of -0.28±0.23,which is 0.19 dex lower than the mean values reported in those two studies.
In order to gain a better understanding of the systematic shift observed in our [Na/Fe] abundances compared to Andrievsky et al.(2007),we conducted test calculations based on VMP star HD 122563 with well-determined stellar parameters (4600/1.40/-2.55/1.6).HD 122563 is widely recognized as a benchmark star,especially in the context of Gaia mission calibration and testing of spectroscopic and asteroseismic analysis techniques.This star is also presented in Andrievsky et al.(2007),where different physical parameters were used,such asTeff=4600 K,logg=1.1,[Fe/H]=-2.82,and microturbulence=2.0 km s-1.Applying our method with the same physical parameters as Andrievsky et al.(2007),we found a value of [Na/Fe]=-0.20 dex,very close to that of Andrievsky et al.(2007),who found [Na/Fe]=-0.23 dex.It means that our NLTE treatment of Na I lines is similar to that used in the study by Andrievsky et al.(2007).
Using our adopted physical parameters of HD 122563(4600/1.40/-2.55/1.6),we obtained an [Na/Fe] value of-0.31 dex,which is 0.11 dex lower compared to the value reported by Andrievsky et al.(2007).If we compare the parameters between Andrievsky et al.(2007)and our study,we can see that the main difference is in the metallicity.In Andrievsky et al.(2007),the metallicity was 0.27 dex lower than in our study and an LTE abundance was used for iron.Underestimation of iron leads to an underestimation of[Fe/H]and an overestimation of[Na/Fe].In addition,Lombardo et al.(2022)also determine NLTE Na abundances of 26 species,and reach an average that is consistent with Andrievsky et al.(2007),as affirmed in Figure 13.The parameters used in Andrievsky et al.(2007),Lombardo et al.(2022)are both LTE parameters.
The results of this test indicate that the systematic shift observed in the [Na/Fe] trend is primarily caused by differences in the sets of stellar parameters considered,particularly the metallicity derived from NLTE and LTE-based methods.
4.2.Special Stars
We distinguish some outliers (Table 3).Seven stars with[Na/Fe]≥+0.1 appear to be “Na-rich” and six stars with [Na/Fe]≤-0.67 are identified as “Na-poor.”
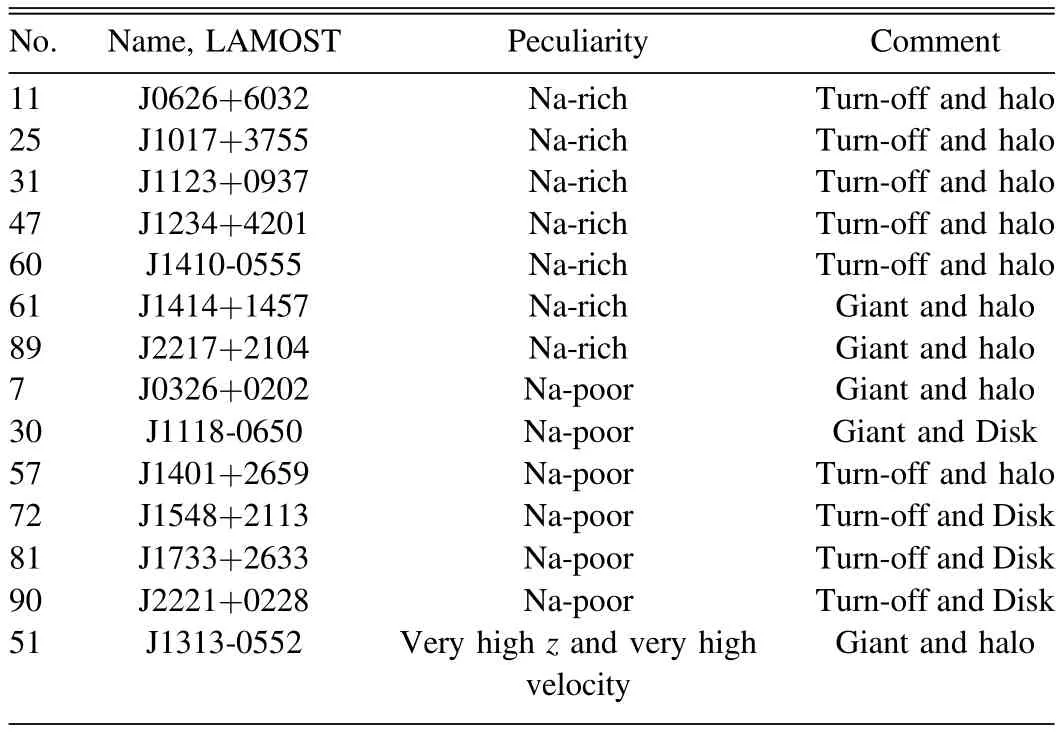
Table 3The List of Some Special Stars
Star #61 and 89 are two giants and suspected to have suffered a mixing between the atmosphere and the H-burning shell bringing the products of the Ne-Na cycle to the surface.Five out of six “Na-rich” stars are turn-off stars: #11,25,31,47,and 60 (Figure 4).It is difficult to explain their sodium overabundance by an evolutionary effect.We analyzed their kinematics and positions.Figures 14,15,and 16 respectively representRGC,|z|,and total angular momentum(L=whereLx=y*W-z*V,Ly=z*Ux*W,Lz=x*V-y*U) versus [Na/Fe] and [Na/H] for our sample of stars.Four stars #11,25,31,and 47 are relatively close to each other on theUVWdiagram (Figure 3);they have similarRGC,|z|,andL.We believe that they have merged from neighboring galaxies and their chemical enrichment history is different.
The whole sky looked like gold, while violet and rose-colored clouds, which she could not describe, floated over her; and, still more rapidly than the clouds, flew a large flock of wild swans12 towards the setting sun, looking like a long white veil across the sea
Another possible explanation of their sodium overabundance is that the stars have undergone a process of metallicity enrichment,where they have accreted material from a companion star that has already gone through nuclear fusion and produced sodium.This would result in an overabundance of sodium in the star’s atmosphere compared to other stars of similar age and mass.We have tried to find evidence that these stars are binaries.However,we have not yet found evidence that these stars are binaries.All seven Na-rich stars were excluded when calculating the average [Na/Fe] and slope of our sample.
Stars #7,30,57,72,81,and 90 are Na-poor stars.Four of them belong to the thick disk.They have lower velocity components than the other stars in our sample(Figure 3).They also have closeL~1000 km s-1kpc(Figure 16).From above,we think those Na-poor stars may be old thick disk stars.

Figure 16.Total angular momentum (L) versus [Na/Fe] (upper panel) and[Na/H] (lower panel) for our sample of stars.The markers are the same as in Figure 4.
Star#51 was also included in the list of outliers.It is a giant with very highz=70.73 kpc,and extremely high velocity components.However,its [Na/Fe] is -0.09,which is very close to the vast majority of our sample.Star#51 is not shown in the diagrams involving coordinates or kinematic parameters.
5.Conclusion
Using accurate stellar parameters and high-resolution(R=36,000) stellar spectra obtained with the HDS of the Subaru Telescope,we calculated the NLTE sodium abundances in a sample of 93 stars with the -4.25 <[Fe/H]<-1.64 metallicity range.The sample of stars used in this study allows us to trace the properties of the Galactic halo and thick disk stars.Based on kinematics,most of the stars(77)belong to the halo.This is the first study devoted to sodium in VMP stars homogeneously distributed in metallicity range from -4.2 to-1.6 dex appropriate for Galactic chemical evolution research.
The synthesis method was utilized to determine the NLTE sodium abundances for each individual Na I resonance line.Departure coefficients,which were calculated for the specific physical parameters of each star using classical 1D model atmospheres,were taken into account during the abundance determination process.It has been demonstrated that the abundance differences between NLTE and LTE are diminishing as metallicity decreases from -2 to -4,which is in line with previous NLTE studies,e.g.,Baumueller et al.(1998).
The abundance trend of [Na/Fe] versus [Fe/H] obtained in this study has positive slope in the [Fe/H] range of -3.04 to-1.64 that is in accordance with prediction of the GCE model.For two groups of stars,turn-off and giants,we found slopes,0.09±0.06 and 0.07±0.07,respectively.However,mean[Na/Fe] is lower than expected by the GCE model in the[Fe/H] range of -3.04 to -1.64.
We believe there is an intrinsic scatter of Na abundances,so the GCE model needs to be adjusted,not only the average,but also considering the scatter.We have measured the intrinsic scatter as 0.14 dex for 57 turn-off stars in our sample and 0.12 dex for 21 giants.
Among 93 stars,we find 13 outliers:seven Na-rich stars and six Na-poor stars.Five Na-rich turn-off stars may have extragalactic origins,however,it is difficult to make a solid conclusion.We also find a VMP giant with extremely high velocity components and very high-z.However,its sodium abundance is closer to the mean[Na/Fe]value obtained for the whole sample.
Acknowledgments
This research was funded by the National Natural Science Foundation of China (NSFC,Grant Nos.11988101 and 11890694),and the National Key R&D Program of China No.2019YFA0405502.This work was based on observations carried out with the High Dispersion Spectrograph (HDS) of the Subaru Telescope through the JSPS-CAS Joint Research Program.We made use of the SIMBAD and VALD databases.
Software:DETAIL (Butler &Giddings 1985);SYNTHV_NLTE(Tsymbal et al.2019);BINMAG (Kochukhov 2018).
Appendix A Sample Stars

Table A1Locations and Magnitudes of our Sample
Appendix B

Table B1Stellar Parameters and Kinematic Parameters of our Sample
Appendix C Sodium Abundance of the Stars

Table C1Sodium Abundances of our Sample
ORCID iDs
杂志排行

Research in Astronomy and Astrophysics的其它文章
- Unveiling the Initial Conditions of Open Star Cluster Formation
- The Spin Measurement of MAXI J0637-430: a Black Hole Candidate with High Disk Density
- The Chromatic Point-spread Function of Weak Lensing Measurement in the Chinese Space Station Survey Telescope
- Evaluation of Coronal and Interplanetary Magnetic Field Extrapolation Using PSP Solar Wind Observation
- Speckle-interferometric Study of Close Visual Binary System HIP 11253(HD 14874) using Gaia (DR2 and EDR3)
- Asteroseismology of 16 Kepler Solar-like Stars: Stellar Parameters and the Effects of Element Diffusion