Comprehensive Evaluation of Wheat Varieties in Southern Shandong Province by DTOPSIS Based on Entropy Weighting
2023-08-02JingWANGLingguoKONGBaoqiangLILongLIGuoqiangFANZhongxinZHOUQingfengFAN
Jing WANG, Lingguo KONG, Baoqiang LI, Long LI, Guoqiang FAN, Zhongxin ZHOU, Qingfeng FAN
1. Linyi Academy of Agricultural Sciences, Linyi 276012, China; 2. Zhongnong Tiantai Seed Industry Co., Ltd., Pingyi 273300, China
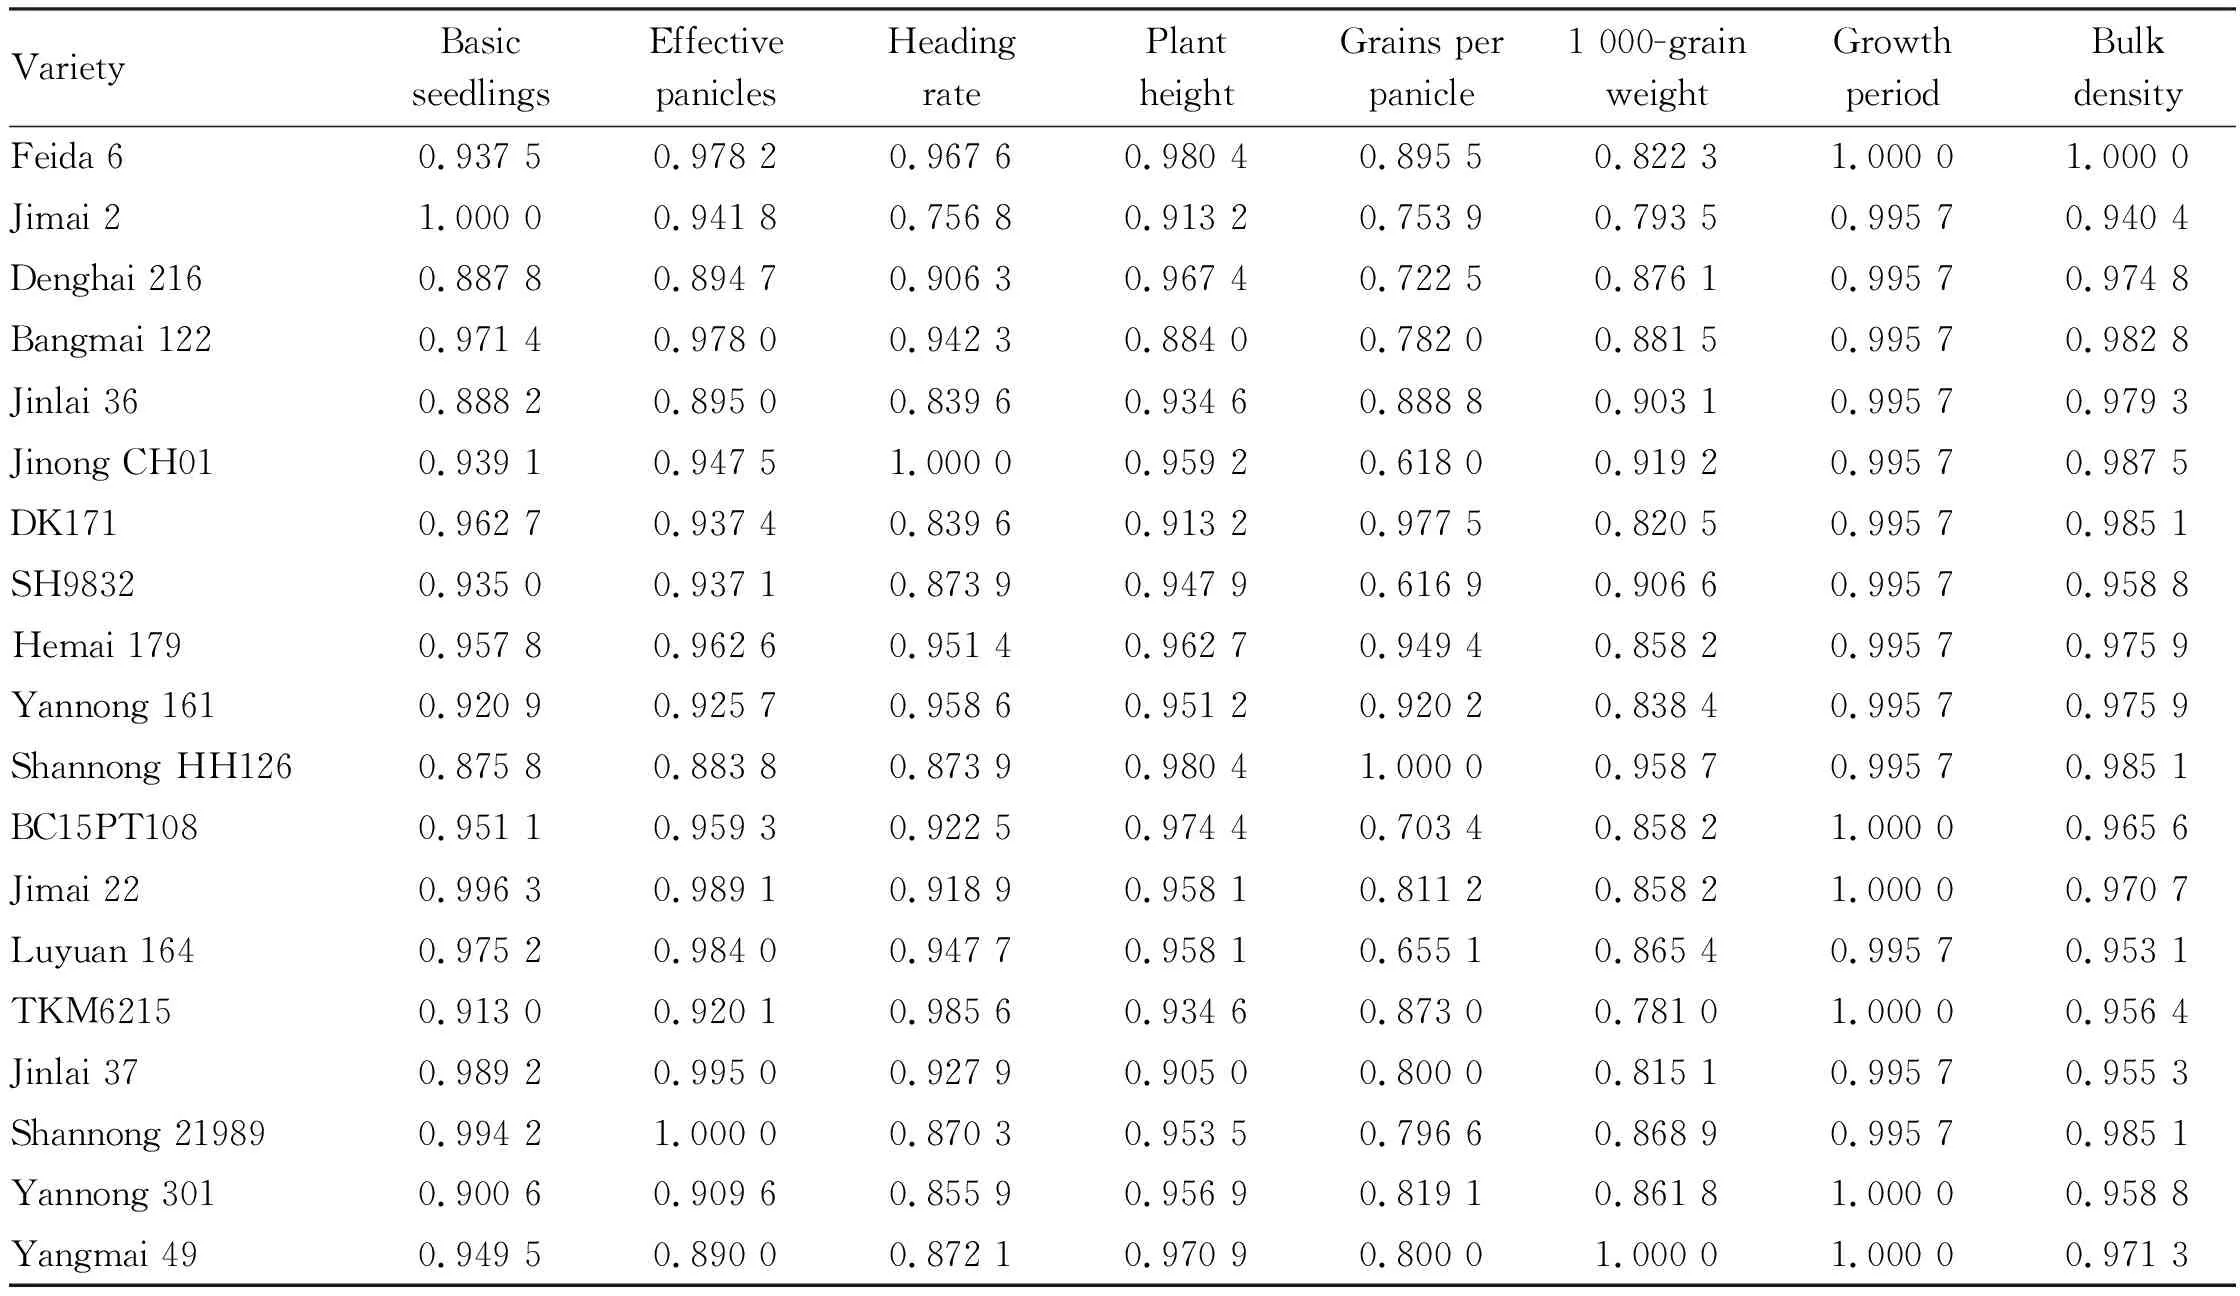
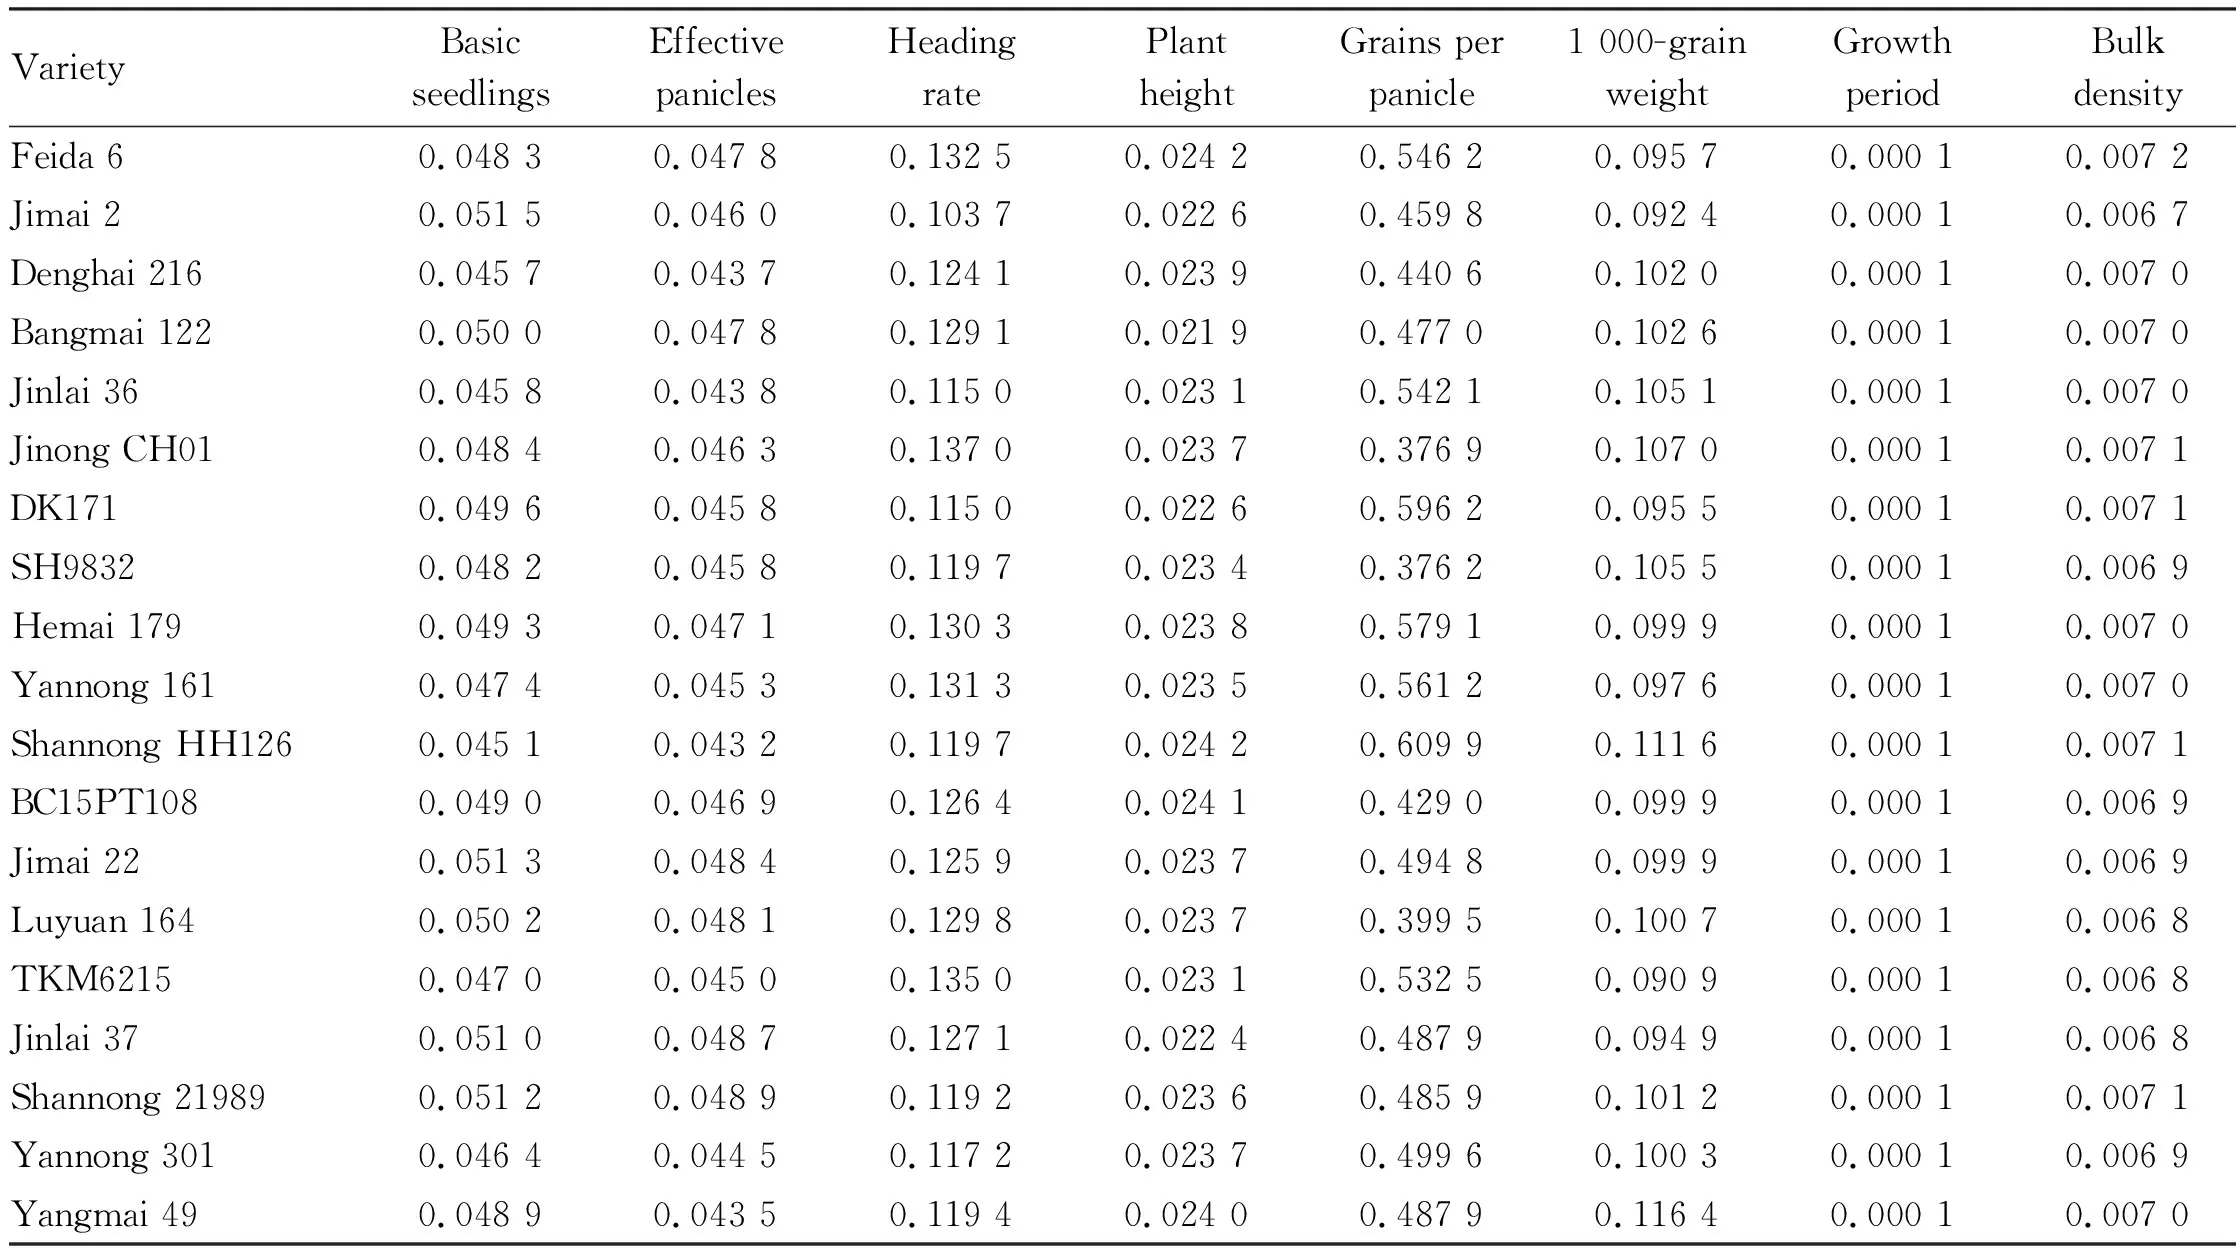
Abstract [Objectives] To screen a new wheat variety suitable for planting in southern Shandong Province. [Methods] The DTOPSIS based on entropy weighting was used to comprehensively evaluate 9 traits of 19 wheat varieties planted in southern Shandong Province. [Results] The weight of each indicator from low to high was growth period Key words Wheat, Comprehensive evaluation, DTOPSIS, Entropy Wheat is one of the three major food crops in the world, and it is also the most important food crop in China. According to statistics, not only the wheat planting area accounted for more than 50% of China’s grain planting area, but also the total wheat yield exceeded 50% of China’s grain yield, so wheat production is of great significance to China’s food security and farmers’ income[1]. The annual planting area of wheat in southern Shandong Province is more than 1.4 million ha, accounting for 36.9% of the total wheat planting area in the whole province[2], so the south of Shandong Province is an important wheat planting area in Shandong Province. Because of the natural environment and human factors, the adaptability of wheat varieties to different regions is also different. In view of the ecological environment traitistics of southern Shandong Province, it is of great significance to accurately, scientifically and comprehensively analyze and evaluate wheat varieties for the breeding and application of new wheat varieties[3-4]. For many years, the evaluation of wheat varieties has been based on yield as an important measure. Other agronomic traits are for reference only. As a result, the indicators would not be compared uniformly, and some even contradict each other, which is not conducive to the comprehensive evaluation of crop varieties to a certain extent, and affects the large-scale popularization of new wheat varieties. Comprehensive evaluation of multiple traits is an important part of modern breeding. The comprehensive performance of varieties depends on the performance of multiple traits. Only the varieties with excellent comprehensive performance have the value of popularization and application. The evaluation of comprehensive performance of varieties is the basis of popularization and application of new varieties. The DTOPSIS method is an evaluation method proposed by Yao Xingtao[5]in 1994. It uses multi-objective decision-making to quantify the fuzzy indicator of "comprehensive traits" of a variety into the relative closenessCiof the variety to the ideal solution, in order to reduce the interference of subjective factors, to make the research results more objective and accurate, and provide a more accurate basis for the comprehensive evaluation and application of varieties[6-7]. The DTOPSIS method has been applied to the evaluation of many crops, such as maize, wheat, soybean, cotton, sugarcane, flue-cured tobacco,etc.[8-13]. Jin Qingetal.[9]evaluated the 11 new varieties in the regional test of Yunnan Province by using the grey correlation degree and DTOPSIS method, and concluded that compared with the ranking results based on yield performance, the ranking results by DTOPSIS method were more consistent with the ranking results obtained from grey correlation analysis. Through comprehensive evaluation, Yun152-484, Yunmai 1102 and Yu18-2 have good adaptability and high yield in Yunnan Province, and are suitable for popularization. Huang Jieetal.[14]used DTOPSIS method and grey correlation analysis method to comprehensively evaluate the test strains of the consortium from 2016 to 2018, and concluded that Luomai 906 ranked first compared with other tested varieties. Compared with the grey correlation analysis method, the evaluation results of DTOPSIS method are closer to the actual production. The entropy weight method is based on the index observation value, and the weight is determined by the discrimination of each item in the indicator sequence, which overcomes the shortcomings of the subjective weight assignment method and improves the objectivity of the evaluation[15]. At present, the research of many agricultural researchers is mainly focused on wheat yield, disease resistance, fertilizer application and so on, while there is little research on screening varieties suitable for southern Shandong Province by DTOPSIS method. In this paper, 19 common wheat varieties in southern Shandong Province were used as experimental materials, 9 evaluation indicators were selected, the weight of each evaluation indicator was weighted by entropy weight method, and the comprehensive evaluation was carried out by DTOPSIS method. The wheat varieties suitable for planting in southern Shandong Province were screened out in order to provide a reference for local wheat varieties planting and promotion. 2.1 Experimental materialsThe experimental materials were 19 wheat varieties including Feida 6, Jimai 2, Denghai 216 and Jimai 22, which were widely planted in southern Shandong Province (Table 1). 2.2 Overview of the experimental siteThe experiment was carried out in Quanyuan Town, Tancheng County, Linyi City in 2019, where the terrain is flat, the irrigation and drainage are convenient, the soil is lime concretion black soil, the fertility is medium, and the previous crop is maize. It has a warm temperate continental monsoon climate, with an annual average temperature of 13.4 ℃, an annual average precipitation of about 840 mm, and a frost-free period of more than 198 d. Table 1 Comparison of traits of 19 wheat varieties 2.3 Experimental designRandomized block arrangement was used in the experiment, with a plot length of 9 m, a width of 1.5 m, 6 rows, a row spacing of 0.25 m, and an area of 13.34 m2. Three replicates were set up in the experiment, with a 1 m walkway between the replicates and a protective row around it. 2.4 Experimental methodBefore sowing, the maize straw returning machine was used to crush twice, and the length of the straw was about 5 cm. The soil was prepared by combining rotary tillage for one year and subsoiling for one year. Then, 1 200 kg of organic fertilizer, 750 kg of compound fertilizer and 45 kg of phoxim granules were applied per hectare and spread evenly on the ground. On March 19, 2020, 187.5 kg/ha of urea was topdressed in rainy conditions. On November 22, 2019, chemical weeding was carried out with clodinafop-propargyl chloride, clodinafop-propargyl chloride and citrus oil. On May 7, 2020, UAVs were used to carry out "one spray and three preventions" to control aphids and midges, and foliar fertilizer potassium dihydrogen phosphate was sprayed at the same time. The yield was calculated by harvesting in the whole area during the wax ripening period, and the data was the average of three replications. 2.5 Investigation methodThe field records were carried out in accordance with theNationalStandardforRecordingRegionalTestsofWheatVarieties. During the whole growth period, the growth traits, stress resistance traits, indoor seed test and yield of wheat were investigated. In each plot, choose the place where the wheat seedlings grow evenly to make a fixed point of one meter double row, avoiding the side row. The highest tiller and effective panicle were investigated. 2.6 Statistical analysis of dataExcel 2013 was used to process the data, and the DTOPSIS method based on entropy weight was selected as the analysis method. 2.6.1DTOPSIS method. The DTOPSIS method can make multiple indexes of multiple varieties dimensionless, that is, unify the indicators of different measurements so that they can be compared with each other. The 19 tested wheat varieties were Feida 6, Jimai 2, Denghai 216, Bangmai 122, Jinlai 36, Jinong CH01, DK171, SH9832, Hemai 179, Yannong 161, Shannong HH126, BC15PT108, Jimai 22, and Luyuan 164. (i) A comprehensive evaluation matrixAwas established by processing the average values ofmwheat varieties andntrait indicators. (1) (ii) Dimensionless treatment. According to the breeding objectives, the indicators used for the comprehensive evaluation of DTOPSIS are divided into forward indicators and neutral indicators and the comparison matrixAis non-dimensionalized to become a comparable normalized matrixZ, and the calculation formula is as follows: The forward indicator is calculated by the formula (2): Zij=Yij/Yjmax (2) whereYjmax=max(Yij); The neutral indicator is calculated using the formula (3): Zij=Yi0/[Yi0+abs(Yi0-Yij)] (3) whereYi0is the trait target value. (iii) Establishment of weighted decision matrix. The weightaiof each indicator was multiplied by thejthcolumn in the matrixZto obtain a decision matrixR. (iv) Ideal solution and negative ideal solution of each indicator:the ideal solutionX+and negative ideal solutionX-of each indicator were calculated separately by formula (4) and formula (5): (4) (5) (6) (7) (8) 2.6.2Entropy weight method was used to calculate the weight of each trait. (i) Calculation of entropy of each indicator value. (9) wherePijis the proportion of the value of thejthindicator of theithvariety to the sum of thejthindicator values of all varieties;ejis the entropy value of theithindicator, andejcannot be greater than 1;Nis the total number of varieties. (ii) Weight (a) of each indicator. (10) whereais the weight of each indicator, andNis the total number of indicators. 3.1 Construction of comparison matrixThe evaluation matrix A (Table 1) was constructed based on 19 wheat varieties and 9 trait indicators. Nine evaluation traits were basic seedling, effective panicle, heading rate, plant height, number of grains per panicle, 1 000-grain weight, growth period, bulk density, and yield. Among the 9 traits of 19 varieties, the growth period was 233-235 d, and the difference was not significant. 2.115-2.415 million/ha for basic seedlings; the effective panicle was 7.305 million -8.265 million/ha; the heading rate was 42.0%-55.5%; the plant height was 75.6-90.5 cm; the number of grains per panicle was 27.5-44.5; the 1 000-grain weight was 43.5-55.7 g; the bulk density was 787.2-837.1 g/L; the yield was 9 111.6-9 490.5 kg/ha. The effective panicle of large-panicle varieties was lower, but the number of grains per panicle and 1 000-grain weight were higher; the effective panicle of multi-panicle type was higher, but the number of grains per panicle and 1 000-grain weight were lower. 3.2 Dimensionless treatmentAccording to the actual production, the nine indicators used for DTOPSIS comprehensive evaluation were divided into two categories:forward indicators and neutral indicators, in which growth period and plant height were both neutral indicators. According to the experimental requirements, the standard value of growth period wasY01=234 d, the standard value of plant height wasY02=80 cm, and other columns were forward indicators. The larger the forward indicator value, the better. The plant height and growth period were neutral indicators, and the indicator value should be moderate. The forward indicator formula and the neutral indicator formulas (2) and (3) were used to calculate the dimensionless results (matrix A), as shown in Table 2. 3.3 Determination of weight of each indicator by entropy weight methodIn the evaluation of wheat varieties, the greater the entropy value of evaluation indicator, the smaller the difference coefficient; the greater the weight, the greater the amount of information provided by the indicator, and the greater the contribution to the variety evaluation. The weight of each indicator was calculated according to formulas (9) and (10) (Table 3). The weight of each indicator from low to high was:growth period Table 2 Dimensionaless matrix of 19 wheat varieties Table 3 Entropy weight and weight of different indicators 3.4 Establishment of decision matrixEach indicator weightaidetermined by the entropy weight method was multiplied by thejthcolumn in the matrixZto obtain the decision matrixR(Table 4). 3.5 Ideal solution and negative ideal solution of each trait of the tested varietiesAccording to the formula (4) and (5), the ideal solution and the number of negative ideal solutions of 11 traits were obtained. X+={0.051 5, 0.048 9, 0.137 0, 0.024 2, 0.609 9, 0.116 4, 0.000 1, 0.007 2, 0.004 3} X-={0.045 1, 0.043 2, 0.103 7, 0.021 9, 0.376 2, 0.090 9, 0.000 1, 0.006 7, 0.004 1} 3.6 Calculation of relative proximity of ideal solutions of tested varietiesAccording to formulas (6)-(8), the distance between each tested variety and the positive and negative ideal solutions, and the relative proximity between each tested variety and the ideal solution (Table 5) was calculated separately. The larger theCivalue, the closer the variety was to the ideal breeding goal. From Table 5, it can be seen that the top 6 varieties in the order ofCivalue were Shannong HH126 >DK171 >Hemai 179 >Yannong 161 >Feida 6 >Jinlai 36 >TKM6215, and theCivalue of Yannong 161 ranked fourth. The yield ranked 13th. TheCivalue of TKM6215 ranked 7th, and its yield ranked 18th. There were some differences between the ranking results ofCivalue calculated by DTOPSIS method based on entropy weight method and the ranking results only using yield as evaluation indicator. Although the comprehensive traits of these two varieties were excellent, the yield was not up to the standard, and they were not suitable for local popularization and cultivation. TheCivalue of Jinlai 37 ranked 11th, and its yield ranked 14th; Denghai 216 ranked 15thinCiand 16thin yield, Luyuan 164 ranked 17thinCiand 19thin yield, Jinong CH01 ranked 18thinCiand 12thin yield; theCivalue of SH9832 ranked 19th, and its yield ranked 17th. The yield and comprehensive evaluation indicator of these five varieties were backward, and they were not suitable for planting in southern Shandong Province. Hemai 179, DK171, Shannong HH126, Feida 6, Jinlai 36 and Yannong 301 performed well in comprehensive traits based onCivalue and yield of DTOPSIS. It is suitable for planting in southern Shandong Province. Table 4 Decision-making matrix of 19 wheat varieties Table 5 Calculation results of DTOPSIS method With the development of agricultural production, higher requirements have been imposed on wheat varieties, and breeder experts have changed the goal of wheat breeding from simply measuring yield to positioning on the comprehensive selection of agronomic traits, only wheat varieties with excellent comprehensive traits have the value of popularization and application. There are many methods for comprehensive evaluation of wheat varieties, such as fuzzy comprehensive evaluation method[16-17], principal component analysis (PCA) method[18], grey correlation analysis method[19], DTOPSIS method[20]and similarity and difference analysis method[21]. DTOPSIS is a new evaluation method, which compares the differences of indicators by means of the positive ideal solution distance and negative ideal solution distance of multi-objective decision-making. The traits of the variety was regarded as the comprehensive traits of the fuzzy indicator and was transformed into the similarity of the variety to the ideal solution, which could reduce the interference of human factors and make the research results more accurate. Yang Chunlingetal.[22]considered that the DTOPSIS method could summarize the trait indicators of each variety into a unified quantitative comprehensive indicator, and could reflect the stability of each variety, which was more reasonable than yield analysis alone. Zhang Shuangxietal.[23]also considered that the DTOPSIS method could reflect the advantages and disadvantages of the comprehensive traits of each variety, which was more reasonable than the single yield indicator. They used DTOPSIS method to evaluate the new varieties of spring wheat in Northwest China from 2005 to 2006, and screened out two new varieties with excellent comprehensive traits, Ningchun 39 and 15-1106. Guo Weietal.[24]used DTOPSIS method to analyze the yield, bulk density, dough development time and other 11 traits of 7 main wheat varieties tested in Mishan area of Heilongjiang Province in 2005, and concluded that Beimai 1, Beimai 2 and Kenhong 14 ranked first, second and third, respectively, and they had excellent comprehensive properties and were suitable for planting in this area. In this study, 19 wheat varieties in southern Shandong Province were comprehensively evaluated by DTOPSIS method based on entropy weight method, and the entropy weight method was used to calculate the weight of trait indicator, which weakened the subjectivity and one-sidedness of artificial determination of weight. The evaluation results are more scientific and reasonable, which is consistent with previous research results[22-24]. In the comprehensive evaluation of wheat varieties in this study, Yang Chunlingetal.[22]used plant height as a neutral indicator and growth period as a reverse indicator. In this study, both plant height and growth period were used as neutral indicators. We believed that using these two traits as neutral indicators can make the quantitative indicators of each trait more reasonable, meet the current requirements of wheat breeding objectives, and evaluate new wheat varieties more scientifically and comprehensively. The weights of number of grains per panicle, 1 000-grain weight and effective panicle are 0.609 90, 0.116 41 and 0.048 89, which are the first, third and fifth respectively, also basically conforming to the three elements of wheat yield. The yield is a very important trait indicator, and the yield weight calculated by the entropy weight method in this study was 0.004 30, ranking eighth. Because this study only selected several basic growth traits of wheat, without considering the factors such as pests and diseases and lodging, the weight of yield is not consistent with the current breeding objectives of wheat. In the future study, other indicators of wheat varieties should be improved to evaluate the comprehensive adaptability of wheat varieties in a more scientific manner. To evaluate the adaptability of wheat varieties in southern Shandong Province, we should not only pay attention to yield, but also take into account other growth traits and stress resistance traits of wheat. In this study, 19 common wheat varieties in southern Shandong Province were comprehensively evaluated by DTOPSIS method and yield study. The results indicated that Shannong HH126 (Ci=0.922 1), DK171 (Ci=0.868 0), Hemai 179 (Ci=0.851 5), Feida 6 (Ci=0.719 6), Jinlai 36(Ci=0.696 7), and Yannong 301 (Ci=0.523 2) varieties have excellent comprehensive traits and the yield ranking was above average, so they are suitable for planting in southern Shandong Province.1 Introduction
2 Materials and methods


3 Results and analysis


4 Discussion
5 Conclusions
杂志排行
Asian Agricultural Research的其它文章
- Analysis of Application Status and Recommendations for Shade-Tolerant Lawns and Ground Cover Plants in the West Lake Scenic Area
- Cloing and Bioinformatics Analysis of ndk Gene from Vibrio alginolyticus
- Design of Diversified Intelligent Control System for Energy-saving Optimization of Solar Greenhouse in North China
- Determination of Lead in Lime-preserved Egg by Microwave Digestion and Flame Atomic Absorption Spectroscopy
- Analysis of Land Use Change and Driving Factors in Mojiang County Based on PLUS Model
- Intellectual Property Protection and New Development Pattern Construction of Xinjiang Jujube
