An Estimation of the Geometrical Structure of Polar Cap and Emission Property of Radio Pulsar: A Treatment from an Analytical Approach
2023-05-29TridibRoy
Tridib Roy
1 Indian Institute of Astrophysics, Sarjapur Main Road, Koramangala 2nd Block, Bangalore 560034, India; tridibroy.12@gmail.com
2 SN Bose National Cenre for Basic Science, Saltlake, Sector 3, JD Block, Kolkata 700106, India
Abstract Pulsars are believed to be one of the most interesting objects in the universe.The emission mechanism of pulsars is still a conundrum to physicists,as there is no completely acceptable theory that can establish a consensus between theory and observation.Pulsars possess a gigantic magnetic field,to the order of 1012 Gauss, and generate a very powerful radio beam from the magnetic pole.However,the powerful radio beam is generated by some complicated coherent plasma processes and acceleration in the pulsar magnetosphere.The location of the origin of the radio waves has been predicted to come out exclusively from the polar cap zone, whose boundary is defined by the footprint of the last open field line.However, in this paper, we mainly try to generate the shape of the polar cap structure from an analytical solution and discuss how it gets distorted for different geometrical parameters due to the presence of perturbation such as polar cap current flow.Also, apart from that, we try to emphasize understanding the variation of radio emission height and polarization angle with respect to different geometryrelated parameters as well as with frequency.
Key words: (stars:) pulsars: general – stars: neutron – radiation mechanisms: non-thermal
1.Introduction
Pulsars are rapidly rotating neutron stars (NSs), radio transients and highly gravitating compact objects which originate as a stellar remnant during the end phase of the evolution of a massive stellar progenitor.Pulsars are regarded as ubiquitous objects,as they not only generate powerful radio beams but measuring the radio signal from pulsars also helps one to trace the magnetic field in the intervening Galactic medium.The physical appearance of a pulsar is inferred from the observed or physical characteristics of rapidly spinning NSs, possessing a hugely powerful magnetic field to the order of 108–1012Gauss.In each epoch of rotation, radio flashes from pulsars pass our line of sight, and we receive a series of periodic signals, similar to what happens in a lighthouse.
The main motivation of this paper is to unravel the polar cap(PC) structure and its modification due to the presence of perturbation.Apart from that, I have tried to explore some of the properties associated with polarization angle(PA)and radio emission altitude to get more insights into the topics theoretically.Principal results are discussed in more detail in the subsequent part of this paper.Before that, let us revisit some crucial and very important results done in the field of pulsar astronomy.The pulsar paradigm is quite rich and is regarded as one of the most important discoveries in astrophysics.Although a copious amount of theory has been dedicated to probing the emission physics of radio pulsars,it is still a long-standing debated mystery.Most physicists believe that pulsar radio emission is mainly generated via the coherent curvature radio emission mechanism (CCRM)(see Sturrock 1971; Ruderman & Sutherland 1975; Buschauer& Benford 1976; Wang et al.2012; Roy & Gangadhara 2019;Cooper et al.2021; Gangadhara et al.2021), but some alternative models have convinced researchers to deduce the emission properties of radio pulsars by introducing the inverse Compton scattering(ICS)model in the annular gap regime(see Du & Han 2011; Lv & Wang 2011).In this context some recent critiques regarding plasma processes involved in the pulsar magnetosphere have been summarized by Melrose et al.(2021), where the merits and intricacies of all the possible plasma processes,as present in the pulsar magnetosphere,have been well documented.
The emission mechanism of a radio pulsar is a broadband and coherent process.The brightness temperature of a radio pulsar corresponds to a huge temperature of 1025K, which infers that the emission mechanism of pulsars is coherent.In this context some recent literatures (see Roy &Gangadhara 2019; Cooper et al.2021; Lyutikov 2021b) have tried to estimate the brightness temperature and derived constraints involved in the bunch topoology by satisfying the coherent condition.The theory of pulsar emission physics associated with the polar gap, sparks and coherent microwave radiation has been well documented in many classical literatures (Sturrock 1971; Ruderman & Sutherland 1975;Melrose 1978).However, the incoherent theory was not sufficient to explain the high brightness temperature of pulsars in the radio band.Soon the need to develop a consistent theory of coherent radio emission for pulsars was realized and Buschauer & Benford (1976), Benford & Buschauer (1977)first gave an elaborate formulation of it.Very recently, some advanced simulation has generated an integrated pulse profile of pulsars based on the theory of an accelerating, coherently emitting extended plasma source and tried to reach brightness temperature as close to the values predicted by observation as possible (Roy & Gangadhara 2019; Gangadhara et al.2021).However, in this paper, I will try to mainly constrain some of the theoretical aspects in the framework of coherent curvature radiation to ponder some thoughts toward generating PC structure under perturbation and attempt to explore some of the emission height and PA related properties.
A pulsar’s paradigm is quite rich, and in the last 50 yr after its discovery, this field has seen an unprecedented level of success, and its application became diversified into different streams such as gravitational waves,nuclear physics and so on.Most of the literature recognizes pulsars’radio emission mechanism to be a broadband process and coherent as well,as inferred from the very high brightness temperature (≈1025K) in the radio band.However, the emission mechanism is a multi-stage process which is determined by both radio emission geometry and kinematics of electron-positron pair plasma.Several instabilities, such as two-stream instability, probably act in the pulsar magnetosphere to generate Langmuir waves,and, finally, these waves get converted to transverse propagating modes by some complicated propagation effect in the quasi-tangential zone(Asseo&Porzio 2006;Wang et al.2012;Roy 2021).Curvature photons arising from the acceleration of primary charged particles interact with the magnetic field and generate secondary charged particles, which generate strong radio pulses from the PC region of pulsars (Sturrock 1971;Ruderman & Sutherland 1975).Now with the advent of modern astronomy, global 2D kinetic plasma simulation of magnetic reconnection has been performed,to illustrate a more clarified picture of the coherent emission mechanism.Such advanced simulation has shown that beyond the light cylinder and close to the equatorial zone of an NS,current sheets form a plasmoid unstable regime,where current sheets get fragmented and form a dynamic chain of small plasmoids, which eventually interact with each other as well as with the magnetic field and finally a radio nano-shot emits from the magnetosphere(Philippov et al.2019,2020).Such pioneering advanced simulation has definitely had a significant impact on our further understanding about the involved emission mechanism of a pulsar.Apart from it, recently a model by Lyutikov (2021a)and Lyutikov (2021b) has demonstrated promising results based on a nonlinear plasma physics analytical solution,which generates coherent radio emission in the Crab pulsar,magnetars and fast radio bursts (FRBs), produced by a reconnectiongenerated beam of particles via a variant of the free electron laser mechanism, operating in a weakly turbulent, guide fielddominated plasma, with emission frequencies ν that depend mostly on the scale λtof turbulent fluctuations and the Lorentz factor of the reconnection-generated beam,but it is independent of the underlying magnetic field.
Now very briefly I discuss the polarization of a radio pulsar.A pulsar radio beam, which is generated from the magnetic pole,has a hollow nested conal structure (Rankin 1993).Individual polarization profiles in a pulsar are highly fluctuating and timevarying, with a degree of polarization that varies from 10%–100%.De-dispersion, Faraday rotation correction over different frequency channels and folding of thousands of individual pulses lead to the generation of a stable average pulse profile.However, the polarization profile of different radio pulsars is different; each of them has a unique shape and the polarization profile is definitely diverse in nature.The shape and structure of the integrated polarization profile is a unique signature of each pulsar.In this context,recently Johnston&Karastergiou(2019)did a comprehensive analysis to predict a correlation between pulse width and other frequently measured parameters such as spin period, magnetic field, etc.; such an analysis would really help one to probe pulsar emission physics in more detail.
Since this work is based on Kumar & Gangadhara (2012a),first I try to highlight some aspects of the works done in the paper and some possible follow ups.Kumar & Gangadhara(2012a) had shown that field aligned induced toroidal current over the PC region perturbs the dipolar field line, and hence influences the emission geometry.This field aligned current introduces asymmetry on the curvature, in the emission zone,which is reflected as an asymmetry in the phase location of trailing and leading components with respect to the meridional point.By analyzing the PC current perturbed dipole, Kumar &Gangadhara(2012a)systematically computed the changes of the coordinates of the colatitude, azimuth and curvature associated with the emission points, with respect to the unperturbed case,and subsequently deduced the integrated pulse profiles,including intensity, linear and circular polarization and PA by summing over the emission region from each field line.PC current flow does not lead to a phase shift at the inflection point(IP)of the PA curve,but it causes a vertical offset in the rotation phase diagram.However, the details of their simulation show that, in the presence of PC current perturbation and modulation, it makes a significant difference on IP, which in turn affects the polarized emission.However in this work, I have tried to deduce the PC structure due to PC induced field aligned current,which was not included in Kumar & Gangadhara (2012a).Except for the PC diagram, almost a complete model of polarization including the full emission geometry of a radio pulsar was developed by them.
It is quite familiar from existing literature that pulsar radio emission exclusively originates from a zone called the PC,whose boundary is defined by the footprint of the last open field line.Here I have tried to generate the structure of the PC and its modification under plasma current.Also,I have tried to explore the behavior of radio emission altitude and PA related properties briefly based on our analytical formulation.The contents of the paper are arranged in the following sections.In Section 2,the mathematical expression of the PC is given,and next in Section 3 emission altitude is formulated, followed by what I discuss about the property of PA in Section 4, finally ending up with a discussion and conclusion in Section 5.
2.Generic Property of the Polar Cap of Radio Pulsars: A Treatment to Deduce Polar Cap Formulation
The work is mainly categorized into three parts: (1) PC formulation,where details on the formulation and PC structure are summarized for both unperturbed and perturbed cases.(2)Radio emission height related calculation,and(3)PA related properties of pulsars, which are described in the subsequent sections.
In the context of emission of radio pulsars, the PC is regarded as a very important zone.Radio emission of pulsars is a multistage process,and most of the literature claims that it is associated exclusively with the PC region.The combined action of rapidly spinning, superconducting magnetospheric condition, and the very powerful magnetic field of an NS,generates a huge gap potential across the PC, which in turn leads to the extraction of charged particles and generates primary plasma; that primary plasma further undergoes pair multiplicity and generates secondary plasma, whose Lorentz factor lies in the range of 100–1000 (Ruderman &Sutherland 1975;Roy&Gangadhara 2019).The PC boundary is defined by the locus of the last open field line.Here I have tried to give the formulation of the PC and discuss the modification of the PC structure under the presence of PC current, which may be the advanced part of this paper.Rather than tracing the open field line, I have tried to determine the locus from the last closed field line as it could probably give a better estimation.So, the last closed field line would be tangent at the light cylinder surface, which implies thatd=rct- (rct·Ωˆ)Ωˆ , where|d|=rLcis the radius of the light cylinder,and Ωˆ is a unit vector,parallel to the spin axis of the NS.The expression of position vector rctof an arbitrary charged particle on the magnetic field line in the stationary frame of an observer was reported by Gangadhara (2004).By applying the above condition,one can derive the expression of the polar angle associated with the locus of the PC as
whereA= cos ( 2(α-φ) ) - 2 cos ( 2φ) + cos ( 2(α+φ)), α is the inclination angle of magnetic dipole moment with respect to spin axis and φ is the magnetic azimuth.Now for the range of π/2 ≤φ ≤3π/2, colatitude will be replaced by π −θsol.
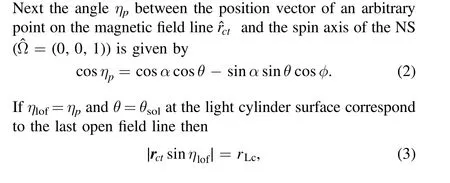
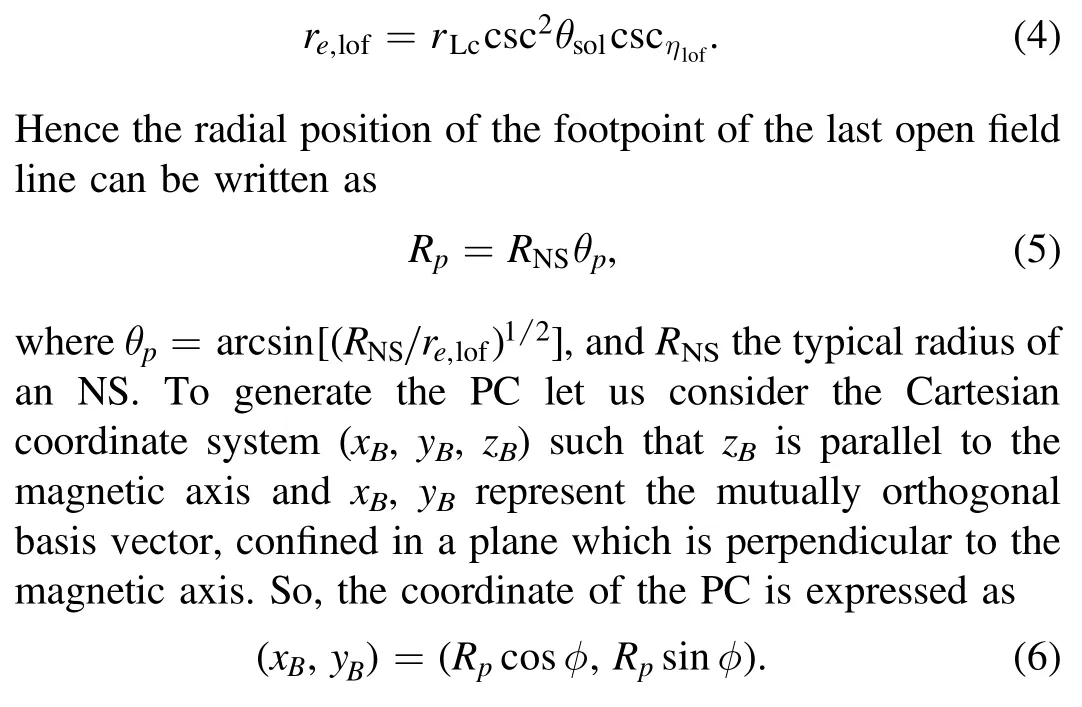
where rLc=P c/(2π) is the light cylinder radius, P is the spin period of the pulsar and c is the speed of light in a vacuum.As pulsar magnetic field line topology can be roughly approximated as purely dipolar, at least in the radio emission regime,the dipolar field line constant corresponding to the last open field line can be derived by using the dipolar field line equationr=resin2(θ) as follows
Next, we will try to understand the influence of PC current,which may be a potential source for distorting PC structure.As was first shown by Hibschman&Arons(2001),if there is any longitudinal current flow across the PC, it will add an extra azimuthal component and break the dipolar field line symmetry.Due to the symmetry breaking, field lines get twisted (Kumar & Gangadhara 2012a).In the spherical polar coordinate system (r, θ, φ) centered on the magnetic axis, the unperturbed dipole field is written as
where μ is the magnetic moment,θ is the colatitude and r is the radial distance from the origin.Most of the PC models of pulsar emission attribute the current flow due to the streaming of secondary charged particles along open magnetic field lines,which is approximately equal to the Goldreich–Julian current density JGJ
Here Ωˆ is the direction of rotation of the spin axis andBˆ0is the direction of unperturbed magnetic field, and ξp=J/JGJis the scale factor associated with plasma flow, which is responsible for generating the azimuthal component of magnetic field and twisting.By assuming axisymmetric current flow, the induced magnetic field due to field aligned current was first derived by Hibschman & Arons (2001) as
So,the total magnetic field due to perturbation will be the sum of the contributions from Equations (7) and (9), i.e.,B=B0+BP.The differential equation of a dipolar magnetic field line is given by
From Equation(10),one can deduce the following two equations;one connects the radial coordinate with polar angle and another one connects the azimuthal coordinate with polar angle
where K is an integration constant.From Equation (12), one can derive


where the notations stand for their usual meanings.Finally,the expression for δφ is written as a function of magnetic azimuth by taking the first-order approximation with the help of equation (11) as given in Gangadhara (2004).So, the expression of magnetic azimuth φ in Equation (1) has to be replaced by φ+δφ to account for the PC effect in the current scenario.After calculating the shift, the modification of the shape of the PC is computed and is shown in Figure 1, for different values of misalignment parameters and geometrical configurations.
In this section, I have tried to elaborate on the physical explanations associated with Figures (1–2), as shown in this paper.Let us first look at the complex Figure 1, where I have generated the PC boundary in the presence of a PC current perturbation, which is demarcated with red color and overlaid with an unperturbed PC diagram(shown in blue).The presence of longitudinal current flow across the PC distorts the symmetric dipolar magnetic field structure.It is more pronounced to say that higher plasma current flow leads to the generation of azimuthal components associated with the magnetic field,which can definitely result in the formation of a twisted magnetic field structure.From Figure 1, we can easily notice that the smaller values of α and misalignment parameter ξpdo not lead to a significant deviation of the PC structure compared to the unperturbed one.Here ξpcharacterizes the ratio of the plasma current flow with respect to the background Goldreich–Julian current.It is clear from panels (a) and (e) of Figure 1 that, even though plasma current for this case gets enhanced by a factor of 10, the smaller value of α suppresses the deviation.Now I discuss another two interesting cases associated with Figure 1: (i) Case 1, ξpis fixed to 1, where I have tried to discuss the trends of the PC with the increment of α.For this case,we can see that for lower α value,deviation of the structure of PC in the presence of polar cap current (PCC)perturbation is very minimal,but as α increases,PCC perturbed PC structure gets well separated with respect to the unperturbed one;it shows a fixed intersection point along the x-direction for each panel.The structure remains almost quasi-elliptical, and the orientation of the elliptical region along the y-direction gets slightly shifted.(ii) Case 2, where ξpis fixed to 10, and I analyze the changes in the structure with the increment of α.It is very clear from panels (e)–(h) of Figure 1 that, for higher α value,orientation of the major axis of the PC in the presence of PCC perturbation almost gets shifted by a significant amount,and the structure also gets deviated from well recognized elliptical geometry.This all has been understood to be happening because of the influence of the higher-order plasma current, which leads to the breaking of the symmetry of the dipolar magnetic field line, hence resulting in the shift of the emission coordinate and distortion.
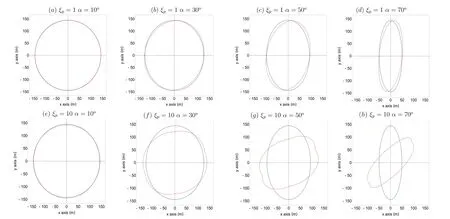
Figure 1.Above figure shows the PC diagram in the presence of perturbation, marked with a red contour for different geometrical configurations.To compare the changes of the PC boundary in the presence of plasma current perturbation, they are overlaid with the unperturbed cases; unperturbed cases are marked with blue contours.Top panels, (a)–(d), correspond to case of scale factor ξp=1 and magnetic axis inclination angle varies from 10° to 70°, with a step size of 20°, whereas bottom panels,(e)–(h),correspond to the case ξp=10 and α varies all the way from 10°to 70°,with a step size of 20°.The x-axis ranges of the PC for the unperturbed case from panels (a)–(d) are ±142.6 m, ±125 m, ±93 m, ±50 m respectively, whereas panels (e)–(h) have the same set of ranges for the unperturbed case, as they have the same set of α, and also the y-axis range for the PC remains constant for all unperturbed cases, which is ±145 m.Following that, the (x, y)-axis ranges for perturbed PC cases:panels(a)–(h)are(±142.6 m,±145 m),(±125.5 m,±142 m),(±93.4 m,±139.9 m),(±50 m,±138 m),(±143.3 m,±142.3 m),(±138.2 m,±121.7 m), (±125 m, ±92 m) and (±70 m, ±61 m) respectively.A point to note is that for perturbed cases, the ranges have been taken strictly by analyzing the intersection points with the x, y axis respectively, but due to the perturbation, the boundary can expand beyond the point of intersection.Other common parameters taken for computing the above profiles are spin period of pulsar P=1 s and radius of pulsar, i.e., RNS=10 km.
Next I move forward to explain Figure 2.Figures 2(a)–(d)show the PC boundary for the spin period 5 ms, which is generated with the help of Equation (1).If you notice panels(a)–(d) in Figure 2,it is evident that for a higher inclination of the magnetic axis, the dimension of the PC along the xdirection gets contracted, whereas the y dimension remains fixed.This happens because, for a higher inclination angle of the magnetic axis,more number of magnetic field lines close to the magnetic axis get bounded.As a consequence, the volume of the open magnetic field line regime gets contracted.The shape of the PC is quasi-elliptical in general, and also it is verified that the formula given here shows good agreement for the case of pulsar PSR 0329+54 (α=30°, P=0.71 s), with the x-dimension 164 m and y-dimension 171 m (Biggs 1990;Gangadhara 2004).It is evident from Figure 2 that the dimensions of the PC significantly get enlarged for millisecond pulsars, which happens purely due to the contraction of light cylinder radius.
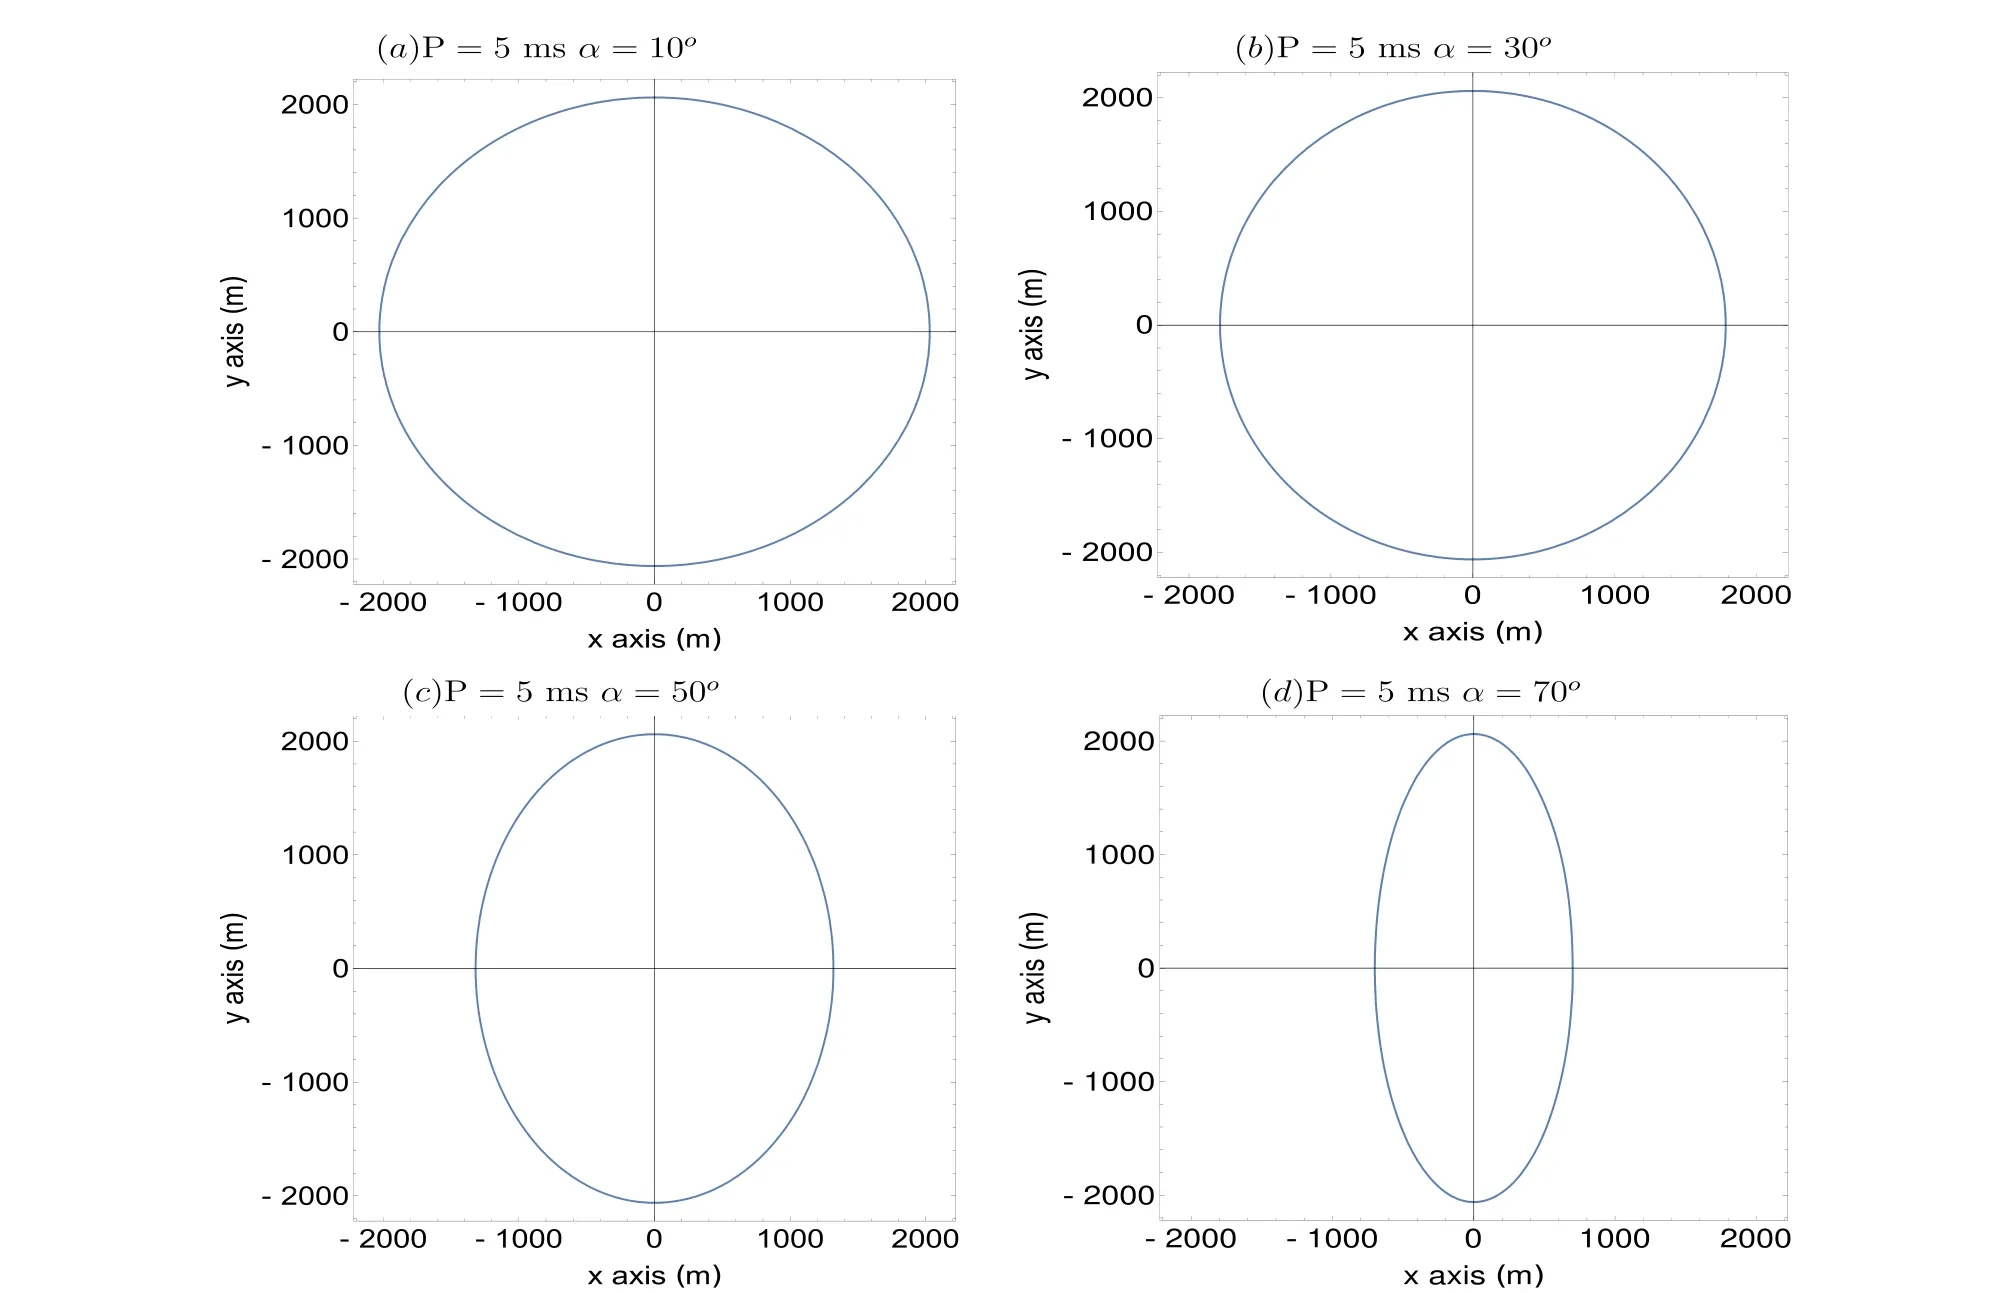
Figure 2.Above diagram panels(a)–(d)show the PC boundary of a millisecond pulsar.Beside each panel the corresponding inclination angle α has been indicated.From panels(a)–(d),the corresponding x-axis ranges are −2028 m ≤x ≤2028 m,−1782 m ≤x ≤1782 m,−1325 m ≤x ≤1325 m and −705 m ≤x ≤705 m,and the dimension along the y-axis remains constant for all cases,i.e.,−2075 m ≤y ≤2075 m.Other parameters chosen are spin period of pulsar P=5 ms and radius of pulsar RNS=10 km.
However, a point to note is that, in order to distinguish the difference between unperturbed and perturbed cases in Figure 1, I only have considered the changes of azimuthal coordinate on polar angle(see solution in Equations(1),(15)).But in reality, the expression for ηp(see Equation (2)) can be affected, due to the shift of azimuthal coordinate in the presence of PCC perturbation.Once ηpgets changed,subsequently, the expressions for re,lof, θp(see Equations (4), (5) respectively) can also get modified, hence leading to a slight change in PC estimation.However, in this paper I only consider the prime contribution of coordinate shift due to perturbation on θsol(see Equation (1)), and effect of coordinate changes on ηpwas neglected for the sake of simplicity.But in reality, the field line constant gets changed due to changes in polar angle shift as well as due to azimuthal angle shift (see Equation (13)), so one needs to consider it precisely for more accurate calculation of the PC.Second,for PC calculation I have considered some average emission height to calculate plasma current parameter Δ,but in reality it should be chosen very close to the NS surface for more fine tuned adjustment.Now this assumption has implication over three limits:(i)magnitude of current sheets is strong near the surface, due to the presence of a multipolar magnetic field component, hence it is highly probable that in that regime, magnetic reconnection processes are more active, hence plasma current perturbation is also strong.These reconnection processes are important in the sense that these processes are responsible for generating longitudinal plasma mode and radio nano-shot, and later these waves get coupled and amplitude gets enhanced via nonlinear wavewave or wave-mode interaction process and attain some highly unstable state with time.Finally, waves get converted to transverse escaping mode, near the wind-zone, close to the light cylinder (Philippov et al.2020).(ii) Second for an orthogonal rotator, i.e., α=90°, the effect of perturbation on PC structure is very minimal, no matter how strong the current circulation is near to PC zone, and as for this case Δ ≈0.(iii) For a millisecond pulsar, the effect of rapid spin period amplifies the perturbation (evident from the expression of Δ),but for normal period or long period pulsars,the effect of plasma current perturbation on PC structure is expected to be suppressed.So one needs to be very careful to choose a proper value of emission height, while estimating the PC.
3.Radio Emission Height Formulation
The pulsar radio emission is generally believed to be coherent curvature radiation emitted by secondary-pair plasma streaming along the dipolar magnetic field lines.The characteristic frequency of curvature radiation, at which the emission peaks, is given by Ruderman & Sutherland (1975)
Once we substitute the expression of radius of curvature ρ from Gangadhara (2004), one can derive the expression of emission height as a function of emitted frequency and geometricalparameters as follows

Next, I move forward to discuss different properties associated with emission height as well as with PA.First, I discuss the variation of emission altitude, which is shown in Figure 3.Profiles in Figure 3 are generated with the help of Equation (17).Variation of emission altitude is plotted with respect to rotation phase for each panel(a-c)in Figure 3.Panel(a) displays the plot of emission height versus rotation phase for different frequencies but with fixed values of α and σ,which demonstrates that radio emission does not come from a fixed height; rather, it comes from a range of heights.Figure 3(a) also confirms the radio frequency mapping; the frequency component at 300 MHz comes from the range close to 0 up to a maximum height of 4500 km,whereas the emission height associated with the frequency component at 600 MHz and at 1.4 GHz is limited to up to maximum height 2000 km and 1000 km respectively.Similarly,panel(b)also depicts the inverted Gaussian shape, but the curves intersect with each other, whereas panel (a) curves do not intersect each other.Panel (b) shows the variation of emission height with rotation phase for different values of α but with fixed values of impact factor, Lorentz factor and frequency.For α=30°, maximum emission height is limited to 2000 km, which is comparatively lower than the height as predicted for α=50° and 70°.For α=50° and 70°, maximum height is limited to 4000 km and 8000 km, respectively.All these variations associated with emission altitude happen due to the geometrical mapping and can be attributed to the interdependence of geometrical parameters.The last profile associated with emission height is displayed in Figure 3(c), which also shows similar trends as in panel (b).Panel (c) demonstrates that, corresponding to σ=0°, its minimum height is confined very close to the surface, and it spans up to a maximum height of 2000 km,whereas for σ=−8°and 8°,maximum heights are confined up to 1700 km and 2500 km respectively.But unlike zeroemission height for the case of σ=0°, minimum emission height for σ=−8°,8°does not occur very close to the surface of the NS; rather, it comes from some finite height.
4.Polarization Angle Property of Radio Pulsar
In this section I discuss the property of PA and its behavior elaborately,as doing so will really help one to have a confident estimation of emission height associated with different pulse components of a radio pulsar at multiple bands.Once we are able to measure the shift of polarization position angle IP(PPAIP), one can easily get the phase shift of the pulse component induced by aberration-retardation (A/R) or PCC effect.This method yields strong implications for confidently estimating emission altitude by using the relativistic phase-shift method.The expression of PA with relativistic effect was given in Blaskiewicz et al.(1991), Thomas & Gangadhara (2010)
where ζ=α+σ.It was predicted from earlier literature that,due to the occurrence of emission at fniite height,PPAIP shifts to the later phase, and peak emission shifts toward the earlier phase;due to the A/R effect,PPAIP shifts by an amountφ′ ≈remrLc(see Blaskiewicz et al.1991; Thomas & Gangadhara 2010).Once we take the derivative of Equation (18), and substituteφ′ =remrLc,we can derive the maximum slope associated with the PA curve for the σ=0 case as
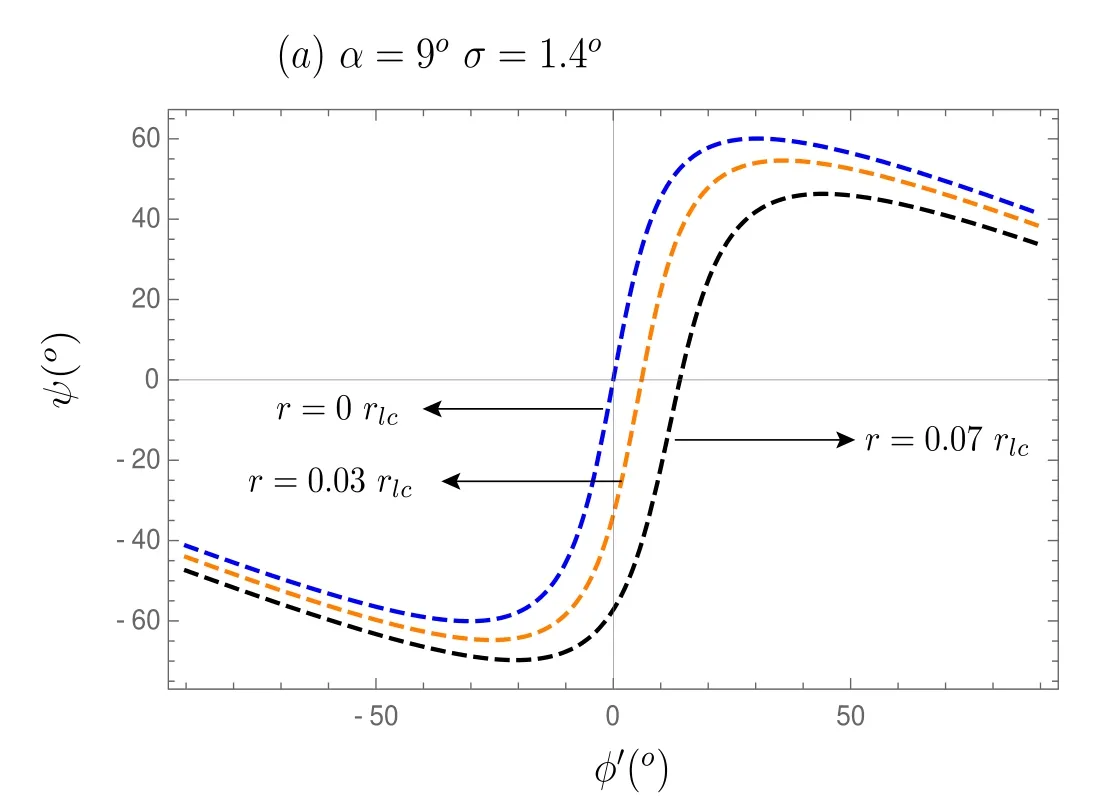
Figure 4.PA is plotted vs.rotation phase for different emission heights.Other fixed parameters are mentioned in the box.
Next, I try to explain Figure 4, where PA is plotted versus rotation phase for different emission heights with the help of Equation (18).We can clearly see that for higher emission altitude, PPAIP gets shifted toward the later phase.The measurement of the PPAIP has implications on estimating emission height.The phase shift of the peak location of pulse profile due to different relativistic effects such as A/R is exactly equal to the value of PPAIP, but carries an opposite sign.Therefore one can easily estimate the emission height of core and conal components for different pulsars,once the α, σ values are known.From an observational analysis, one can actually extract the values of α, σ by fitting the PA data with a theoretically predicted formula, i.e., rotating vector model(RVM) and BCW models respectively (Radhakrishnan &Cooke 1969;Blaskiewicz et al.1991).In general,pulsars show a high degree of linear polarization with a systematic “S”-shaped polarization position angle (PPA) swing, which is a characteristic property of a pulsar signal.The RVM of Radhakrishnan & Cooke (1969) attributes this characteristic“S”curve to an underlying geometry, wherein the magnetic field is assumed to be mainly dipolar, and relativistic beaming is in the direction of field line tangents.From an observational approach, an observer usually tries to make a best chi-square fitting of well calibrated pulsar data with an RVM curve of pulsar PA profiles to constrain the underlying emission geometry, hence extracting the information on magnetic axis inclination angle, and the line of sight impact angle with respect to the rotation axis.However, this method cannot always give confident estimates of the emission geometry related parameters as in reality (i) PA data of a pulsar are expected to be a function of emission height at a particular frequency, and(ii)second fitting of PA data with RVM model gives a degenerate solution of the emission geometry parameters.However,some pulsars show that the PA behavior deviates from the standard S curve, particularly in millisecond pulsars, where the polarization sweep is noisy and flatter on average (Xilouris et al.1998).Apart from that, several relativistic and plasma effects have been proposed to understand these deviations, such as (i) plasma propagation effects(Barnard&Arons 1986;McKinnon 1997),(ii)aberration of the beaming direction from strict parallelism (Blaskiewicz et al.1991;Dyks 2008;Kumar&Gangadhara 2012b),(iii)distortion of the underlying dipole field due to the field-aligned PCC(Hibschman & Arons 2001; Kumar & Gangadhara 2012a),or (iv) multiple interacting orthogonal polarization modes(McKinnon & Stinebring 1998).
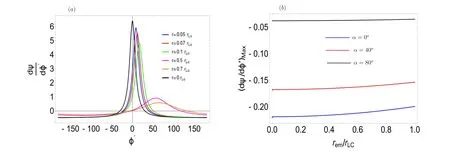
Figure 5.In panel (a),the slope of the PA is plotted vs.rotation phase for different emission heights.To generate panel (a),I used a fixed value α=10°.Panel (b)shows the plot of maximum of the slope of PA vs.emission height as a fraction of light cylinder for different inclination angles of the magnetic axis;for this plot the chosen value of impact angle is σ=0°.

Figure 6.In the above figure,panels(a)and(b)show the generalized contour representations of the slope maxima associated with PA in the(σ,rem/rLc)and(α,σ)plane respectively.To generate panel (a), a fixed value of α=10° is chosen, whereas for panel (b) a fixed value of fractional emission altitude is rem/rLc ≈0.5.
Next, I move forward to explain the profile, i.e., Figure 5,which is generated with the help of Equation (18) and Equation (19).Figure 5 is something new and an important result which has potential synergies with pulsar emission physics.Such results as derived from theoretical formulation have strong relevance to interpreting observational data.Carrying such analysis and making a good connection with theory intuitively helps one to get a confident estimation of PPAIP associated with PA curves, hence relating the connection with the emission height.One can see from Figure 5(a)that the peak of the slope of the PA curve gets shifted to the right side, with respect to the rotation phase, as the emission height progresses.Also, another important feature associated with Figure 5(a) is, with the enhancement of fractional emission height, the magnitude of the slope of PA decreases.On the other hand, Figure 5(b) displays the variation of the slope maximum of PA curve with the fractional emission altitude for different values of α.One can clearly see from Figure 5(b)that the locus of slope maximum of PA curves corresponding to different α remains constant until the light cylinder, but if one analyzes their nature up to r ≈7 rLc, one can see that curves slowly get merged at a point close to r=3.4 rLcand start to oscillate after reaching this turning point, but slowly the amplitude of oscillation gets attenuated as fractional emission height progresses; but initial value of the amplitude of such oscillation is quite less for higher value of α.Also, such study implies that the polarity of a particular emitted mode get reversed after a few light cylinder radii,naturally reflecting the property of propagation effect and which can explain several observational features associated with mode propagation of radio pulsars.Figure 6 presents the contour plots, showing the contour representation of the slope maximum associated with PA.A point to note is that Figure 5 is very specific in the sense that it has been generated for the σ=0 case to get a simplified expression, whereas Figure 6 is generated for generalized values of α, σ, rem/rLc.Since the generalized expression of(δψ δφ′ )Maxis quite big, I avoided presenting it here, but for the sake of completeness the locus of the slope maximum corresponding to PA swing has been presented as a contour diagram and is displayed in Figure 6.From a common point of view, one can derive the generalized expression of slope maxima by suitably choosing the initial value ofφ′ iteratively,such thatwhere the ψbcwexpression is given in Equation(18).The constraints,corresponding to the set of contour rings or z sliced representation of isochrone curves, associated with both the panels of Figure 6, a third variable, have been marked with color graded index, suitably placed adjacent to each panel.In the contour representation,slopes of the adjacent curves are relatively steeper,than the far away curves,which generally reflects the property of curvature radiation associated with the curvature of a dipolar magnetic field line configuration (see Dyks & Harding 2004; Kumar &Gangadhara 2012a).But in the presence of plasma current perturbation, field line structure gets twisted.Hibschman &Arons(2001),showed that a plasma current perturbation due to spark discharge associated with primary plasma current causes field line distortion,which in turn gives the polarization curves a vertical offset, but does not necessarily make any change on the coordinate of PPAIP in rotation phase space.A recent simulation by Kumar & Gangadhara (2012a) confirmed this fact, but they claimed that the presence of plasma modulation along the azimuthal direction can lead to a drastic change in PPAIP coordinate.In the caption of Figure 6, details of the parameter values have been mentioned.PA of the emitted radiation manifests the orientation of the the plane of the magnetic field line as projected onto the equatorial plane.One usually derives it from the detailed treatment of the Fourier component of the radiation electric field, integrated over the emission region and followed by the component of the corresponding quantity being segregated along the direction of two orthogonal basis vectors in the plane of the sky to reconstruct the final Stokes vector.Consequently,such contour representation as depicted in Figure 6 generally reflects the standard dipolar magnetic field line topology and is very consistent with the standard radio emission geometry of a pulsar magnetosphere (Gangadhara 2004; Roy &Gangadhara 2019).Another intriguing fact for the realistic pulsar case, phase shift of the pulse components, is that the PPAIP depends on the emitted frequency band and on the absolute emission location of the respective component in the pulsar magnetosphere, which has been predicted by earlier literatures(Blaskiewicz et al.1991;Gangadhara 2005;Thomas& Gangadhara 2010), whereas the RVM model shows a solution of the slope maximum of the PA curve, for zero emission height approximation for all pulse components to be(δψ δφ′ )max= sinαsinσ(Radhakrishnan & Cooke 1969).Thus one needs to consider the effect of finite emission height corresponding to each pulse component separately, for estimating absolute emission height (Thomas &Gangadhara 2010).
5.Discussion and Conclusion
Here I vividly try to summarize some of the important results below.(i) In the manuscript, distortion of the PC shapes for different plasma current parameters and geometrical parameters are shown in Figure 1,based on an analytical approach,which is the main result of the paper.Figure 1 clearly affirms that,as magnetic axis inclination angle (α) and plasma current parameter(ξp)both get enhanced,PC structure slowly becomes distorted into an arbitrary structure from a regular elliptical shape,and also orientation of the major axis of the PC begins to precess.In another part of the PC formulation, structure of the PC for the millisecond pulsar case is displayed in Figure 2 and all relevant explanations are presented in the previous section.From general comparison, it is evident that the area of the PC for a millisecond pulsar is quite larger than the case for a normal pulsar.Expansion of the area of a PC of a millisecond pulsar happens purely because of a geometrical reason.As the effect of plasma current perturbation is much stronger for the millisecond perturbation case, it requires much more refined calculation.For interpreting the PC formulation of a normal period pulsar, I have used some numerical approximation,which can indirectly influence geometrical parameters, hence limiting our understanding about PC structure.As perturbation is expected to be strong for the millisecond pulsar case, the formula needs to be refined much more precisely based on the prevailing geometrical description.In this short paper, it is beyond the scope to interpret all those results in detail, so the plan is to work on those in a subsequent paper.
In the second stage of the paper,geometrical dependency of emission height variation in the rotation phase space is shown,for different radio frequencies,magnetic axis inclination angles and line of sight impact angle parameters in Figure 3, which demonstrates that emission of radio pulsars comes from a wide range of height, and its detailed description is given in the section on radio emission height.In literature, two main methods to estimate emission height of pulsars have been proposed: (i) geometrical method (Blaskiewicz et al.1991)and(ii)relativistic phase-shift method (Dyks&Harding 2004;Gangadhara 2004, 2005; Dyks 2008; Thomas &Gangadhara 2010).Both the methods have their merits and shortcomings as well.The first method, i.e., geometrical method, postulates that (a) all pulse components emit at a constant height,and(b)pulse edge corresponds to the last open field line.This method has an ambiguity in terms of predicting the pulse edge corresponding to the last open field line, as in some cases it is highly probable that the whole PC does not emit.The first method predicts that the centroid of the peak advances to an earlier phase by rem/rLc,whereas PPAIP lags to a later phase by an amount 3rem/rLc.The second method predicts that due to a geometrical limitation and relativistic effect associated with emitting blobs in the pulsar magnetosphere, the observer does not receive all the components at a constant height.Due to the combined effect associated with rotation and retardation(i.e.,A/R effect),it creates asymmetry on the phase location of leading and trailing components with respect to the meridional plane.The meridional plane is an invariant entity, which contains a rotation axis and magnetic axis both at zero rotation phase.This combined A/R effect leads to a phase shift in the centroid of the peak, advancing to an earlier phase by an amount 2rem/rLc,whereas PPAIP lags to a later phase by an amount 2rem/rLcin the rotation phase diagram.This method is called the relativistic phase-shift method, where it is assumed that core and conal components emit at different heights and emission height is determined from the asymmetry of the phase location of core and conal components.Although this method gives a very confident estimation of emission height for most cases,in some cases it is quite difficult to identify the core and conal components from pulsar data.
In the third stage of the work,PA and its slope variations are shown for different emission heights and geometrical parameters in Figures 4–6.In Figure 4,it is shown that PPAIP gets shifted for different emission heights.Next in Figures 5 and 6,slopes of PA curves are plotted with respect to rotation phase and fractional emission height respectively for a fixed geometry.In Figure 5, it is shown that the peak of the slope of PA gets shifted in rotation phase space as emission height progresses,while on the other hand Figure 6 demonstrates that slope maximum of the PA curve almost remains constant until the light cylinder radius.Relevant explanations on the nature of all the curves associated with the predicted results can be well explained with the conventional geometrical scenario of curvature radiation of radio pulsars.
Below, I have tried to give some limitations or incompleteness on the model, and also discuss some future scope and other perspectives.For the sake of completeness, Kumar &Gangadhara (2012a) presented a full geometry under PCC perturbation, which shows the difference between the unperturbed (dashed line) and perturbed magnetic field line (solid line).Due to the presence of extra azimuthal component (i)field lines becoming twisted and(ii)emission coordinate being changed, i.e., tangent vector, radius of curvature of field lines,curvature vector and other radio emission geometry related parameters on which emission property depends,gets affected,which naturally leads to a phase shift in the peak of intensity profile (see Kumar & Gangadhara 2012a).Results shown in this paper are based on some new formulations (see Equation (1), which determines the PC structure and coordinate), which are firmly connected with existing literatures, so I believe that the results are genuine and carry potentially good impact as far as the pulsar emission mechanism is concerned.Although I have tried to revisit some new and old formulas, until it is implemented and justified thoroughly with reliable data sources, intricacies and drawbacks will not be revealed.Also,in the current analysis,I have neglected the rotation of pulsars.It is evident that rotation can also modify the PC structure.In a subsequent paper I plan to add this effect.Among all the perturbation effects that are present in a pulsar magnetosphere,it is believed that A/R is the dominant one, which leads to shifting the centroid of intensity peak to an earlier phase by 2rem/rLcand PPAIP to be shifted to a later phase by 2rem/rLc, with respect to the meridional plane(see Gangadhara 2005), where remis the emission height and rLcis the light cylinder radius.However,earlier prediction(see Blaskiewicz et al.(1991),named the BCW model)claimed the phase shift of the location of the centroid of the core of the pulse profile to advance in phase by rem/rLcand delay PPAIP to a later phase by 3rem/rLc.This was derived based on the assumptions of(i)first order approximation of rotational effect and(ii)constant emission height across the full pulse longitude,which does not give a confident estimation of phase shift(both PPAIP and centroid peak of intensity)and frequency dependent emission height, as initial assumptions do not seem to be realistic.
Here I try to highlight some of the limitations of the model associated with PC estimation.First limitation: (i) while computing the PC in the quadrant π/2 ≤φ ≤3π/2, δφ is not computed at the shifted azimuthal location at π −φ.But in principle for accurate estimation of PC,δφ should be estimated at π −φ in the second quadrant, as δφ is also an explicit function of φ.Second limitation: (ii) while estimating ηlof, I have not substituted φ by φ+δφ, as it can iteratively generate unnecessary numerical errors or indeterminate numerical value at some particular phase location.Third limitation: (iii) while estimating the contribution of PC current perturbation I have assumed some average emission height, i.e., r ≈0.5rLC, but in general one should trace the field line constant at a specific value,which corresponds to the last open field line for a given set of emission geometries, or one can roughly take emission height to r ≈RNS, the radius of an NS, as the PC boundary is constructed by the projection of the last open field line on the surface of the NS.However, the aforementioned value sometimes can overestimate or underestimate the PC boundary and one needs to justify it from pulsar data.
Nevertheless,there are some other effects like magnetic field sweep back(mfsb)(see Dyks&Harding 2004),but it has been proved that this effect is a third-order effect,proportional to rn3,where rnis emission height as a fraction of light cylinder radius.By using the expression of phase-shift due to mfsb δ φmfsb(see Dyks & Harding (2004)), Gangadhara (2005)estimated the value of δφmfsbfor rotation phaseφ′ = 0° , line of sight impact angle 0°and magnetic axis inclination angle 10° and 90° respectively, and he found that compared to the A/R and PCC effects, mfsb is far too weak in the regime rn≤0.2.Hence it can be claimed that, among all perturbation effects,the A/R and PCC effects are among the most dominant ones (see Gangadhara (2005) for a more detailed discussion).However mfsb can become dominant close to the light cylinder.Still now, the relativistic phase shift method as prescribed by Gangadhara (2005) seems to be a very powerful and accurate method,which was practically applied by Thomas& Gangadhara (2010) to estimate the emission height associated with the multi-component profile of three pulsars,at 610 MHz and 1.4 GHz.In the near future I have a plan to implement the technique over a wider population of radio pulsars and carry out the emission height analysis at multiple bands.
Acknowledgments
I personally thank Prof.R.T.Gangadhara(affiliated with the Indian Institute of Astrophysics, Bangalore) for several illuminating discussions.The author also acknowledges the SNBNCBS institute, Kolkata for providing research infrastructure and Department of Science and Technology,Govt.of India for providing financial assistance to carry out research.Also I would like to thank the anonymous referee for carefully going through the manuscript and pointing out some important issues that improved the quality of the manuscript.
杂志排行
Research in Astronomy and Astrophysics的其它文章
- Period Investigation on Two W UMa Binaries HH UMa and V1175 Her
- Influence of Solar Activity on Precise Orbit Prediction of LEO Satellites
- Constraining the Temperature-density Relation of the Inter-galactic Medium from Analytically Modeling Lyα Forest Absorbers
- 3D Kinematics of Classical Cepheids According to GaiaEDR3 Catalog
- Photometric Monitoring of Blazar 3C 66A with the Yunnan University Astronomical Observatory 1m Telescope
- The Variability and Radial Velocity of Planetary Nebula Central Stars
