Influence of Solar Activity on Precise Orbit Prediction of LEO Satellites
2023-05-29JunJunYuanShanShiZhouChengPanTangBinWuKaiLiXiaoGongHuandErTaoLiang
Jun-Jun Yuan , Shan-Shi Zhou, Cheng-Pan Tang, Bin Wu, Kai Li, Xiao-Gong Hu, and Er-Tao Liang
1 Shanghai Astronomical Observatory, Chinese Academy of Sciences, Shanghai 200030, China; sszhou@shao.ac.cn, tcp@shao.ac.cn, bwu@shao.ac.cn,kli@shao.ac.cn, hxg@shao.ac.cn
2 Insight Position Digital Intelligence Technology Service Co., Ltd., Shanghai 201109, China; echo201084@163.com, huoyan_sat@163.com
3 Shanghai Key Laboratory of Space Navigation and Positioning Techniques,Shanghai Astronomical Observatory,Chinese Academy of Sciences,Shanghai 200030,China
Received 2022 November 22; revised 2023 January 3; accepted 2023 January 6; published 2023 March 24
Abstract The perturbations of low earth orbit (LEO) satellites operating in the orbit of 300 ~2000 km are complicated.In particular,the atmospheric drag force and solar radiation pressure force change rapidly over a short period of time due to solar activities.Using spaceborne global positioning system (GPS) data of the CHAMP, GRACE and SWARM satellites from 2002 to 2020,this paper studies in depth the influence of solar activity on LEO satellites’precise orbit prediction by performing a series of orbit prediction experiments.The quality of GPS data is more susceptible to being influenced by solar activity during years when this activity is high and the changes in dynamic parameters are consistent with those of solar activity.The effects of solar activity on LEO orbit prediction accuracy are analyzed by comparing the predicted orbits with the precise ones.During years of high solar activity, the average root-mean-squares prediction errors at 10, 20, and 30 minutes are 0.15, 0.20, and 0.26 m, respectively,which are larger than the corresponding values in low-solar-activity years by 59%, 63%, and 68%, respectively.These results demonstrate that solar activity has a great influence on the orbit prediction accuracy, especially during high-solar-activity years.We should strengthen the real-time monitoring of solar activity and geomagnetic activity, and formulate corresponding orbit prediction strategies for the active solar period.
Key words:Sun:activity–atmospheric effects–space vehicles:instruments–planets and satellites:atmospheres–planets and satellites: dynamical evolution and stability – planets and satellites: fundamental parameters
1.Introduction
In recent years, different types of low earth orbit (LEO)satellites at heights of 300 ~2000 km have made a great contribution to various geodetic and geophysical missions,such as CHAMP (Reigber et al.2002) and GRACE (Peng &Wu 2008).Nowadays, building LEO navigation augmentation systems with large LEO constellations has become a research hotspot (Reid et al.2018).Due to the lower loss in signal transmission compared to global navigation satellite system(GNSS) satellites, LEO satellites have stronger radio signals.Thus, they can provide better positioning services in city canyons and other complex environments (Guenter 2020).With rapid geometric changes, a combination of GNSS and LEO data can shorten the ambiguity fixing(Li et al.2018)time of precise point positioning.These promising advantages have prompted many institutions and commercial companies to design and build LEO constellations in order to explore more possibilities in providing better positioning, navigation and timing (PNT) services (He et al.2022).
Precise orbit prediction (POP) is a prerequisite for the success of the LEO navigation augmentation system, as the system should broadcast the LEO satellites forecast orbit to provide PNT service.Precise orbit determination (POD) using GNSS data can reach a cm level of accuracy(Bock et al.2014;Montenbruck et al.2018; Yuan et al.2021), but it is still difficult to accomplish LEO satellites’POP for long arc lengths with high precision.Due to the low altitude involved, models of gravitational and non-gravitational perturbing forces become more complicated when establishing the LEO satellites’POD and POP.In particular,the significant disturbing force on LEO satellites is the atmospheric drag force.The commonly used atmospheric models such as the drag temperature model(Bruinsma et al.2003),or special processing methods(Beutler et al.2006), still cannot model or estimate atmospheric drag force perfectly.According to previous work (Kutiev et al.2013;Gao et al.2014),solar activity,which varies over several decades, clearly affects atmospheric drag.The above factors bring great challenges to the POP of LEO satellites.Willis et al.(2005)indicated the post-fit residuals(JASON-1,SPOT5)were significantly increased from 0.38 to 0.52 mm s-1during extreme conditions (geomagnetic storms).Nwankwo et al.(2015)investigated the effect of plasma drag on LEO satellites in different solar cycles.Due to solar activity (including perturbations and heating), the temperature, density and composition of the upper atmosphere can change significantly.The yearly LEO orbit decay rate during the high solar phase(2000–2002) was almost twice that of the low solar phase(2012–2014).Khalil & Samwel (2016) pointed out the difference in the variation of the orbital elements during high and low solar activity.Such a difference can reach three orders of magnitude and the air drag force has a larger impact on the satellites during the solar maximum activity than the minimum activity.
LEO satellites have a shorter orbital period and more complex orbital dynamics than GNSS satellites, which increases the difficulty of high-precision orbital prediction.The accuracy of different predicted orbital lengths needs to be further explored.On the other hand, the level of solar activity varies in a cycle of several decades, and there is still a lack of in-depth research on the influence of long-period solar activity on LEO orbit prediction.Results from short-period experimental data cannot fully reflect the influence of solar activity on LEO satellites’POP and other detailed information,such as data quality and dynamic parameters.Therefore, this paper selects LEO satellite data which constitute the entire solar activity period in order to perform orbit prediction testing.This paper aims to explore the extent to which the process and accuracy of LEO satellite orbit prediction are affected by solar activity.The paper is structured as follows: Section 2 presents the variation law of solar activity and the evaluating indices of solar activity level.This section also provides information on the selected LEO satellites and orbit prediction strategies adopted.Section 3 provides a detailed analysis of the influence of solar activity on global positioning system (GPS) data quality and dynamic parameters.By looking at precise orbits,we carefully evaluate the accuracy of orbit prediction in years of high and low solar activity,and we can analyze the variation characteristics of orbit prediction accuracy.Along with a discussion on these experimental results,conclusions from this work are presented in Section 4.
2.Prediction Strategies
The Sun is the main source of energy and disturbance in the solar system (Liu et al.2021).The Sun’s activity, including solar wind streams,solar flares and coronal mass ejections,can directly affect the state of the solar-Earth system including the Earth’s magnetic field (Du & Wang 2012).As a result, the combination of this solar activity and the Earth’s magnetic field activity injects energy into the atmosphere through particle deposition and Joule heating, causing strong atmospheric density disturbance.To better understand the relationship between solar activity and LEO orbit prediction,it is necessary to figure out the variations in solar activity and the Earth’s magnetic field activity.The most used solar activity indices(Balogh et al.2014) are sunspot number (SSN) and a measurement of the total radio emissions at wavelength 10.7 cm (F10.7).The latter index is measured in solar flux units of sfu (1 sfu=10-22W m-2Hz-1).The KP and AP indices (Menvielle & Berthelier 1991) can reflect the changes in the Earth’s magnetic field.The KP index is the average geomagnetic index of disturbance level recorded by several selected geomagnetic observation stations,recorded every 3 hr.The sum of eight KP indices in a day is used as the KP index of the day.The AP index is the equivalent geomagnetic amplitude index of the day.

Figure 1.Variation in solar and geomagnetic activities over the years from 2000 to 2020.The black dashed lines in the top panel mark the SSN of 40,80,and 150, respectively.
The top panel of Figure 1 depicts the average F10.7 index and SSN index from 2000 to 2020.The changes in F10.7 and SSN index are highly consistent, and it is clear that the solar activity has a period of nearly 11 yr.The variation in geomagnetic indices AP and KP caused by solar activity in 2000–2020 is shown in the bottom panel of Figure 1.To describe the relationship between solar activity and geomagnetic activity, the Pearson correlation coefficient (PCC) is introduced(Benesty et al.2008),which has a range of[-1,1].The larger the value,the greater the correlation between the two groups of variables.Assume there are two groups of independent random variablesA= (A1,A2,A3, …,AN) andB=(B1,B2,B3, …,BN).The PCC can be expressed by
where φAand σAare the mean and standard deviation of A,respectively, and φBand σBare the mean and standard deviation of B, respectively.
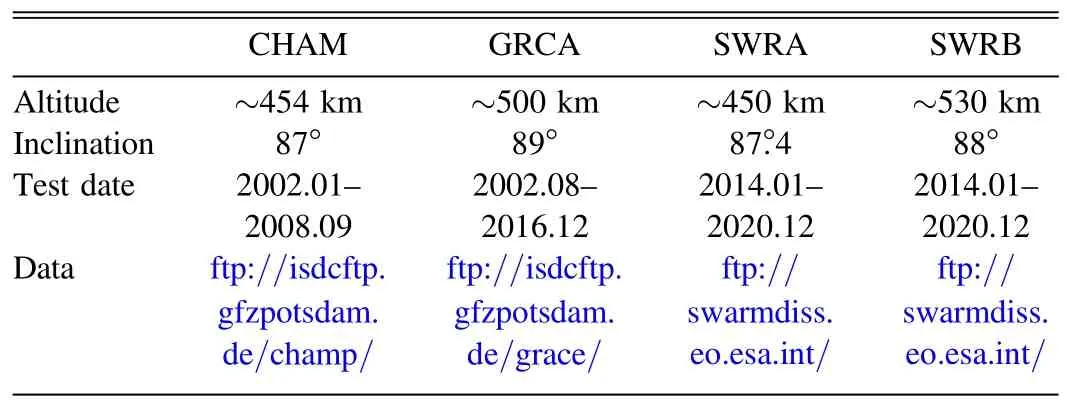
Table 1 Summary of CHAM, GRCA, SWRA and SWRB Satellites
As a result, the PCC between AP and solar activity (SSN)is 0.52 and the PCC between KP and solar activity (SSN) is 0.53.This means there is an obvious correlation between them.The combined action of solar activity and the Earth’s magnetic field can make a great impact on the atmospheric environment,which brings challenges to high-precision LEO orbit prediction.According to the standard of the Australian Space Weather Alert System (https://www.sws.bom.gov.au/Educational/1/2/4),solar activity can be defined as very low (SSN <=20), low (20 <SSN <=40), moderate(40 <SSN <=80), high (80 <SSN <=150), very high(150 <SSN <=250), and extreme (250 <SSN).For convenience of expression, this paper redefines solar activity as either low (SSN <=80: 2004–2010, 2015–2020) or high(80 <SSN: 2000–2003, 2011–2014) using the index of the solar activity.
The CHAMP, GRACE and SWARM mission periods are within the 23rd (1997–2008) and 24th solar cycles(2009–2020), and all data needed for our experiments can be accessed freely.The CHAMP (abbreviated as CHAM),GRACE-A (abbreviated as GRCA), SWARM-A (abbreviated as SWRA) and SWARM-B (abbreviated as SWRB) satellites are selected as the test satellites, because GRACE-A and GRACE-B, SWARM-A and SWARM-C are almost identical and within the same orbital plane.General information on these LEO satellites is listed in Table 1.
It is worth noting that LEO navigation enhancement systems need to provide users with real-time, high-precision services.However,the orbit prediction accuracy of an LEO satellite will decrease rapidly with arc length (Xie et al.2018).Therefore,the prediction time in this paper will not exceed 30 minutes in order to meet the need for high-precision orbit prediction.With spaceborne GPS observation data (12 hr), we perform precise orbit determination and obtain the initial orbit and dynamic parameters.Then, the determined (12 hr) and predicted orbit(10, 20, and 30 minutes) can be simultaneously obtained by numerical integration of the satellite motion equation(Feng 2001).More information about the POP strategy is displayed in Table 2.

Table 2 Processing Strategy for POP
3.Prediction Experiments
3.1.Spaceborne GPS Data Quality Evaluation
The quality of spaceborne GPS data directly affects the accuracy of LEO satellites’POD and POP(Qi et al.2021;Guo et al.2023).TEQC evaluation software (Estey & Meertens 1999) is used to analyze the influence of solar activity on the data quality of LEO satellites.The evaluation indices are the ionospheric delay derivative (IOD) and the observations per slip (o/slps).
The IOD and cycle slip on the carrier phase were analyzed using the geometry-free(GF)linear combination,which can be calculated by (Hwang et al.2010)
where α is the ratio between the squared frequencies of L1and L2; I1is the IOD of L1; λiis the wavelength of Li; Niis the integer ambiguity of Li;and miincludes the multipath and noise of λi(i=1, 2).The difference in GF linear combination between two consecutive epochs is
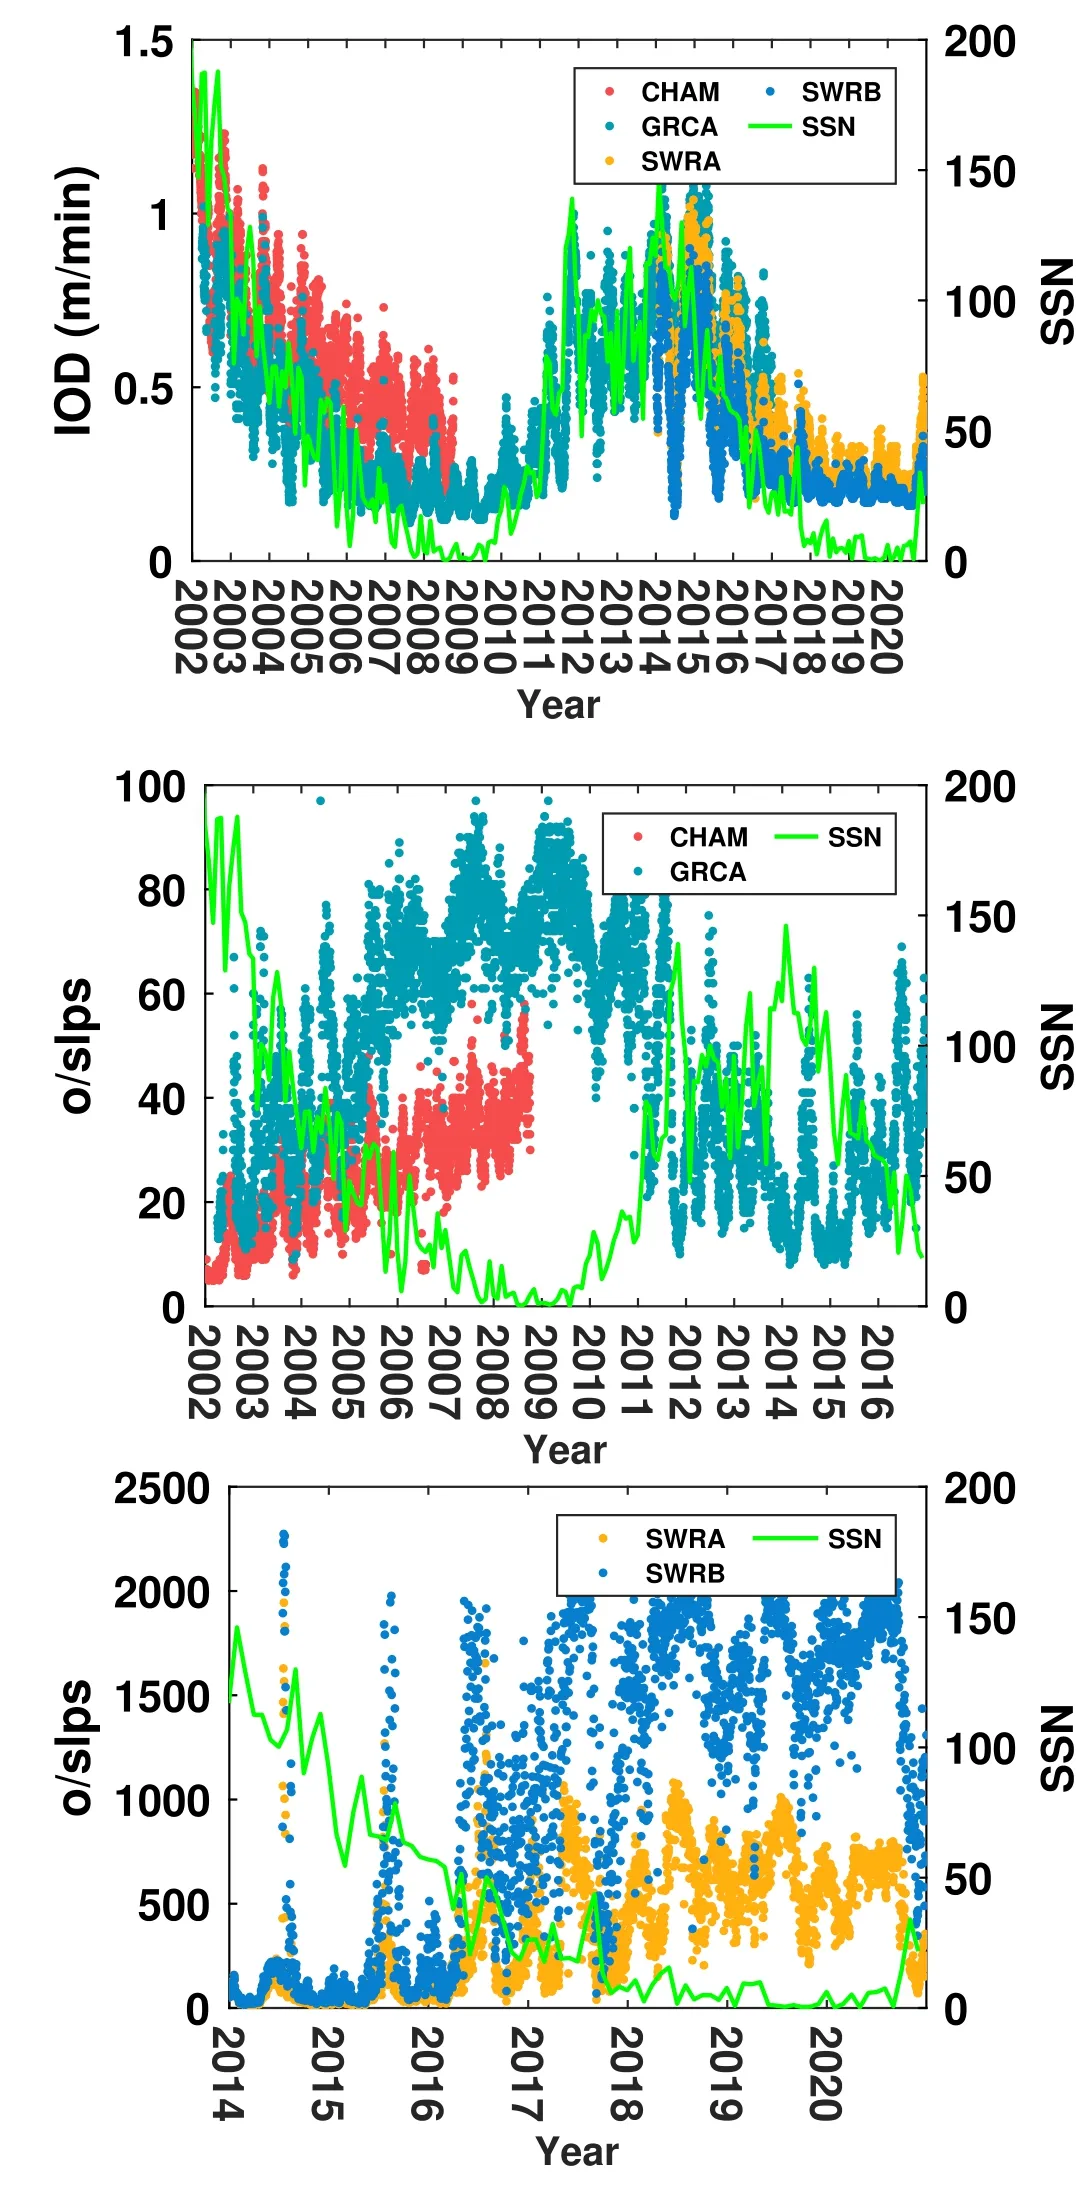
Figure 2.Quality of spaceborne GPS data for CHAM, GRCA, SWRA and SWRB satellites from 2002 to 2020.
where k is the epoch number and Δmis the difference between m1and m2.The Dksequences could be smoothed over time with stable ionospheric waves and less cycle slip.The top panel of Figure 2 shows that the variation in IOD is basically consistent with that of solar activity,but the variation in o/slps is opposite to that of solar activity,as seen the middle(CHAM and GRCA) and bottom (SWRA and SWRB) panels of
3.2.Dynamic Parameters
To further analyze the influence of solar activity on the LEO prediction accuracy,the atmospheric drag force,solar radiation pressure force, empirical force and other dynamic parameters are analyzed in this section.The LEO motion equation at the epoch of t can be expressed as
wherer,r˙,→r¨ are the position,velocity and acceleration of the LEO satellite, respectively; GM is product of the constant of gravity and the mass of Earth;r is the geocentric range;P is the modeled perturbing force, including gravitational and nongravitational force.After obtaining the initial orbital condition and estimated dynamic parameters (mainly including the coefficients of atmospheric drag force, solar radiation pressure force and empirical force) with the process of POD, we obtain the determined and predicted trajectories using the Adams orbital integration method.Hence, this section attempts to uncover the change characteristics of these dynamic parameters during different periods of solar activity.
The perturbationP¯dragcaused by the atmospheric drag force can be expressed as (Zhao 2004)
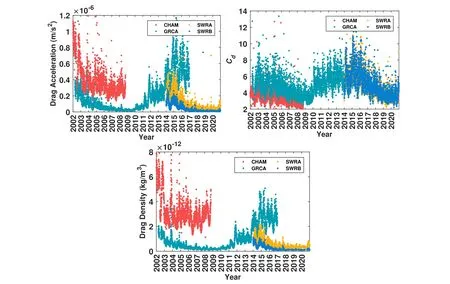
Figure 3.Dynamic parameters of atmospheric drag force for CHAM, GRCA, SWRA and SWRB satellites’orbit prediction.
where ρ is the atmospheric density; Cdis the atmospheric coefficient; A is the satellite windward area; m is the mass of the satellite; and vris the satellite speed.The left, middle, and right panels of Figure 3 describe the atmospheric drag force accelerationP¯drag, the atmospheric drag force coefficient Cd,and the atmospheric density ρ, respectively.The changes in atmospheric density (right panel of Figure 3) and atmospheric drag force acceleration (left panel of Figure 3) are basically same, which indicates that the atmospheric density largely determines the variation in atmospheric acceleration.At the same, their changes correspond to those of solar activity(represented by SSN) seen in Figure 1.In the high-solaractivity years, the atmospheric density and atmospheric drag acceleration are not only larger in magnitude (the atmospheric acceleration of the GRCA satellite in 2014 is about 3 times that in 2009),but they also change more intensely.This leads to the estimated atmospheric drag coefficients (middle panel of Figure 3) showing a very similar trend of solar activity.In addition, the GRACE satellites in 2015–2016 are at the end of their service, and their orbit altitudes decrease rapidly.The magnitude of atmospheric drag and acceleration is larger and the change is more dramatic in these years than in previous ones.It is worth noting that the orbit altitude between 2002 and 2009 is on a downward trend, however, the atmospheric drag density and acceleration still decrease gradually.This is consistent with the gradual stabilizing trend of solar activity.The same phenomenon can be seen in the year of 2015–2016.Coincidentally, the CHAMP and SWARM satellites are in a decreasing phase of solar activity.So, their drag coefficients,drag density and drag force acceleration show a gradual downward trend.
The perturbationP¯solarcaused by the solar radiation pressure force can be expressed as (Zhao 2004)
where P is the radiation flux at one astronomical unit between the satellite and the Sun; Cris the solar pressure coefficient; v is the satellite eclipse factor;uˆ is the unit vector of the LEO satellite and the Sun.The left and right panels of Figure 4 describe the change in solar radiation pressure force acceleration and the solar radiation pressure force coefficient Crin orbit fitting from 2002 to 2020.The variations in solar radiation pressure force acceleration and solar pressure coefficient are highly consistent with the trend of solar activity.In the years of high solar activity,the solar pressure perturbation force is larger and the change is more intense,which undoubtedly makes orbit prediction difficult.In addition, it is noted that the solar pressure coefficient and the solar pressure acceleration had a downward trend in 2002–2009 and 2015–2016, which is consistent with the trends of solar activity.Similarly,the solar pressure coefficient and solar pressure acceleration of the CHAMP and SWARM satellites continue to decline as the solar activity calms down.
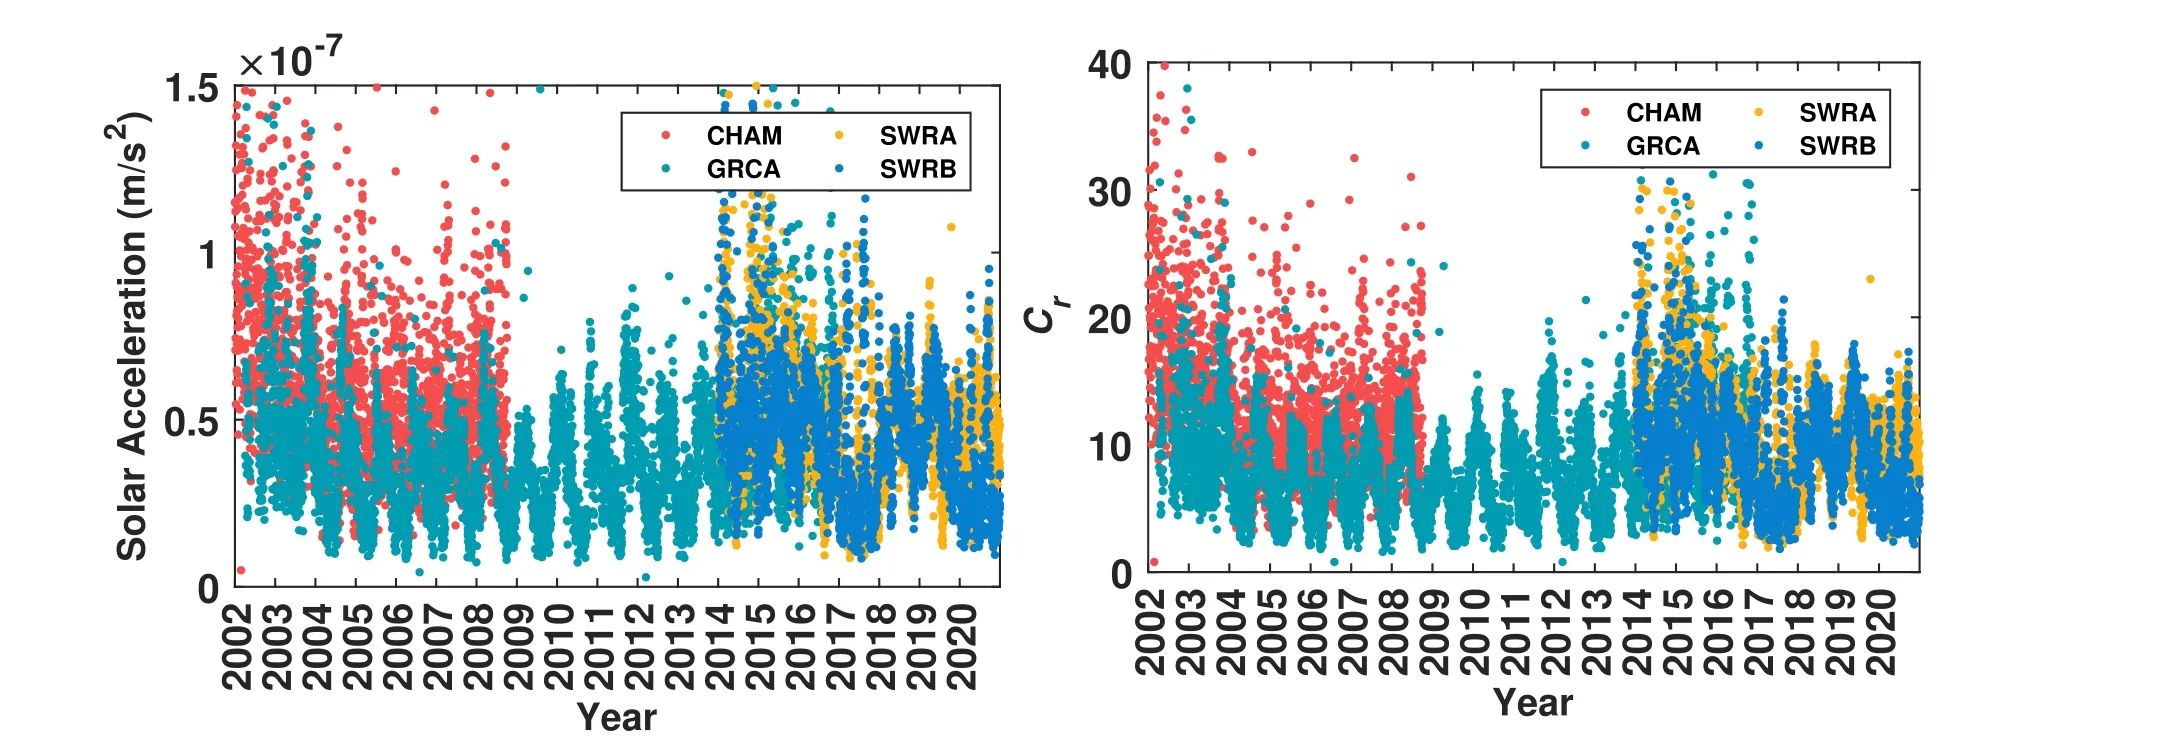
Figure 4.Dynamic information on the solar radiation pressure force for CHAM, GRCA, SWRA and SWRB satellites’orbit prediction.
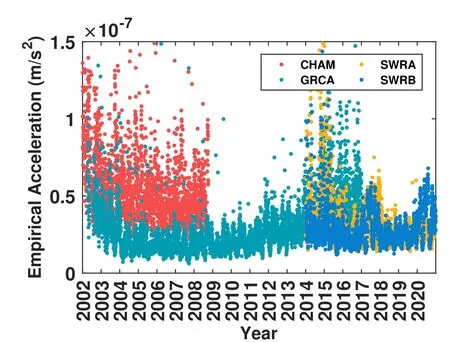
Figure 5.Dynamic information of the empirical force for CHAM, GRCA,SWRA and SWRB satellites’orbit prediction.
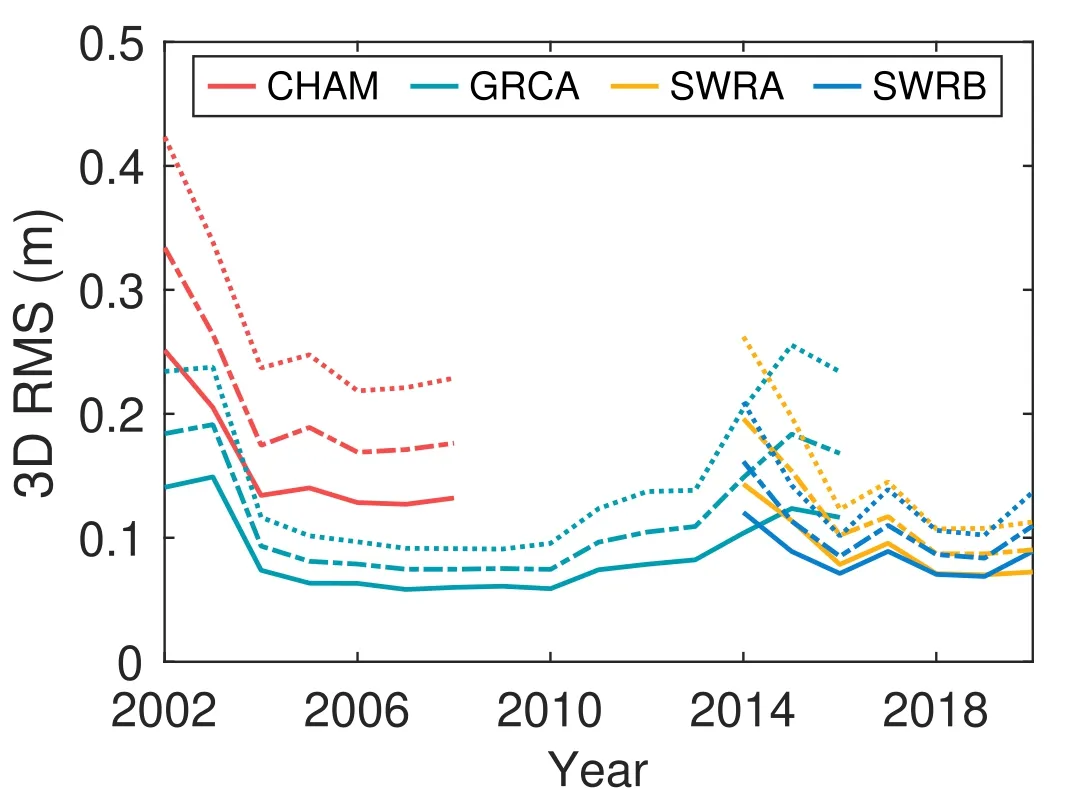
Figure 6.Three-dimensional rms accuracy of CHAM, GRCA, SWRA and SWRB satellites’orbit predictions from 2002 to 2020.The solid line, dashed–dotted line and dotted line represent the results at 10, 20, and 30 minutes,respectively.
Figure 5 depicts the change in empirical force acceleration from 2002 to 2020.Empirical perturbations are used to explain the forces which act on the LEO satellites but cannot be precisely modeled (Zhao 2004).Similarly, the variation tendency of empirical force acceleration during the testing period corresponds to that of the solar activity.Taking the GRCA satellite as an example,the mean and root-mean-square(rms) values of empirical perturbation acceleration in the lowsolar-activity years are 2.67E-08 and 3.09E-08 m s-2, respectively,while the same values in the high-solar-activity years are 3.19E-08 and 4.22E-08 m s-2, respectively.Clearly, the empirical force acceleration is higher in years of high solar activity, which means solar activity has a greater and more complex impact on the satellite orbit perturbation.The magnitude of these unknown or unmodeled perturbation forces becomes greater,which may lead to erroneous estimation of the dynamic parameters.It is more difficult to describe the detailed forces acting on the satellites with the current force model,which further restricts the accuracy of LEO satellite orbit prediction.As the same,the empirical force accelerations of the CHAMP and SWARM satellites show a gradual downward trend when the solar activity calms down.Interestingly, the empirical force acceleration level of SWRA and SWRB shows an increasing trend as the solar activity becomes more active in the year of 2020.

Figure 7.Three-dimensional rms values of CHAM,GRCA,SWRA,SWRB satellites’orbit prediction for 10 minutes.The green line in each panel is the fitting result(higher-order polynomial fitting).
3.3.Orbit Prediction Results and Discussion
To evaluate the orbit prediction accuracy, we compared the prediction results with precise orbit products using the rms statistical values of radial (R), tangential (T), normal (N), and three-dimensional (3D) directions, respectively.The precise orbit products of the CHAM and GRCA satellites can be found at the GFZ German Research Centre for Geosciences (ftp://isdcftp.gfz-potsdam.de/champ/;ftp://isdcftp.gfz-potsdam.de/grace/).The precise orbit products of the SWRA and SWRB satellites can be found at the European Space Agency (ftp://swarm-diss.eo.esa.int/).
The overall rms values of prediction of orbit in 3D direction for 10, 20, and 30 minutes are shown in Figure 6.Due to the accumulation of the errors from models and dynamic parameters in orbit integration, the longer the prediction time is, the lower the prediction accuracy.For the CHAM satellite,the 3D rms for 10,20,and 30 minutes is 12 ~25,16 ~33,and 21 ~42 cm, respectively.For the GRCA satellite, the 3D rms for 10, 20, and 30 minutes is 5 ~14, 7 ~19, and 9 ~25 cm,respectively.For the SWRA satellite, the 3D rms for 10, 20,and 30 minutes is 7 ~14,8 ~19,and 10 ~26 cm,respectively.For the SWRB satellite,the 3D rms for 10,20,and 30 minutes is 6 ~12,8 ~16,and 10 ~20 cm,respectively.This is mainly due to the rapid change in dynamic information on LEO satellites in short time, which limits high-precision orbit prediction for long arcs.Therefore, according to the different accuracy requirements, the LEO orbit prediction length should be considered in LEO navigation enhanced systems.
Figure 7 shows the detailed 10 minutes orbit prediction series in a 3D direction.The average rms statistical values for different predicted arc lengths are given in Table 3.The influence of solar activity on dynamic parameters is directly reflected in the prediction accuracy.First,for all LEO satellites,the prediction accuracy in the T direction is the worst.The main reason for this is that the most obvious perturbation force affecting the T direction is atmospheric drag, which is obviously affected by solar activity.Second, when the solar activity is relatively high (2000–2003, 2011–2014), the orbit prediction accuracy is relatively low and the prediction accuracy variation is more intense, as seen from Figure 7.Taking the GRCA satellite as an example, the PCC of 3D rmsof 10, 20, and 30 minutes and solar activity (represented by SSN) are 0.69, 0.69, and 0.68, respectively.These results indicate that there is a significant positive correlation between the solar activity and LEO satellites’orbit prediction accuracy.In general, the average orbit prediction rms of 10, 20, and 30 minutes in the 3D direction in low-solar-activity years is 0.09, 0.12, and 0.15 m, respectively.The average orbit prediction rms of 10, 20, and 30 minutes in the 3D direction in high-solar-activity years is 0.15, 0.20, and 0.26 m,respectively, which correspond to increases of 59%, 63%,and 68%, respectively.In addition, the orbit prediction fitting results are essentially consistent with the solar activity(represented by SSN).Although the orbit height of GRCA was still decreasing in 2015–2016, the prediction accuracy gradually improves when the solar activity calms down,which is consistent with the change in solar pressure acceleration(Figure 3), atmospheric drag acceleration (Figure 4) and empirical force acceleration(Figure 5).The same can be found for SWRA and SWRB satellites.When the solar activity in 2020 gradually increased compared to 2019, the accuracy of orbit prediction gradually decreased.Therefore, it can be concluded that solar activity has an important effect on LEO satellites’orbit prediction accuracy, and the influence of solar activity should be fully considered when forecasting the precise orbit of LEO satellites.

Table 3 Rms Values of Prediction Orbit for CHAM, GRCA, SWRA and SWRB Satellites (unit: m)
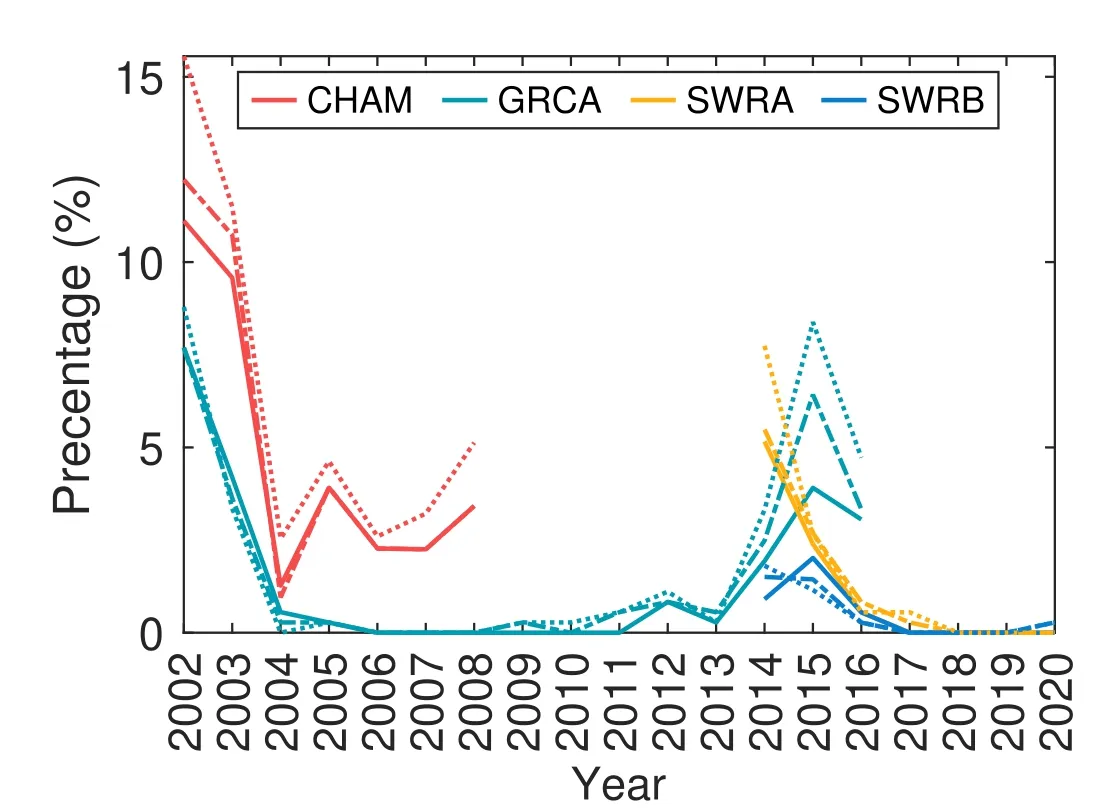
Figure 8.Percentage of extreme cases in orbit prediction from 2002 to 2020.The solid line, dashed–dotted line and dotted line represent the results of 10,20, and 30 minutes, respectively.
It is noted that there is some large rms of prediction cases seen in Figure 7, which exceed expectations.Here, we define the 3D rms threshold for 10, 20, and 30 minutes is 1, 1.5, and 2.0 m,respectively.As seen in Figure 8,the percentage of large rms of prediction cases in low-solar-activity years is very low.However, in high-solar-activity years, atmospheric drag, solar radiation pressure and empirical force are larger and change more intensely than in low-solar-activity years.It is difficult to accurately describe satellite forces over a short time with dynamic models.This results in poor estimation of dynamic parameters, low prediction accuracy, and more extreme cases.GRCA orbit prediction provides perfect evidence to prove this point.From 2002 to 2008, solar activity entered the end of its 23rd cycle, and the solar activity level was gradually decreasing.The proportion of low-accuracy orbit prediction for GRCA was also gradually decreasing.However, since 2008, and the beginning of the 24th solar cycle, solar activity has become increasingly active, and the proportion of lowaccuracy orbit predictions has gradually increased.This situation peaked in 2015, when solar activity was also at its most active period.From 2015 to 2016, although the GRCA satellite gradually entered its retirement stage,the proportion of low-accuracy orbit predictions gradually decreased as the magnitude of the solar activity decreased.Figure 9 also provides good proof of this conclusion, looking at the GRCA result in 2014 (high solar activity).Comparing the 3D rms series of orbit prediction (10 minutes) with the LEO perturbation accelerations,when the magnitude of the modeled perturbation accelerations increases, the orbit prediction accuracy is reduced.It is worth noting that extreme cases are also more intensive when the GRCA and CHAM satellites are at the end of their service.This is mainly because the orbital altitude drops rapidly and the magnitude of atmospheric drag force becomes larger.However, the percentage of GRCA extreme cases in 2016 is still lower than in 2015, which is consistent with the above analysis of dynamic parameters and orbit prediction accuracy.
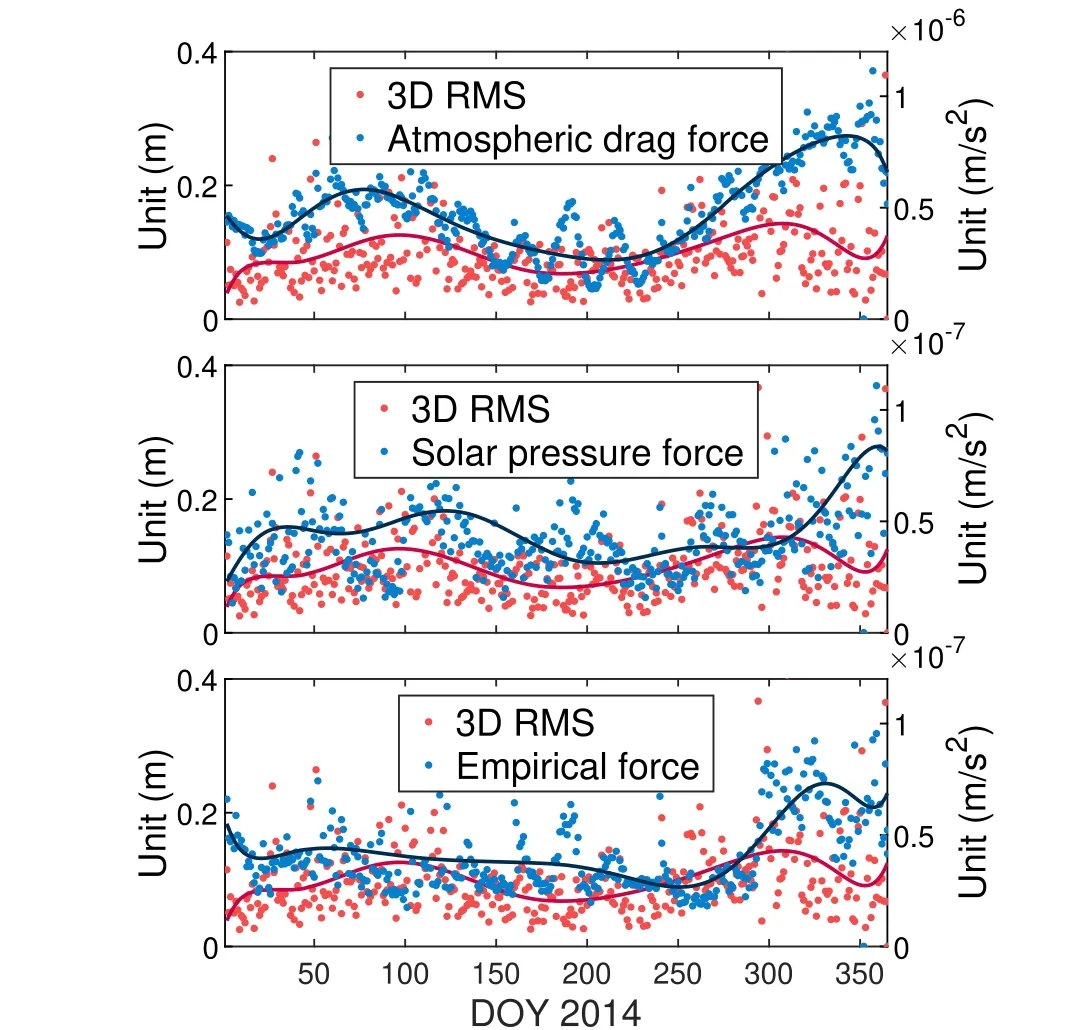
Figure 9.Relationship between orbit prediction accuracy and modeled disturbing force.The blue and red lines are the fitting results (higher order polynomial fitting) for 3D rms and disturbing force, respectively.
4.Conclusions
As a very attractive and promising technology, LEOenhanced navigation systems can provide users with a realtime, high-precision service.Thus, achieving high-precision prediction of LEO satellites’orbits is important.The spaceborne GPS data of the CHAMP, GRACE-A,SWARM-A, SWARM-B satellites over 19 yr (2002–2020)are used in order to analyze the influence of solar activity on LEO satellite orbit prediction.Solar activity has a cycle of nearly 11 yr, and the Earth’s magnetic field activity is significantly affected by this solar activity.The combination of solar activity and the Earth’s magnetic field have a profound impact on the near-Earth environment.In the years of high solar activity, the derivative of ionospheric delay obtained from LEO satellites changes more dramatically and cycle slips are more likely to occur.Hence, the quality of satellite observation data is inevitably affected.The modeled disturbing force related to solar activity on LEO satellites varies over timescales of two decades, especially for atmospheric drag and solar pressure forces.In high-solaractivity years, not only is the magnitude of disturbing forces greater, but these disturbing forces also change more violently.As a result, the estimated dynamic parameters,including the coefficients of atmospheric drag force, solar radiation pressure force and empirical force, show a very similar trend to the solar activity.In the low-solar-activity years, the rms orbit accuracy of 10, 20, and 30 minutes orbit predictions in the 3D direction is 0.09, 0.12, and 0.15 m,respectively.The corresponding values are 0.15, 0.20, and 0.26 m in the high-solar-activity years.There is a strong correlation between LEO satellite orbit prediction orbit accuracy and solar activity.The PCC of the 3D rms orbit predictions(GRCA)for 10,20,and 30 minutes and the solar activity (represented by the SSN index) are 0.69, 0.69 and 0.68, respectively.In the years of high solar activity, lessaccurate orbit-prediction cases are more likely to happen.This work has several reference values for the construction of LEO navigation enhancement system to be used in the future.First,we should seriously consider the impact of solar activity when forecasting LEO orbit and evaluating prediction accuracy.Second, the LEO navigation enhancement system will have certain solar activity prediction ability,and could provide early warnings for orbit prediction in extreme space environments.
Acknowledgments
The authors are grateful to the CODE for providing GPS products.GFZ is gratefully acknowledged for providing the GRACE and CHAMP satellites data.ESA is gratefully acknowledged for providing the SWARM satellites data.The authors also thank the World Data Center SILSO (Royal Observatory of Belgium, Brussels) for providing sunspot data.The authors would like to thank the CelesTrak (https://celestrak.com/) team for providing F10.7, KP and AP data.In addition, the editor and the reviewers are appreciated for their constructive remarks that improved the original manuscript.This study was supported by the National Natural Science Foundation of China (Grant Nos.12173072 and 12103077).
ORCID iDs
Jun-Jun Yuan https://orcid.org/0000-0002-2251-1747
杂志排行
Research in Astronomy and Astrophysics的其它文章
- Period Investigation on Two W UMa Binaries HH UMa and V1175 Her
- Photometric Monitoring of Blazar 3C 66A with the Yunnan University Astronomical Observatory 1m Telescope
- Constraining the Temperature-density Relation of the Inter-galactic Medium from Analytically Modeling Lyα Forest Absorbers
- 3D Kinematics of Classical Cepheids According to GaiaEDR3 Catalog
- Collaborative Simulation of Mechanical Structure and Control Systems of Leighton Chajnantor Telescope
- The Variability and Radial Velocity of Planetary Nebula Central Stars
