Novel models for simulating maize growth based on thermal time and photothermal units: Applications under various mulching practices
2023-05-08LIAOZhenqiZHENGJingFANJunliangPEIShengzhaoDAIYulongZHANGFucangLIZhijun
LIAO Zhen-qi, ZHENG Jing, , FAN Jun-liang#, PEI Sheng-zhao, DAI Yu-long, ZHANG Fu-cang, LI Zhi-jun
1 Key Laboratory of Agricultural Soil and Water Engineering in Arid and Semiarid Areas, Ministry of Education, Northwest A&F University, Yangling 712100, P.R.China
2 Institute of Mountain Hazards and Environment, Chinese Academy of Sciences, Chengdu 610041, P.R.China
Abstract Maize (Zea mays L.) is one of the three major food crops and an important source of carbohydrates for maintaining food security around the world.Plant height (H), stem diameter (SD), leaf area index (LAI) and dry matter (DM) are important growth parameters that influence maize production.However, the combined effect of temperature and light on maize growth is rarely considered in crop growth models.Ten maize growth models based on the modified logistic growth equation (Mlog) and the Mitscherlich growth equation (Mit) were proposed to simulate the H, SD, LAI and DM of maize under different mulching practices based on experimental data from 2015–2018.Either the accumulative growing degree-days (AGDD), helio thermal units (HTU), photothermal units (PTU) or photoperiod thermal units (PPTU, first proposed here) was used as a single driving factor in the models; or AGDD was combined with either accumulative actual solar hours (ASS), accumulative photoperiod response (APR, first proposed here) or accumulative maximum possible sunshine hours (ADL) as the dual driving factors in the models.The model performances were evaluated using seven statistical indicators and a global performance index.The results showed that the three mulching practices significantly increased the maize growth rates and the maximum values of the growth curves compared with non-mulching.Among the four single factor-driven models, the overall performance of the MlogPTU Model was the best, followed by the MlogAGDD Model.The MlogPPTU Model was better than the MlogAGDD Model in simulating SD and LAI.Among the 10 models, the overall performance of the MlogAGDD–APR Model was the best, followed by the MlogAGDD–ASS Model.Specifically, the MlogAGDD–APR Model performed the best in simulating H and LAI, while the MlogAGDD–ADL and MlogAGDD–ASS models performed the best in simulating SD and DM, respectively.In conclusion, the modified logistic growth equations with AGDD and either APR, ASS or ADL as the dual driving factors outperformed the commonly used modified logistic growth model with AGDD as a single driving factor in simulating maize growth.
Keywords: thermal time, accumulative growing degree-days, helio thermal units, photothermal units, growth model
1.Introduction
Crop growth models use mathematical equations to describe the responses of crop growth, development, yield and other variables to environmental conditions (e.g., temperature, radiation and rainfall) and crop management practices (e.g., irrigation and fertilization).They integrate the current knowledge of plant growth and development processes in various disciplines, including crop science, agronomy, physiology, soil science, agricultural engineering and agrometeorology.Crop growth models have been widely used in crop management, research, teaching, yield forecasting, policy analysis and decisionmaking, but there are still many restrictions in their practical applications (Sandhu and Irmak 2020).The mathematical models involved in crop growth models are generally divided into two categories: classical models and Bayesian models.Classical models are mainly the S-shaped growth curve functions, such as the curve fitting and logistic function, best index slope extraction and experience methods.The nature of probabilitybased Bayesian techniques can help to overcome the shortcomings of classical models that are unable to detect multi-dimensional and unknown data.
With the development of crop growth models, they can now support the simulation of plant physiological processes, crop growth and development, and new methodological extensions have been added to crop growth models for simulating the impacts of nutrients limitations, extreme events and climate variability (Todorovicet al.2009).Crop growth models can generally be divided into three categories: carbondriven, light-driven and soil moisture-driven models, which mainly use the thermal time to define different phenological stages (Akyuzet al.2017).The carbondriven crop models are mainly carbon assimilation growth and development models based on photosynthesis, such as the Wageningen Model (van Ittersumet al.2003).The light-driven models are based on canopy light interception and the cumulative biomass, focusing on the conversion of light energy efficiency, such as the EPIC (Williamset al.1989), DSSAT (Joneset al.2003), APSIM (Keatinget al.2003) and STICS (Brissonet al.2003) models.The soil moisture-driven models clarify the relationships between crop transpiration, soil moisture and biomass formation, such as the AquaCrop Model (Stedutoet al.2009).The WOFOST Model uses carbon-driven methods and light interception radiation to simulate crop growth (Van Diepenet al.1989; De Witet al.2019).There are some crop growth models that quantitatively describe the effects of soil moisture and light on crop growth, but most of them first establish the relationship between water or light and crop growth, and then use another factor as a limiting factor, such as the CropSyst Model (Stöckleet al.2003) which is based on soil moisture and radiation driving modules.In particular, there are still no models that can quantitatively describe their interacting effects on crop growth.Lizasoet al.(2005) described a simple quadratic model for simulating maize plant height as a function of the final plant height and developmental stage.In the process of constructing crop growth models, most of them ignore the impacts of photoperiod on crop growth and development, and even ignore the interaction between light and temperature.There are also certain defects in the mechanism description, which lead to great risks in the regional application of crop growth models.
The growth and development of crops are affected by a variety of environmental factors, among which temperature is one of the most important influencing factors that determines the level of potential crop production.It is usually expressed in terms of thermal time (TT) as accumulative growing degree-days (AGDD) (Heet al.2020; Subrahmaniyanet al.2021).AGDD represents crop heat demand, which may involve the impacts of climate change and variability on crop development and growth (Kumudiniet al.2014).AGDD has been widely used in crop growth and development simulation.However, the AGDD function does not consider many factors that restrict crop development, such as soil moisture stress and photoperiod.Therefore, the resulting models usually cannot accurately predict phenology, and thus are not able to accurately predict the growth of crops (Ghamghamiet al.2019).
Photoperiod sensitivity is a key factor in plant adaptation and crop production (Buet al.2021).The photoperiod controls many developmental responses of animals, plants and even fungi; and for crops, the length of sunshine enables developmental events to be consistent with specific environmental conditions (Ghamghamiet al.2019).The coordinated response to photoperiod control has also been observed in plants.For example, at a specific time of the year, plants of the same species bloom simultaneously to maximize crossfertilization.Plants are able to regulate the photoperiod through an endogenous timing mechanism called the circadian clock, which means that plants can measure time accurately (Borchertet al.2005).
There are three main photoperiod response types: short-day plants (SDP) such as maize, day-neutral plants (DNP) and long-day plants (LDP).Warrington and Kanemasu (1983) found that the photoperiod affects the time interval from seedling emergence to tassel differentiation and tassel emergence in maize.The light integral, temperature, photoperiod and gibberellic acid have all been shown to affect the length of the seedling stage and the response point of the plant to the photoperiod (Adamset al.2001).The light-response (photoperiod) not only controls temperature changes but also regulates the vegetative growth and flowering of plants.In several crops, the growth rate has been shown to be related to temperature and photoperiod (Elliset al.1992).Crop ontogeny prediction is the key to the successful application of crop simulation in crop adaptability research, which requires accurate descriptions of the temperature and photoperiod responses under field conditions.
The main factors driving phenology (temperature and photoperiod) are usually covariant in nature and may interact with each other (Flynn and Wolkovich 2018).Therefore, some scholars have used heat-light units such as helio thermal units (HTU) and photothermal units (PTU) as the predictive factors of crop growth models (Kukal and Irmak 2018; Johalet al.2020).To make a non-linear and accurate prediction of maize growth under different mulching practices, it is necessary to explore the driving factors that are most suitable for the maize growth models.In this study, the modified logistic and Mitscherlich growth models were used to simulate various maize growth parameters.By comparing the simulation performance of AGDD, we then incorporated various thermal time and light units as new driving factors into the crop growth models, and the simulation performance using dual driving factors was further evaluated.This approach is of great significance for quantitatively simulating the growth of maize by considering both light and temperature accumulation.The results of this study can further improve the performance of maize growth simulation under different mulching practices.
2.Materials and methods
2.1.Experimental site and experimental design
The field experiment was carried out at the Water-saving Station of the Key Laboratory of Agricultural Water and Soil Engineering (34°18´N, 108°24´E) sponsored by the Ministry of Education, at Northwest A&F University, Yangling, China.This area experiences a warm temperate monsoon climate.The annual average sunshine time exceeds 2 000 h, the annual average temperature is 12.9°C and the frost-free period exceeds 210 d.The average annual precipitation during 1995–2019 was 580 mm, and the average annual pan evaporation was 1 500 mm.The soil is silty clay loam, with the permanent wilting point of 0.15 cm3cm–3, field water holding capacity of 0.33 cm3cm–3, saturated water content of 0.46 cm3cm–3and dry bulk density of 1.4 g cm–3.
The experiments were conducted with three replicates during the growing seasons of summer maize (Zhengdan 958)during 2015–2018.Four mulching practices were designed: NM, flat cultivation with non-mulching; SM, flat cultivation with straw mulching; RPBF, plastic-covered ridge with bare furrow; and RPSF, plastic-covered ridge with straw-covered furrow (Zhenget al.2021b).Urea (N≥46%, 180 kg ha–1), superphosphate (P2O5≥16%, 120 kg ha–1) and potassium sulfate (K2O≥51%, 60 kg ha–1) were applied in each treatment before sowing.The planting dates were June 15, June 12, June 14 and June 17, while the harvesting dates were September 30, October 4, October 6 and October 1 in 2015, 2016, 2017 and 2018, respectively.The planting density of summer maize was 66 000 plants ha–1.No irrigation was applied during the maize growing seasons, and there were no obvious diseases, insects or weeds.
2.2.Field measurements
An automatic weather station was set up in the field to automatically record meteorological variables such as air temperature, relative humidity, precipitation, sunshine duration, pan evaporation, wind speed, air pressure and soil temperature.The meteorological data during the experimental periods are shown in Appendix A.
Three maize plants of similar growth stage were selected from each plot to determine plant height (H), stem diameter (SD), leaf area index (LAI) and dry matter mass per plant (DM).Plant samples were dried in an oven at 105°C for 30 min and at 75°C to a constant mass, and weighed as the dry matter.The LAI was calculated as follows:
whereLiis the midrib length of each green leaf;Wiis the maximum width of each green leaf;nis the number of green leaves per plant; 0.75 is the conversion coefficient between the area measured by the maximum length and width of the leaf and the projected area; and D is the planting density.
2.3.Thermal time and photothermal units
Growing degree-day (GDD) is a widely used effective accumulated temperature index, which refers to the sum of the temperature between the upper and lower limits of the biological temperature range that is effective for crop growth and development.The accumulative growing degree-days (AGDD), also called “effective heat unit” (Subrahmaniyanet al.2018), is described as follows (Donget al.2021):
wherenis the number of days from the planting date; andTmaxandTminare the daily maximum and minimum temperatures, respectively.Since the suitable temperature range for the growth and development of summer maize is 10–30°C,TmaxandTminwere set as 10 and 30°C when they were less than 10°C and exceeded 30°C, respectively.
The helio thermal units (HTU) and photothermal units (PTU) are two commonly used PTU, which are expressed as follows (Singhet al.2008; Girijeshet al.2011; Satishet al.2017):
where SS is the actual solar hours and DL is the maximum possible sunshine hours.
Based on the definition of photothermal unit and the consideration of photoperiod (Tollenaar and Hunter 1983; Elliset al.1992; Bonhommeet al.1994), a novel photothermal unit, namely photoperiod thermal units (PPTU), is proposed here as follows:
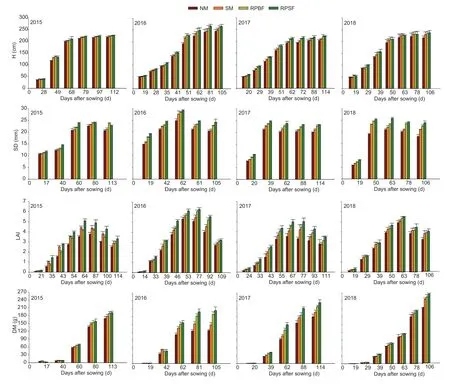
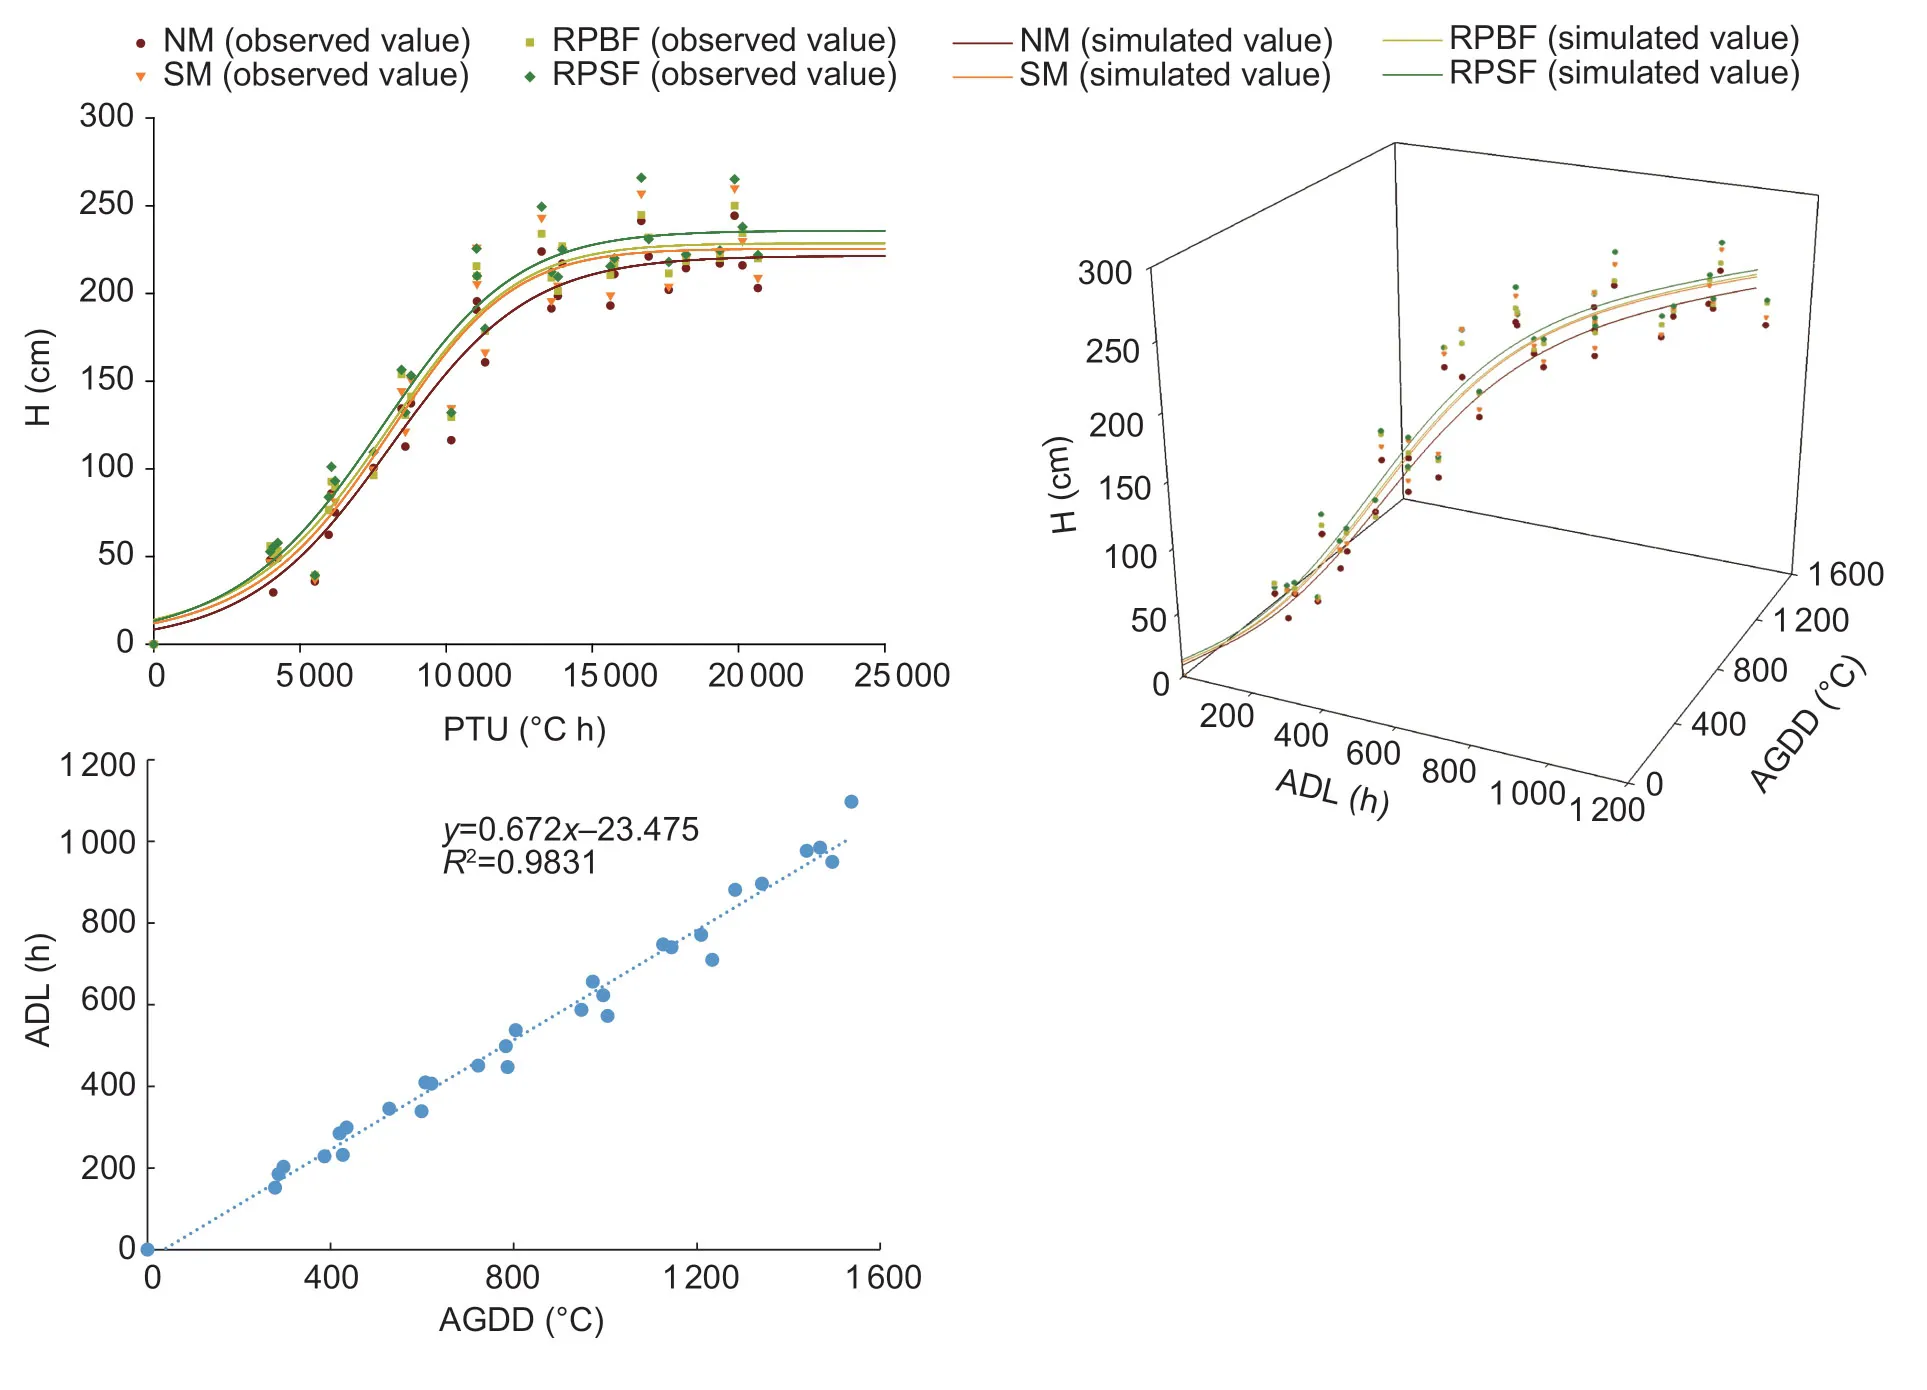
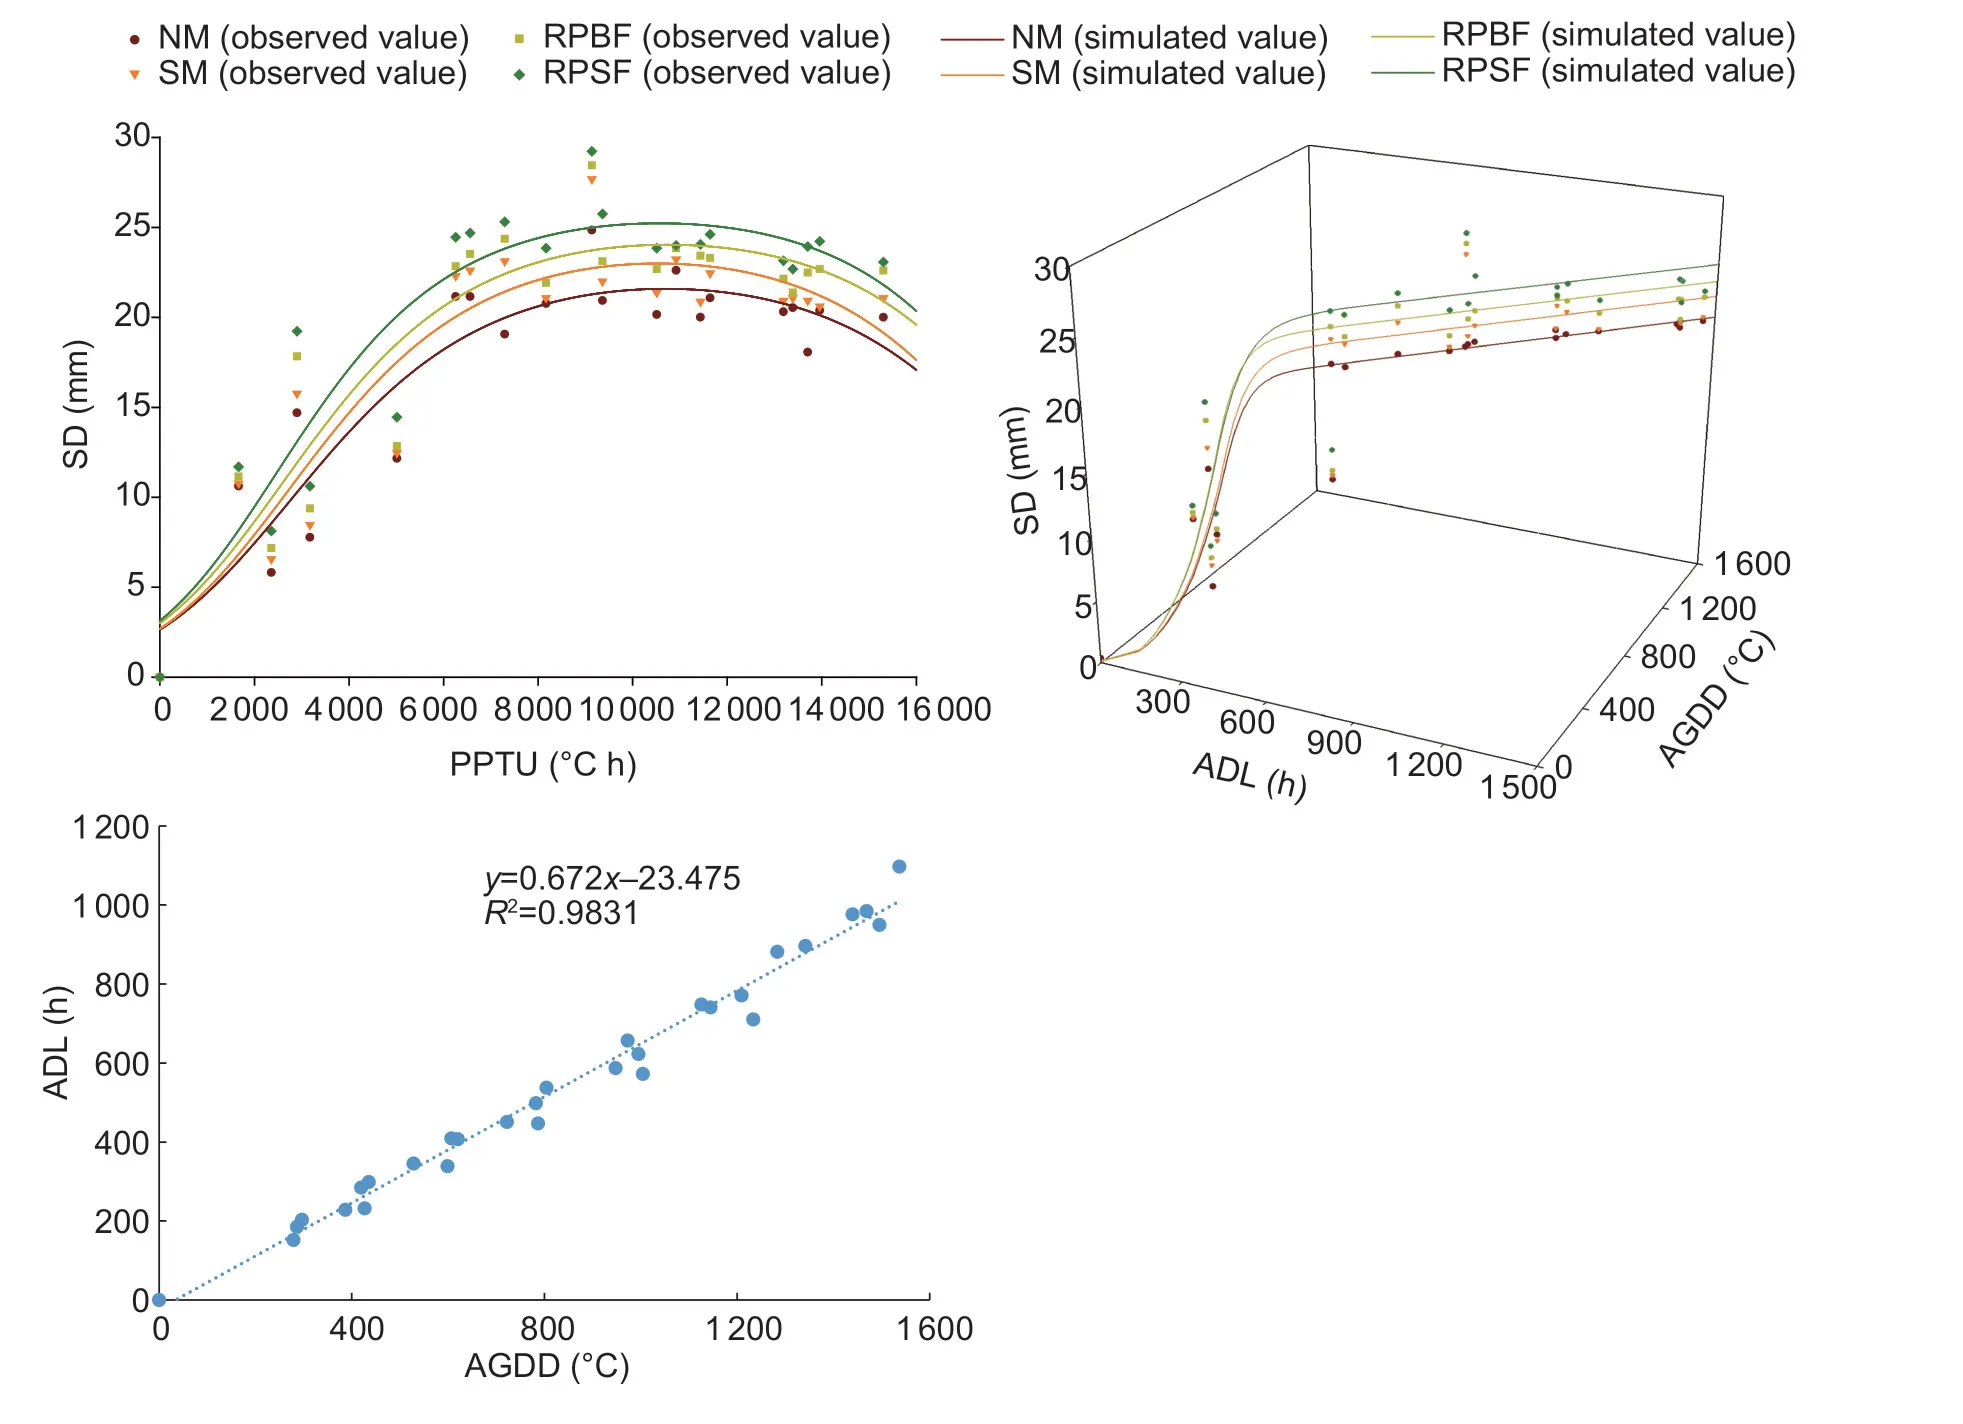
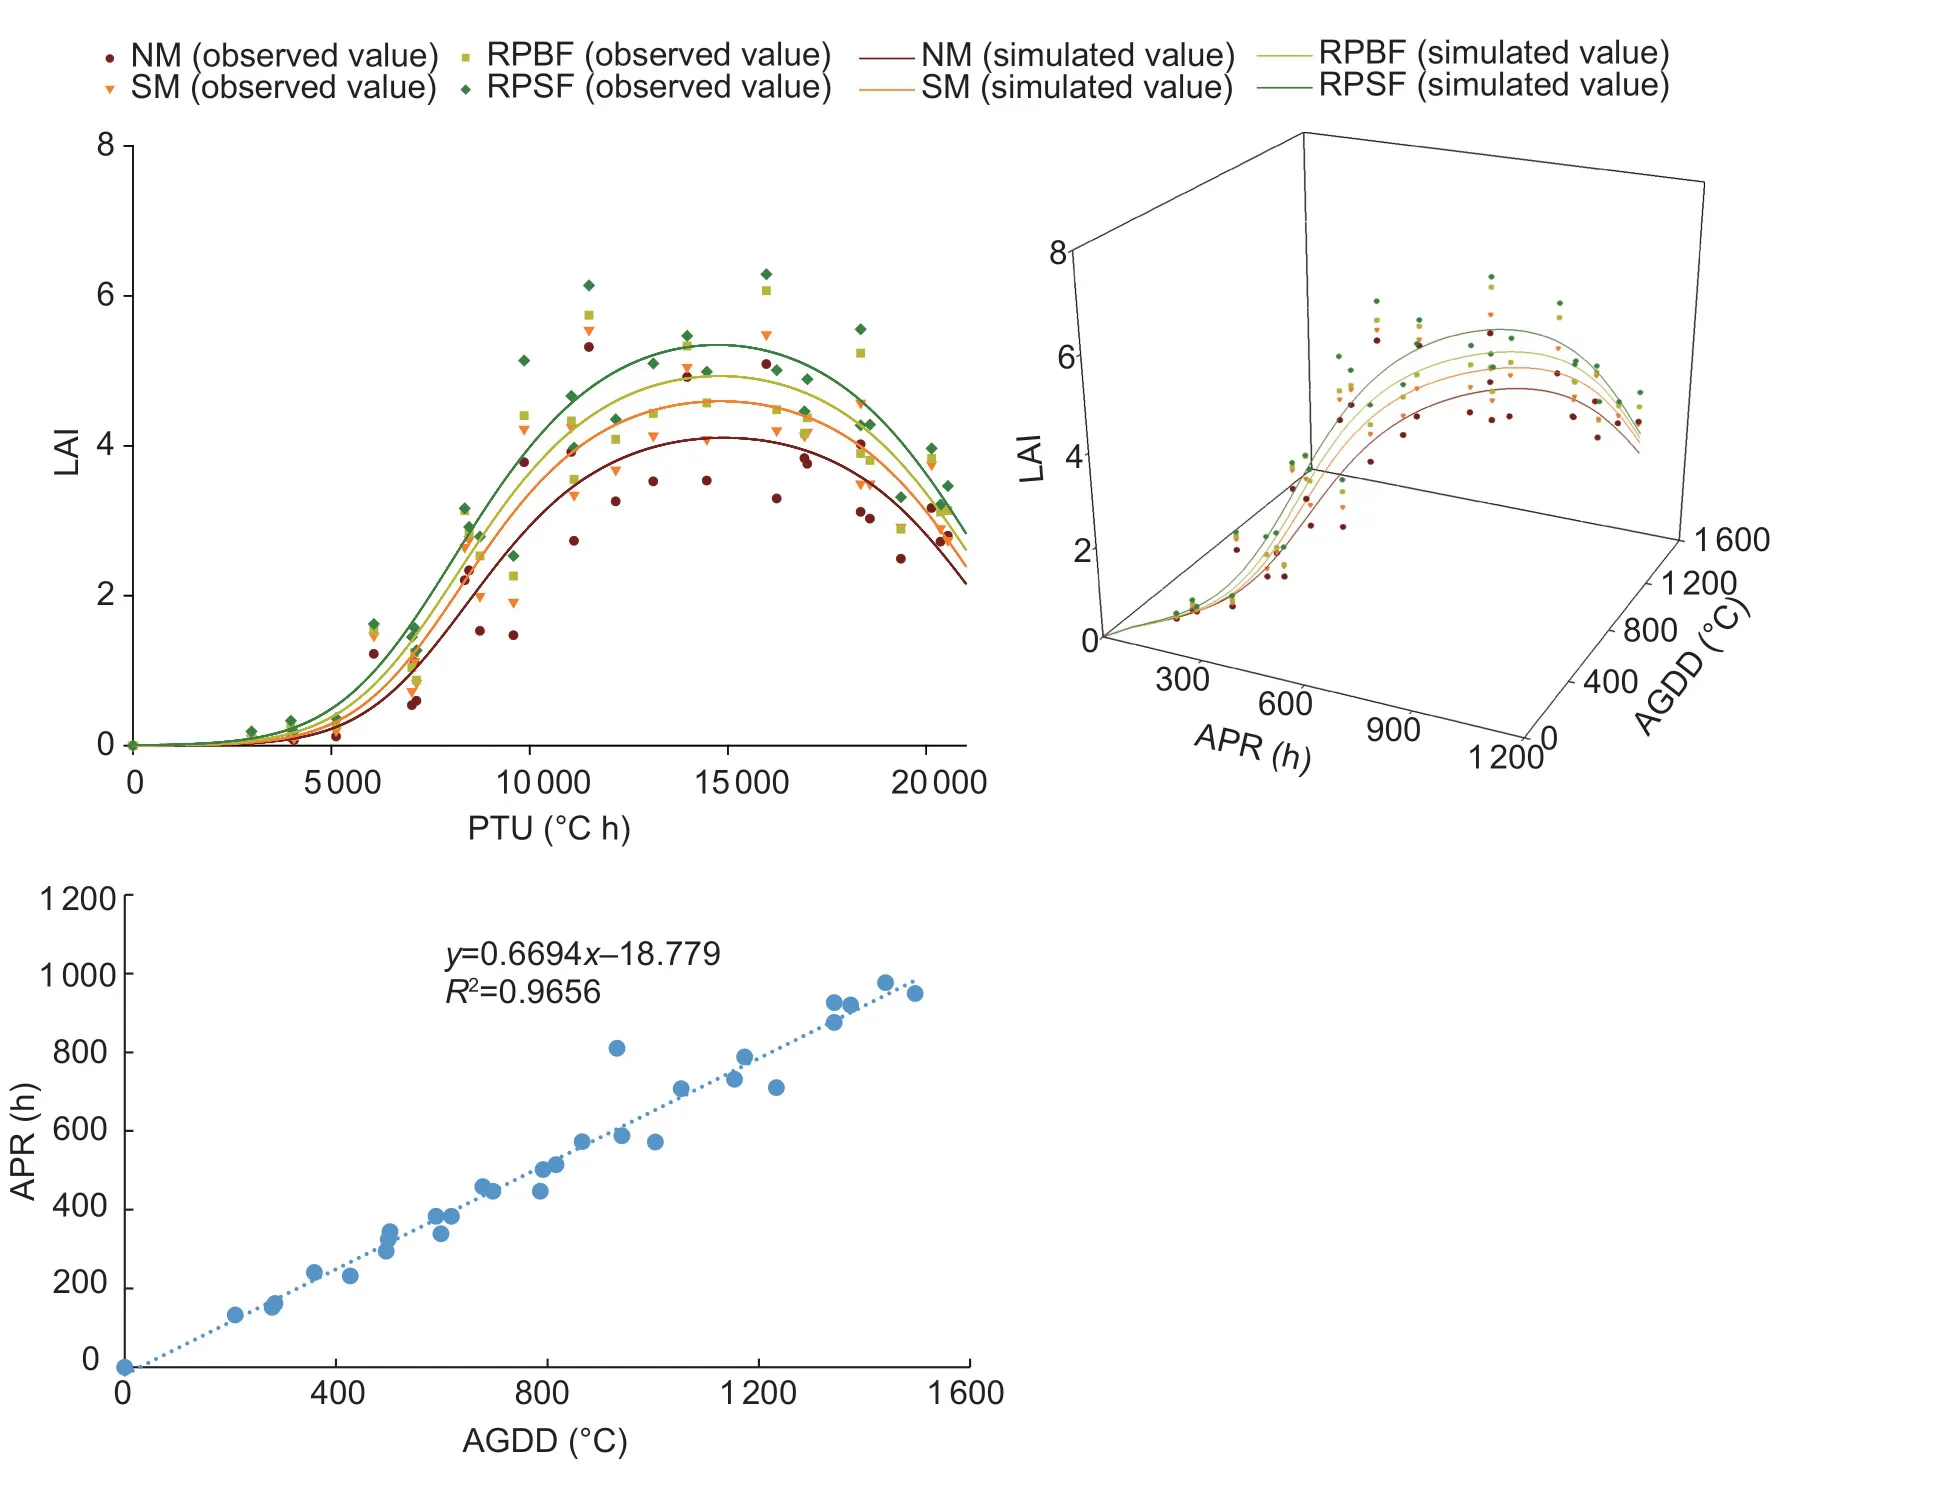
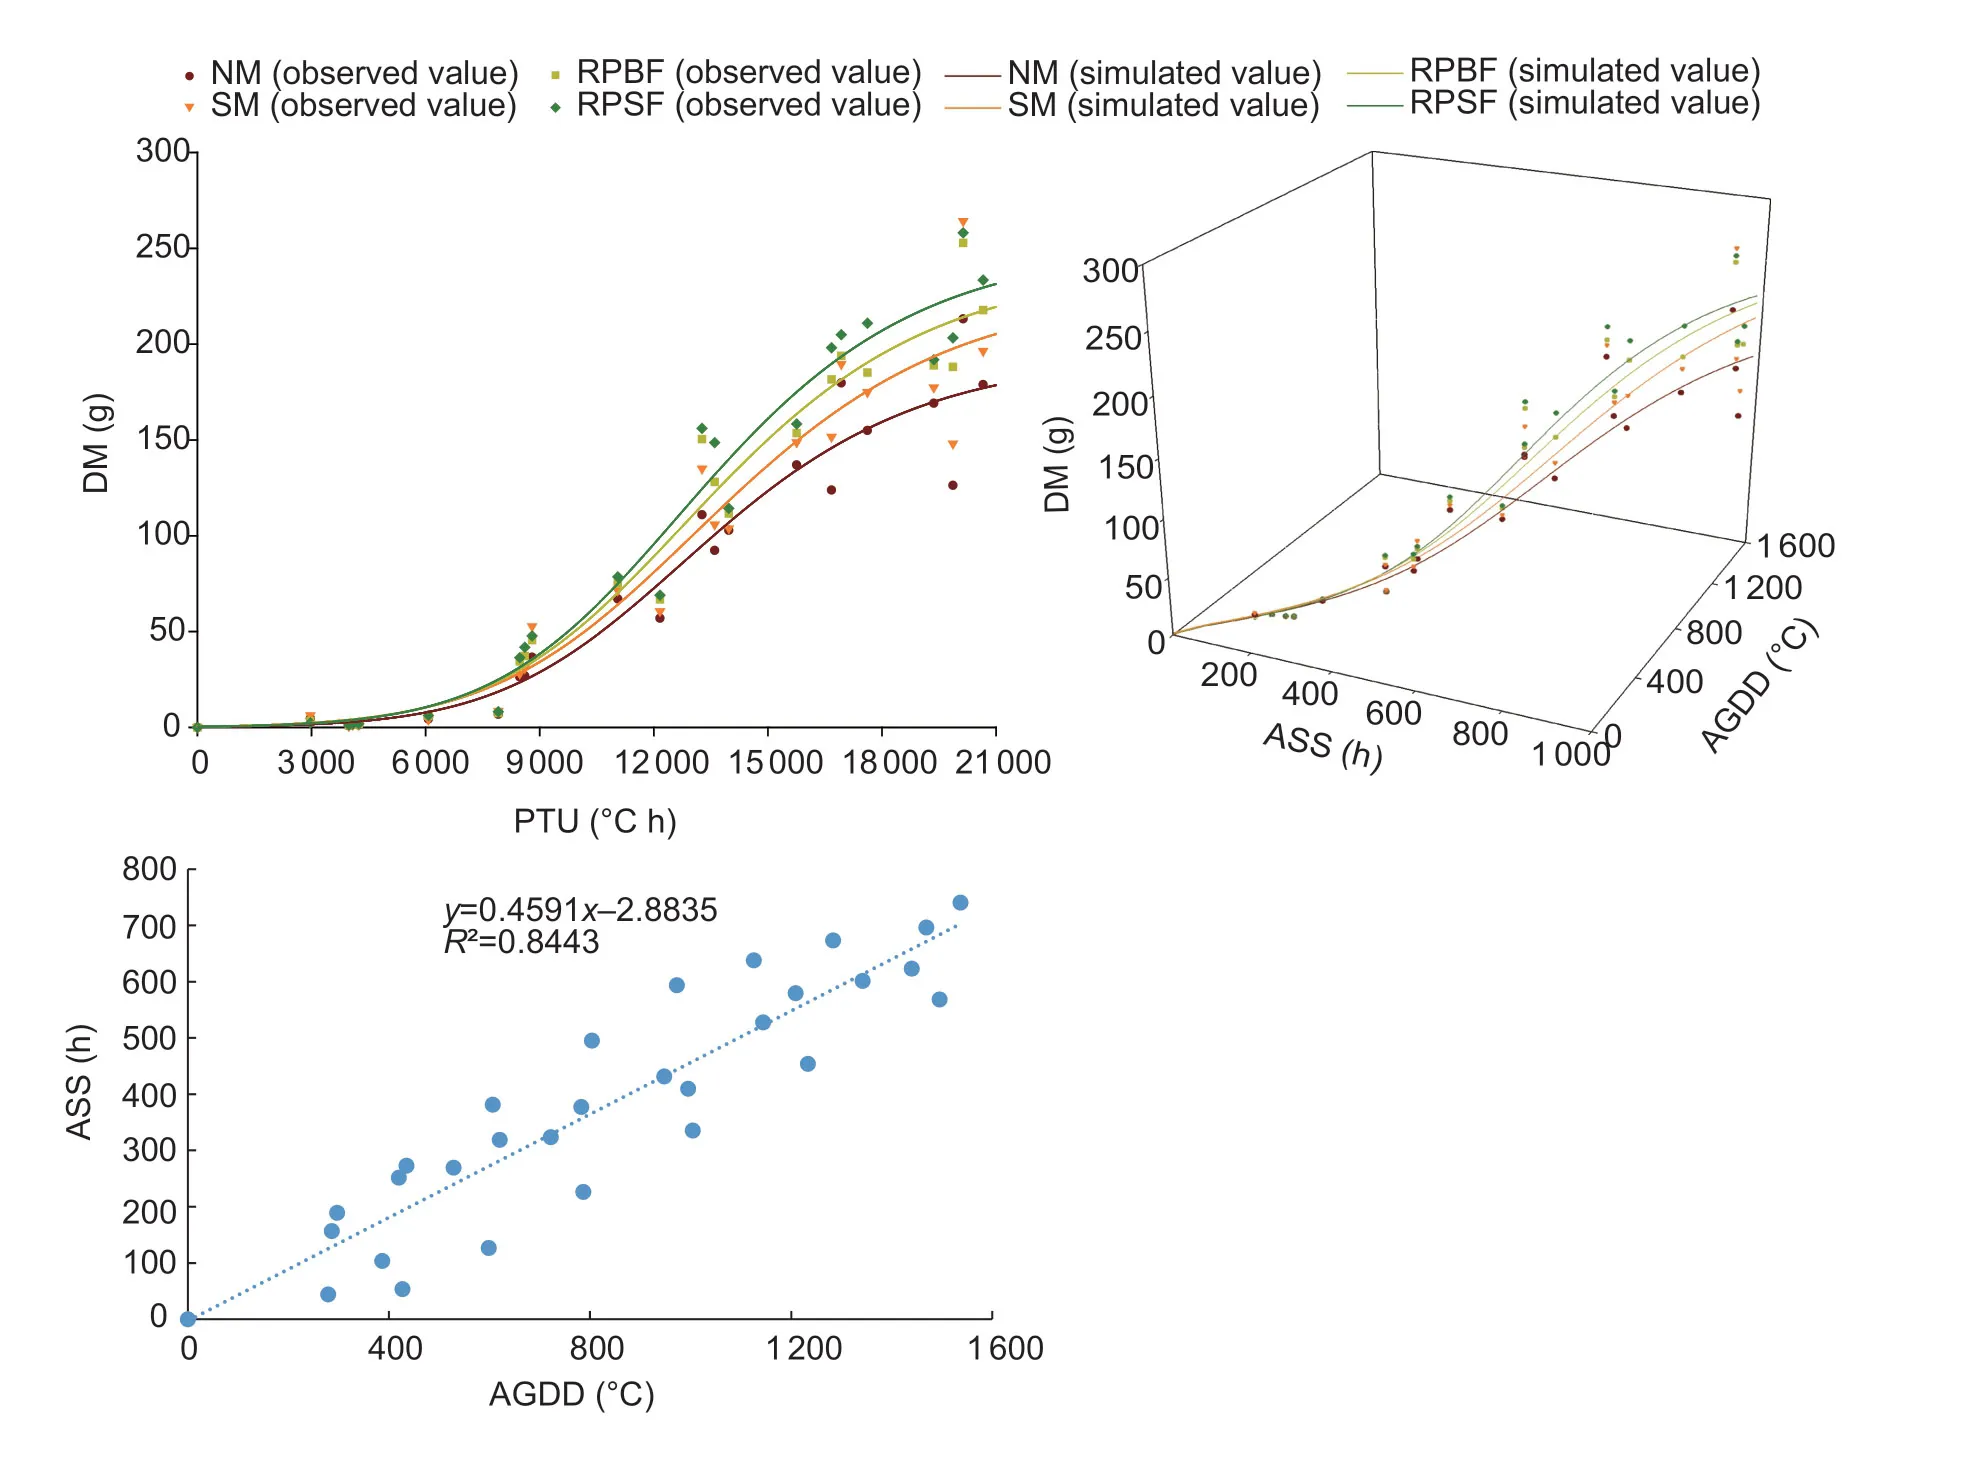
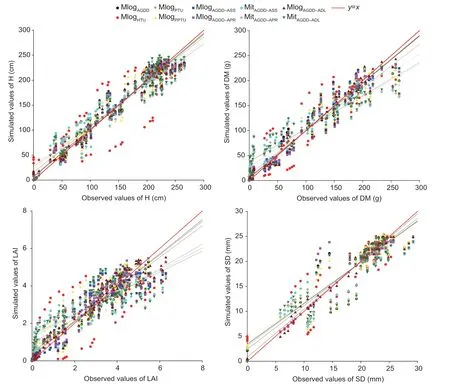
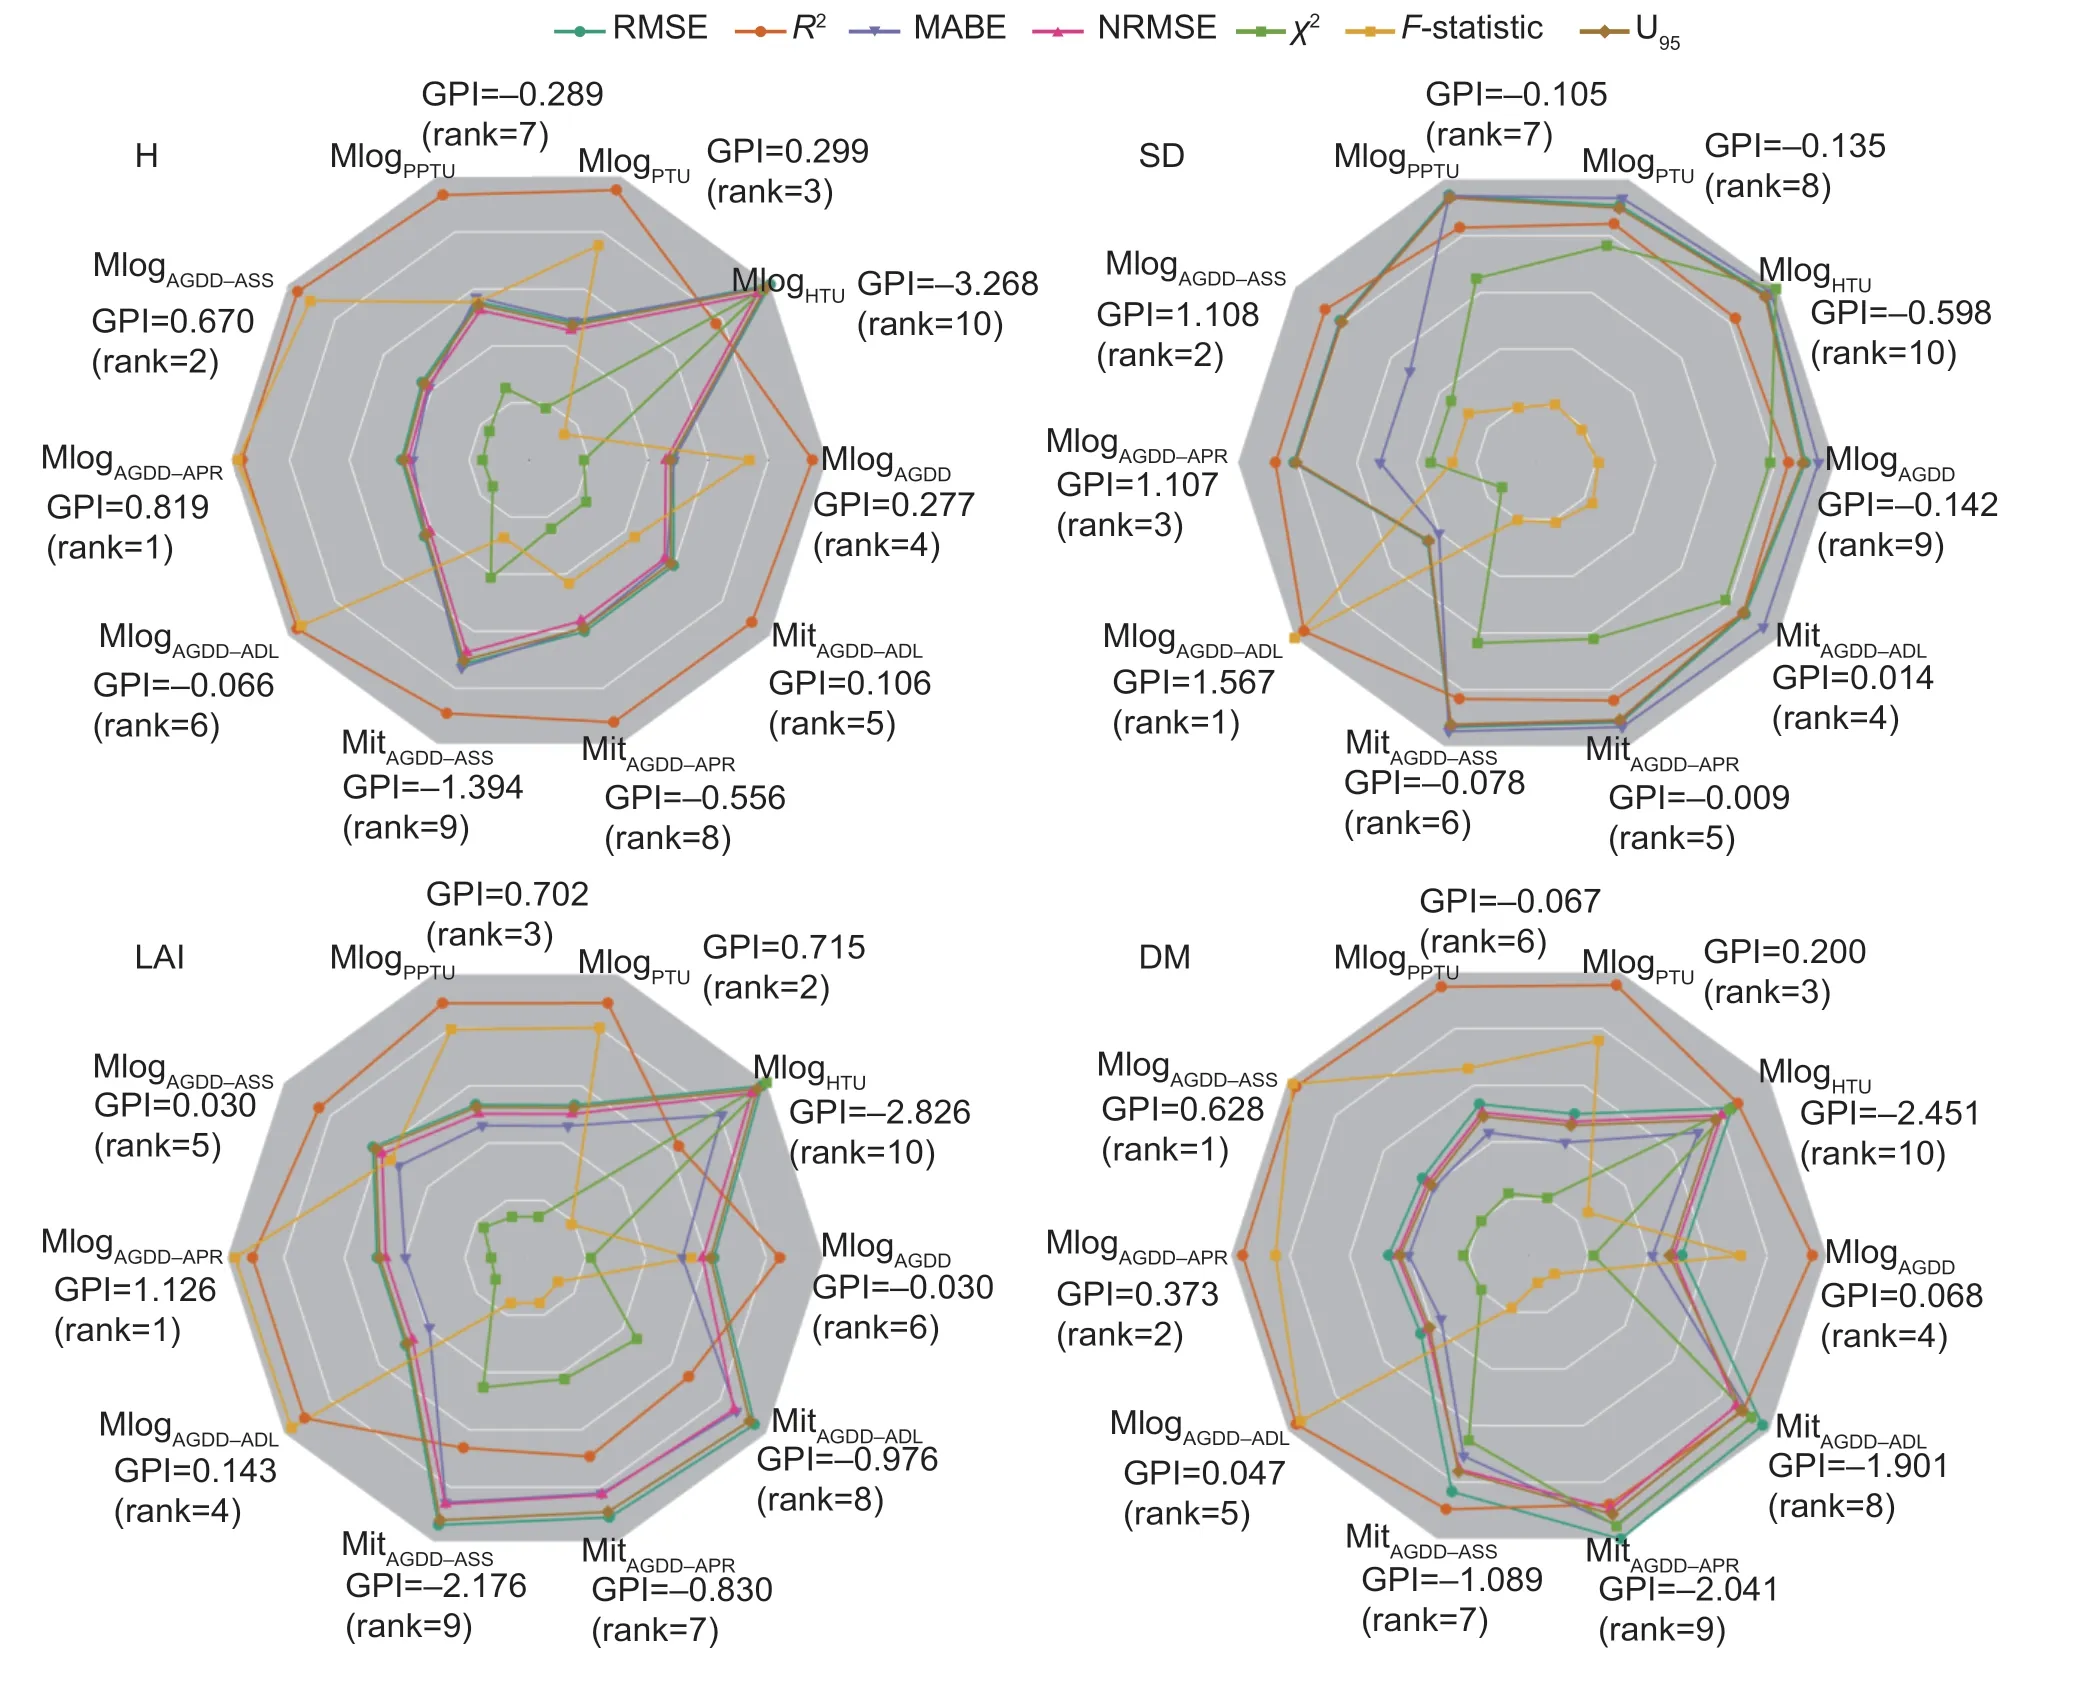
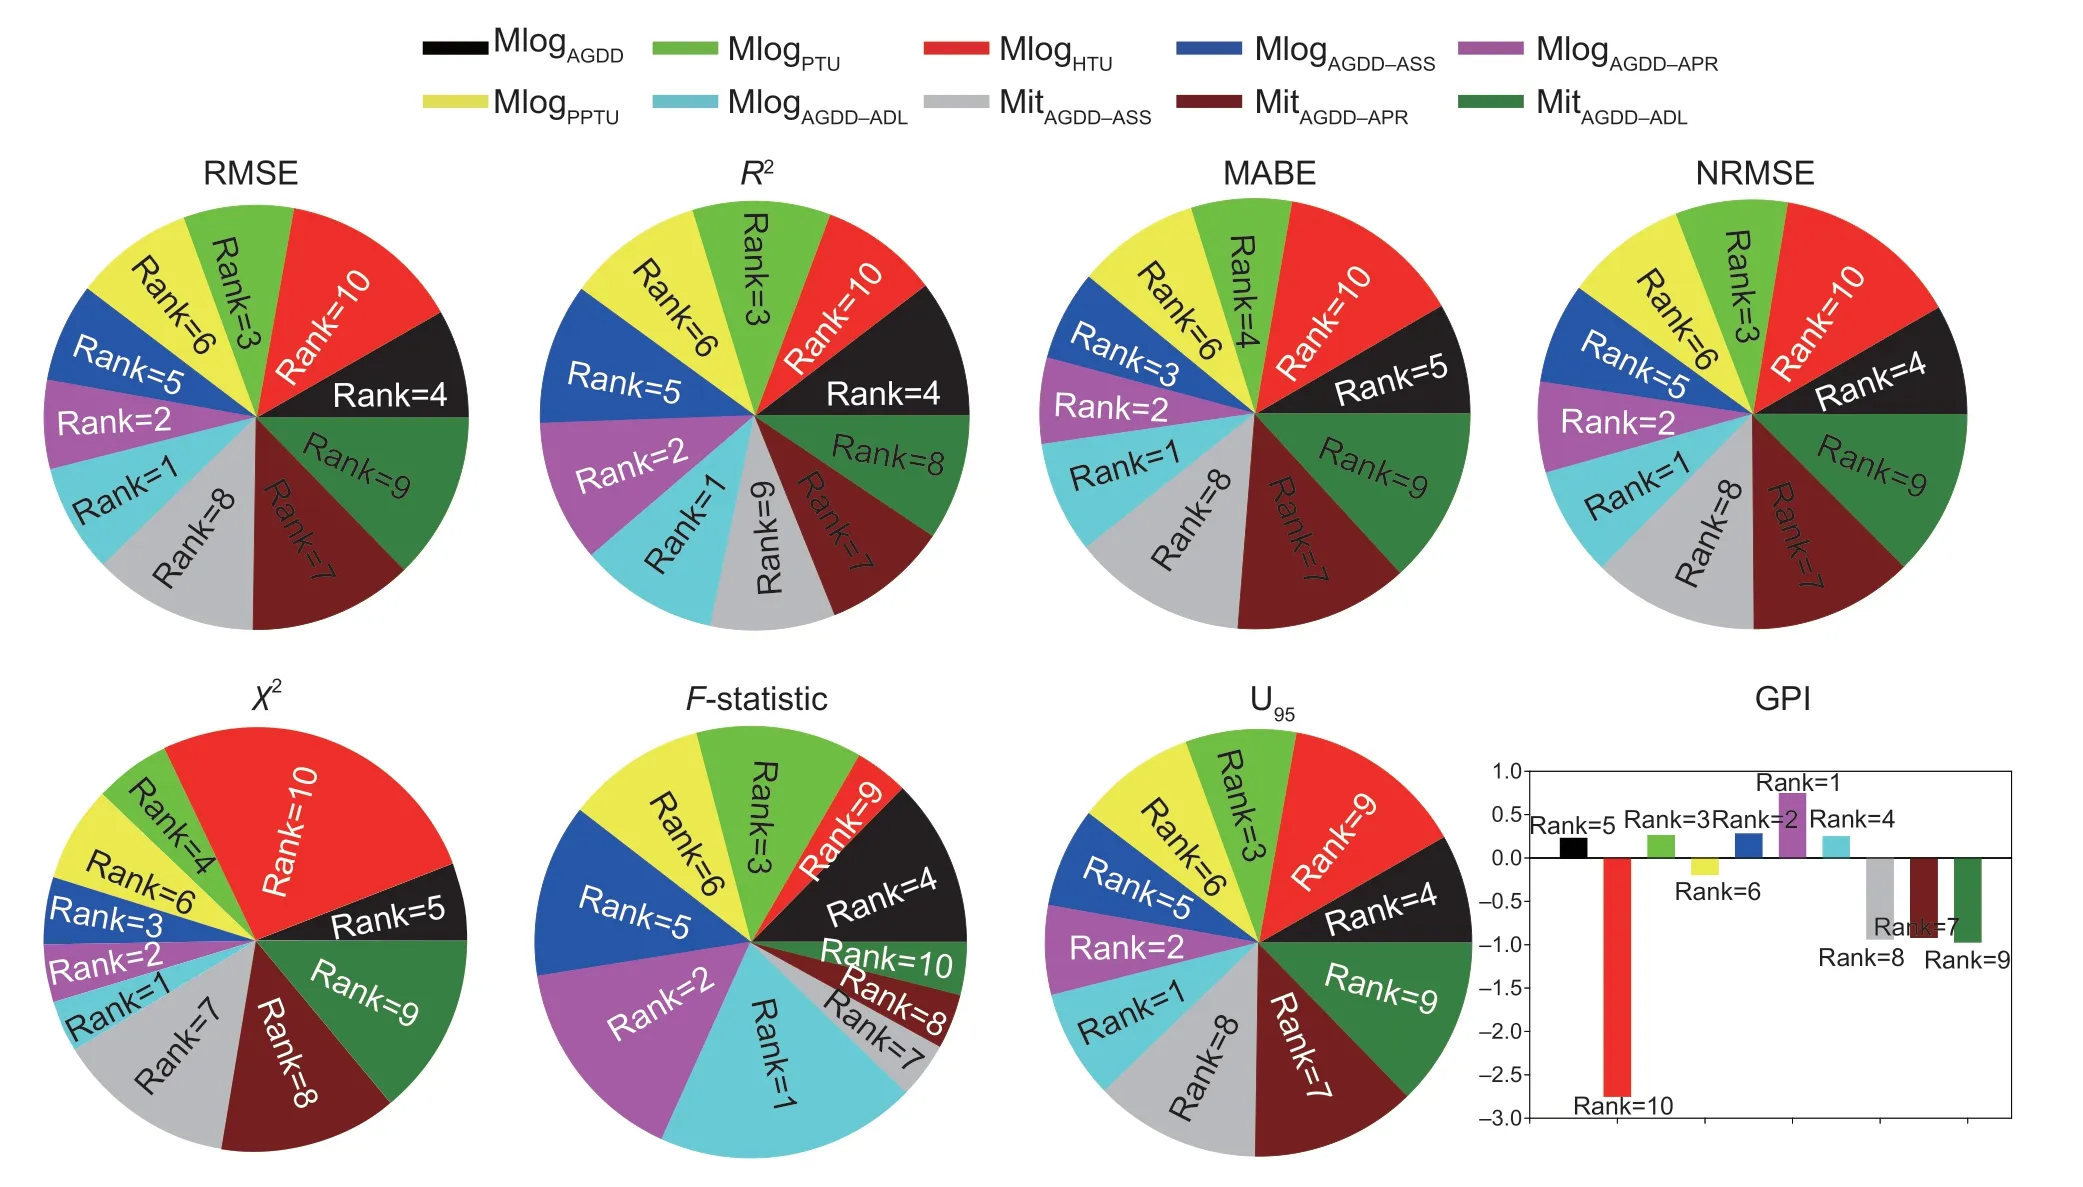
where PR is the photoperiod response.An increasing photoperiod will delay the formation of tassels (Birchet al.1998).PR is an important meteorological element of the crops for assessing the light-heat response and harvest potential yield requirements in different phenological periods (Singhet al.2008).The critical photoperiod and upper photoperiod refer to those low photoperiods and upper photoperiods with no change in the development rate due to the photoperiods (Birchet al.1998).Based on previous studies (Kiniryet al.1983; Warrington and Kanemasu 1983), the critical photoperiod and upper photoperiod of maize were set as 8 and 12.5 h, respectively.PR was assigned the value of SS when 8 h The Sigmoid function is widely used in crop growth simulation because it is easier to interpret parameters from a biological point of view (Wardhani and Kusumastuti 2014).The logistic curve is an S-shaped growth curve used to simulate crop growth.The curve increases slowly at the beginning, rapidly in the middle, slowly towards the end and gradually tends to the maximum (Sepaskhahet al.2011).It has been widely used in the simulation of biomass accumulation, H and LAI.The time-related characteristics of these growth parameters follow an S-shaped growth curve, which can be described by a logistic function, and its parameters have relevant biological significance (Yinet al.2020).The modified logistic growth model proposed by Wanget al.(1986) considers the phenomenon that LAI is greatly reduced due to crop aging, and is expressed as follows (Liet al.2017): whereyrepresents the growth parameter (H, SD, LAI or DM);xis the AGDD, HTU, PTU or PPTU; a, b, c, and d are the fitted parameters, which have biological significance; and the parameter a has the meaning of the maximum value. Mitscherlich growth equation with dual driving factorsThe Mitscherlich growth equation was proposed by Mitscherlich to describe the responses of plants to environmental factors (Mitscherlich 1919).In agriculture and economics, this equation is called the principle of “law of diminishing returns”.When considering the influence of dual factors, the Mitscherlich growth equation (symmetric equation) is often used (Seymouret al.2019).The Mitscherlich growth equation is expressed as follows (Wareet al.1982; Seymouret al.2019): whereyrepresents the growth parameter (H, SD, LAI or DM);x1is the AGDD;x2is the accumulative actual solar hours (ASS), accumulative photoperiod response (APR) or accumulative maximum possible sunshine hours (ADL); A, B1and B2are the fitted parameters, which have biological significance; and parameter A has the meaning of the maximum value. Modified logistic growth equation with dual driving factorsWith thermal time and photothermal unit as dual driving factors, a novel crop growth model was proposed based on the modified logistic growth equation: whereyrepresents the growth parameter (H, SD, LAI or DM);x1is the AGDD;x2is the accumulative actual solar hours (ASS), accumulative photoperiod response (APR) or accumulative maximum possible sunshine hours (ADL). The experimental data for 2015–2016 were used for model development and the experimental data for 2017–2018 were used for model validation.The accuracy of the models was assessed using seven commonly used statistical indicators (Gueymardet al.2014), i.e., root mean squared error (RMSE) (Zhaoet al.2020), the determination coefficient (R2) (Wuet al.2021), mean absolute bias error (MABE) (Fanet al.2019), normalized root mean square error (NRMSE) (Pullanagariet al.2021), Chi-square goodness of fit test (Chi-square,χ2) (Mishraet al.2015), goodness-of-fitF-test (F-statistics) (Rodrigues and Dufresnes 2017) and 95% uncertainty (U95) (Beharet al.2015).They were calculated as follows: whereYiis the simulated value;yiis the measured value;Yiis the average of the simulated value;yiis the average of the measured value;nis the number of measured values;dfRis the degrees of freedom of the regression sum of squares;dfeis the degrees of freedom of the residual sum of squares;jis the number of statistical indicators,j=1,...,7; and SDV is the standard deviation of the simulated value and the measured value.When the values of RMSE, MABE, NRMSE,χ2and U95are closer to 0, the valueR2is closer to 1 and the value ofF-statistics is greater, then the simulated values are more consistent with the measured values and the accuracy of the model is higher.The above seven statistical indicators have their advantages and disadvantages, so finding the best performance model by comparing various statistical indicators at the same time is difficult.Therefore, a global performance indicator (GPI) was also used to comprehensively evaluate the model performances: whereis the median of thejth indicator of the above seven statistical indicators;Njis the normalized value of the above seven statistical indicators; andαjwas set as –1 forR2andF-statistics, while it was set as 1 for the other indicators.The larger the GPI value, the better the model.The relative growth values (absolute values divided by the corresponding maximum value) were used to remove the influence of dimensions on the overall evaluation.More details about the calculations of GPI can be found in Despotovicet al.(2015). Before model development and validation, we first drew the scatter plot matrix between the growth parameters of summer maize and light-thermal time.Since the sampling intervals between growth parameters were not exactly the same, we did not draw the scatter plot matrix between the growth parameters of summer maize.In the scatter plot matrix, a smooth curve was used to perform grouped multiple fittings and a straight line was set to show the dispersion and symmetry information.Two sets of data points were added to a fitted regression curve and the correlation coefficient was added.Simultaneously, fitted regression curves were drawn and correlation coefficients were added.Box plots with error bars on the diagonal positions and an adaptive kernel density estimation curve were drawn. As shown in Fig.1, the growth of maize was roughly in line with the dynamic changes of an S-shaped growth curve under the various mulching practices.Soil mulching greatly enhanced the growth of maize and followed the order of RPSF>RPBF>SM>NM.H, SD and DM generally followed the S-shaped patterns, which gradually increased and then remained stable.LAI showed a single-peak change with growth and development, first gradually increasing and then gradually decreasing. Fig.1 Dynamic changes in plant height (H), stem diameter (SD), leaf area index (LAI) and dry matter per plant (DM) of maize under various mulching practices during the summer maize growing seasons of 2015–2018.NM, flat cultivation with non-mulching; SM, flat cultivation with straw mulching; RPBF, plastic-covered ridge with bare furrow; RPSF, plastic-covered ridge with straw-covered furrow.The error bars are standard deviations of the measured maize growth parameters (n=3). The maximum values of each growth parameter were different during the different growing seasons due to the influences of meteorological variables, but the overall trend of change was the same.H continuously increased during the vegetative growth period (VE–V17), and stabilized during the reproductive growth period (R1–R6).SD increased rapidly in the early growth stages (V3–V8), reached the maximum at the jointing stage (V8), and decreased slightly after the milk maturity stage (R3) due to plant senescence and reduced stem water.LAI reached the maximum value after the silking stage (R1).DM increased rapidly in the early and middle growth stages (VE–R2), while it slowly increased due to the increase in grain filling and leaf senescence and wilting in the later growth stages (R2–R6). The scatter plot matrix (Appendix B) of maize growth parameters and heat-light units (AGDD, HTU, PTU and PPTU) shows that there was a high correlation between DAS and heat-light units (r≥0.943).There was also a strong correlation between the various growth parameters and between the various heat-light units, indicating that maize growth was closely related to both heat accumulation and solar accumulation.The correlations between H, DM and heat-light units (r=0.875–0.941) were significantly better than those between SD, LAI and light-heat units (r=0.714–0.831).This difference arose because H was roughly unchanged, SD was slightly reduced, LAI was greatly reduced and DM was slightly increased in the late growth stage of summer maize.The growth parameters and light-heat units were consistent with the S-shaped growth curve, but the differences in the growth parameters under various mulching practices were reflected by the maximum values, shapes, inflection points and growth rates of the different S-shaped growth curves.At the same time, the adaptive kernel density estimation curve indicates that the sample distribution did not conform to a normal distribution, which was also related to the growth of maize conforming to an S-shaped growth curve.Among the parameters, H, SD, LAI and PTU had the highest correlations (r=0.941,r=0.831, andr=0.778, respectively) and DM had the highest correlation with AGDD (r=0.831). The maize growth models based on the modified logistic equation with a single driving factor included the modified logistic model-AGDD (MlogAGDD), modified logistic model-HTU (MlogHTU), modified logistic model-PTU (MlogPTU) and modified logistic model-PPTU (MlogPPTU) models, which were driven by AGDD, HTU, PTU and PPTU, respectively.The simulation results of the maize growth models are given in Appendix C (H), Appendix D (SD), Appendix E (LAI) and Appendix F (DM).The maximum values of H, SD, LAI and DM were 225.67 cm, 28.22 mm, 5.80 and 242.64 g on average, respectively.There was little difference in the estimated maximum H under the different mulching practices.However, MlogHTUoverestimated the maximum value of SD, and underestimated the maximum values of LAI and DM.The parameter b was negative in the simulation of H but positive in the simulations of the other three growth parameters.The parameter c was always negative and the parameter d was always positive.Since the values of HTU, PTU and PPTU were within the same order of magnitude, the parameters b and c of the three corresponding models were also within the same order of magnitude.The parameters b and c together determined the growth rates and inflection points of the growth curves. The maize growth models based on the Mitscherlich growth equation and modified logistic equations with dual driving factors included the Mitscherlich Model–AGDD/ASS (MitAGDD–ASS), Mitscherlich Model–AGDD/APR (MitAGDD–APR), Mitscherlich Model–AGDD/ADL (MitAGDD–ADL), modified logistic-AGDD/ASS (MlogAGDD–ASS), modified logistic-AGDD/APR (MlogAGDD–APR) models and modified logistic-AGDD/ASS (MlogAGDD–ADL), which were driven by AGDD combined with APR, ASS or ADL, respectively.The simulation results of these maize growth models are given in Appendix G (H), Appendix H (SD), Appendix I (LAI) and Appendix J (DM).The maximum values of H, SD, LAI and DM simulated by the Mitscherlich growth equations with dual driving factors (MitAGDD–ASS, MitAGDD–APRand MitAGDD–ADL) were 269.27 cm, 23.01 mm, 4.67 and 266.38 g on average, respectively.The Mitscherlich growth equation overestimated the maximum H.The maximum values of H, SD, LAI and DM simulated by the modified logistic growth equations with dual driving factors (MlogAGDD–ASS, MlogAGDD–APRand MlogAGDD–ADL) were 233.23 cm,22.33 mm, 5.10 and 276.10 g, respectively.Since each equation of dual driving factors was a space surface and there were strong linear relationships between AGDD and either APR, ASS or ADL, the space surface was limited to a space curve in the present study. The single factor-driven model that performed the best in the simulations of H, LAI and DM was the MlogPTUModel, while the best performing model in the simulation of SD was the MlogPPTUModel.The dual factor-driven model with the best performance in the simulation of H and LAI was the MlogAGDD–APRModel, while the best performing model in the simulation of SD was the MlogAGDD–ADLModel and the best performing model in the simulation of DM was the MlogAGDD–ASSModel.When PTU ranged from 4 000–12 000°C h (approximately at V5–V14), H entered the rapid growth stage; when PTU ranged from 0–4 000°C h (approximately at V1–V5) or 12 000– 15 000°C h (approximately at V14–R1), H entered the slow growth stage; and when PTU exceeded 15 000°C h (approximately at R1), the growth was almost unchanged (Fig.2).In this study, when AGDD and APR ranged from 300–840°C and 180–540 h, H grew rapidly, after which H entered the slow growth stage until it remained stable. Fig.2 The best results of single factor and dual factor-driven models in simulating plant height of maize under various mulching practices.NM, flat cultivation with non-mulching; SM, flat cultivation with straw mulching; RPBF, plastic-covered ridge with bare furrow; RPSF, plastic-covered ridge with straw-covered furrow.H, plant height; PTU, photothermal units; ADL, accumulative maximum possible sunshine hours; AGDD, accumulative growing degree-days. The data in Fig.3 show that when PPTU ranged from 1 600–5 400°C h, SD entered the rapid growth stage; when PPTU ranged from 0–1 600°C h or 5 400–9 000°C h, SD entered the slow growth stage; when the PPTU ranged from 9 000–11 000°C h, SD was almost unchanged; and when PPTU exceeded 11 000°C h, the plants entered the senescence stage, and SD slightly decreased due to the stem senescence and loss of water.The MlogPPTUModel overestimated SD in the early growth stage.When AGDD and ADL ranged from 180–660°C and 80–260 h, SD entered the rapid growth stage; when AGDD and ADL ranged from 460–1 200°C and 80–200 h, SD was unchanged and it decreased slightly afterwards.In the MlogAGDD–ADLModel, the rapid growth stage of SD was shorter, and it remained stable for a long time. Fig.3 The best results of single factor and dual factor-driven models in simulating stem diameter of maize under various mulching practices.NM, flat cultivation with non-mulching; SM, flat cultivation with straw mulching; RPBF, plastic-covered ridge with bare furrow; RPSF, plastic-covered ridge with straw-covered furrow.SD, stem diameter; PPTU, photoperiod thermal units; ADL, accumulative maximum possible sunshine hours; AGDD, accumulative growing degree-days. The data in Fig.4 show that when PTU ranged from 6 000–11 000°C h, LAI entered the rapid growth stage; when PTU ranged from 0–6 000°C h and 11 000–14 000°C h,LAI was in the slow growth stage; when PTU exceeded 14 000°C h, the plants entered the senescence stage and the LAI was greatly reduced due to leaf senescence and falling.When AGDD and APR ranged from 380–980°C and 280–640 h, LAI was in the rapid growth stage; and when AGDD and ASS ranged from 980–1 100°C and 640–730 h, LAI increased slowly and then began to decrease significantly afterwards. Fig.4 The best results of single factor and dual factor-driven models in simulating leaf area index of maize under various mulching practices.NM, flat cultivation with nonmulching; SM, flat cultivation with straw mulching; RPBF, plastic-covered ridge with bare furrow; RPSF, plastic-covered ridge with straw-covered furrow.LAI, leaf area index; PTU, photothermal units; APR, accumulative photoperiod response; AGDD, accumulative growing degree-days. The graphs in Fig.5 show that when PTU ranged from 10 000–16 000°C h, DM entered a rapid growth stage; when PTU ranged from 0–10 000°C h, DM grew slowly;and when PTU exceeded 16 000°C h, the increasing rate gradually decreased.When AGDD and ASS ranged from 600–1 400°C and 420–880 h, DM was in the rapid growth stage and increased slowly thereafter.The MlogHTUModel seriously underestimated the maximum value of DM. Fig.5 The best results of single factor and dual factor-driven models in simulating stem diameter of maize under various mulching practices.NM, flat cultivation with nonmulching; SM, flat cultivation with straw mulching; RPBF, plastic-covered ridge with bare furrow; RPSF, plastic-covered ridge with straw-covered furrow.DM, dry matter mass per plant; PTU, photothermal units; ASS, accumulative actual solar hours; APR, accumulative photoperiod response; AGDD, accumulative growing degree-days. The simulation results showed that all the mulching practices could increase the growth rate and maximum growth value of maize compared with NM.The performance of growth parameters followed the order of RPSF>RPBF>SM under the different mulching practices.Compared with that under NM, the increases in H were similar under RPBF and SM. The data for the simulated and observed maize growth parameters under each mulching practice were mostly closely distributed around the 1:1 line (Fig.6).However, overestimation in the early growth stage and underestimation in the later growth stage occurred in the models.According to the dimensionless statistical indicators (R2, NRMSE andF-statistic) in Appendices C–J, the accuracy of the four growth parameters followed the order of H>DM>SD>LAI.Each of the ten models involved in this study had their advantages and disadvantages in simulating various growth parameters under the four mulching practices (Fig.7).The simulation accuracy of H followed the order of MlogAGDD–APR>MlogAGDD–ASS> MlogPTU>MlogAGDD>MlogAGDD–ADL>MitAGDD–ADL>MlogPPTU> MitAGDD–APR>MitAGDD–ASS>MlogHTU; and the simulation accuracy of SD was in the order of MlogAGDD–ADL>MlogAGDD–ASS>MlogAGDD–APR>MitAGDD–ADL>MitAGDD–APR>MitAGDD–ASS> MlogPPTU>MlogPTU>MlogAGDD>MlogHTU.The best and worst performing models for simulating LAI were the MlogAGDD–APR(GPI=1.126) and MlogHTU(GPI=–2.826) models, respectively; while the best and worst performing models for simulating DM were the MlogAGDD–ASS(GPI=0.628) and MlogHTU(GPI=–2.451) models, respectively. Fig.6 Scatter plots of simulated and observed plant height (H), dry matter per plant (DM), leaf area index (LAI), and stem diameter (SD) of maize. Fig.7 Radar charts of model ranking in simulating plant height (H), stem diameter (SD), leaf area index (LAI) and dry matter per plant (DM) based on the seven statistical indicators (RMSE, R2, MABE, NRMSE, χ2, F-statistics and U95) and GPI. In the simulation of H, SD, LAI and DM, the dual factordriven models based on the modified logistic growth equation (MlogAGDD–ASS, MlogAGDD–APRand MlogAGDD–ADL) had better simulation performance.In the simulation of H, DM and LAI, the dual factor-driven models based on the Mitscherlich growth equation (MitAGDD–ASS, MitAGDD–APRand MitAGDD–ADL) and MlogHTUperformed worse.Overall, the MlogPTUModel was the best performing model among the four single factor-driven models.In the simulation of SD, the simulation performance of the dual-factor driven models was better than the single factor-driven models. The data in Fig.8 show that in simulating various maize growth parameters, the MlogAGDD–APRModel ranked first overall, and MlogHTUranked last.Other models had varying performances in simulating the different growth parameters, but the overall trend was roughly the same.From the overall results, each of the 10 models could simulate the growth of maize satisfactorily, and the overall rankings of the models were in the order of MlogAGDD–APR>MlogAGDD–ASS>MlogPTU>MlogAGDD–ADL>MlogAGDD>MlogPPTU>MitAGDD–APR>MitAGDD–ASS>MitAGDD–ADL>MlogHTU.Among the single factor-driven models, the accuracy of the MlogHTUModel was the worst.Because SS=0 on rainy and cloudy days, this made HTU=0.However, when the driving factor HTU was 0, the model could not quantify the differences in maize growth under the different plastic mulching practices.The overall accuracy of the MlogPTUModel was the best in simulating H, SD, LAI and DM.Compared with AGDD, PTU was more suitable for the simulation of maize H, LAI and DM. Fig.8 Pie charts of overall model ranking based on the seven statistical indicators (RMSE, R2, MABE, NRMSE, χ2, F-statistics and U95) and a histogram of overall model ranking based on global performance indicator (GPI). Plant height is a key parameter reflecting crop growth and the nitrogen absorption status in the vegetative period (Confalonieriet al.2011; Jianget al.2020; Tolleyet al.2020), and stem diameter is a measure of the lodging resistance of maize stalks (Zhanget al.2018).The leaf is the most responsive organ to temperature and photoperiod (Wanget al.2017; Flynn and Wolkovich 2018).The adverse effects of leaf productivity, assimilation flow and distribution, and changes in sink activities and plant senescence will gradually become superimposed on the changes in DM over time during the grain filling period (Donget al.2021).Soil mulching greatly enhanced the growth of maize and followed the order of RPSF>RPBF>SM>NM in this study, which was generally consistent with the findings of previous studies (Zhenget al.2021a, b).We found that H and DM were highly correlated with heat-light units, which were better than those between SD, LAI and light-heat units.However, Majumderet al.(2016) found that only DM was highly correlated with heat-light units, which could be because their study was only based on one year of experimental data.Among the parameters, H, SD, LAI and PTU had the highest correlations, and DM had the highest correlation with AGDD, which were similar to the findings of Majumderet al.(2016).This study showed that when PTU ranged from 4 000–12 000°C h, H entered the rapid growth stage; when PTU ranged from 0–4 000 or 12 000–15 000°C h, H entered the slow growth stage;when PTU exceeded 15 000°C h, the growth was almost unchanged.These results were similar to the findings of Wardhaniet al.(2014).Wanget al.(2021) found that the growth rates were highest when GDD increased to 530°C, which was similar to the results of this study.The differences occurred because plastic film mulching provided better soil water and temperature conditions than straw mulching, resulting in better maize growth under RPSF and RPBF compared with SM (Zhenget al.2021a).Subrahmaniyanet al.(2018) found that there were differences in the phenological periods of maize under different plastic mulching practices.That’s why the performance of growth parameters followed the order of RPSF>RPBF>SM under different mulching practices in this study. Different thermal time and photothermal units have different simulation effects on the growth of summer maize under various mulching practices.In the simulation of SD and LAI, PPTU was more suitable than AGDD, because the maize still grows on rainy and cloudy days.Compared with the modified logistic growth equation, the Mitscherlich growth model showed inferior performance.This may be due to its structural flaws, which result in poor applicability of the model.Seymouret al.(2019) found that the Mitscherlich growth model was more suitable for describing the effect of increasing fertilization on crop yield.In this study, the Mitscherlich model only performed better in the simulation of SD, which may be related to the accurately estimated maximum value of SD.At the same time, the Mitscherlich Model (MitAGDD–ASS, MitAGDD–APRand MitAGDD–ADL) showed overestimation in the early growth stage and underestimation in the later growth stage of maize.This shift occurred because the modified logistic growth equation with dual driving factors considers the effects of both thermal time and photothermal units, as well as their interactions.The overall performance of the MitAGDD–APRModel was better than the MitAGDD–ASSModel and MitAGDD–ADLModel, while the overall performance of the MlogAGDD–APRModel was better than the MlogAGDD–ASSModel and MlogAGDD–ADLModel, indicating that the combination of AGDD and APR is more suitable for maize growth simulation than the combinations of AGDD and either ASS or ADL.The modified logistic growth equation with dual driving factors performed best, and the simulation performance of the MlogPTUModel was better than the MlogAGDDModel.In general, considering thermal time and photothermal units simultaneously can improve the simulation accuracy of maize growth models. This study simulated H, SD, LAI, and DM of maize under different mulching practices based on thermal time and photothermal units.The three mulching practices significantly increased the growth rates and maximum values of the growth curves compared with the traditional flat cultivation without mulching.All 10 of the models could simulate the growth of maize satisfactorily.Among the four single factor-driven models, the performance of the MlogPTUModel was better than that of the more widely used MlogAGDDModel.The MlogPPTUModel was better than the MlogAGDDModel in the simulation of SD and LAI.Among the ten models, the overall performance of the MlogAGDD–APRModel was the best, followed by the MlogAGDD–ASSModel.The MlogAGDD–APRModel performed the best in the simulation of H and LAI, while the MlogAGDD–ADLModel performed the best in the simulation of SD and the MlogAGDD–ASSModel performed the best in the simulation of DM.Overall, the modified logistic growth equation with AGDD combined with either APR, ASS or ADL as dual driving factors outperformed the commonly used modified logistic growth model with AGDD as a single driving factor in simulating maize growth.This study provides novel driving factors, growth models and ideas for the further establishment of the dynamic growth simulation of maize, which is of great significance for the growth simulation and prediction of maize production under different mulching practices. Acknowledgements This study was funded by the National Natural Science Foundation of China (51879226) and the Chinese Universities Scientific Fund (2452020018). Declaration of competing interest The authors declare that they have no conflict of interest. Appendicesassociated with this paper are available on https://doi.org/10.1016/j.jia.2022.08.0182.4.Modified logistic growth equation with a single driving factor
2.5.Growth equations with dual driving factors
2.6.Model evaluation
2.7.Scatter plot matrix
3.Results
3.1.Dynamic growth of summer maize under various mulching practices
3.2.Relationships between maize growth parameters and heat-light units
3.3.Simulation of maize growth based on heat-light units
4.Discussion
5.Conclusion
杂志排行
Journal of Integrative Agriculture的其它文章
- Review on the fully mulched ridge–furrow system for sustainable maize production on the semi-arid Loess Plateau
- Development and characterization of a novel common wheat–Mexico Rye T1DL·1RS translocation line with stripe rust and powdery mildew resistance
- Revealing the process of storage protein rebalancing in high quality protein maize by proteomic and transcriptomic
- Association mapping of lignin response to Verticillium wilt through an eight-way MAGlC population in Upland cotton
- Dry matter production and panicle characteristics of high yield and good taste indica hybrid rice varieties
- Late sowing enhances lodging resistance of wheat plants by improving the biosynthesis and accumulation of lignin and cellulose
