Association mapping of lignin response to Verticillium wilt through an eight-way MAGlC population in Upland cotton
2023-05-08TlANXiaominHANPengWANGJingSHAOPanxiaANQiushuangNurimanguliAlNlYANGQingyongYOUChunyuanLlNHairongZHULongfuPANZhenyuanNlEXinhui
TlAN Xiao-min, HAN Peng, WANG Jing, SHAO Pan-xia, AN Qiu-shuang, Nurimanguli AlNl, YANG Qing-yong, , YOU Chun-yuan, LlN Hai-rong, ZHU Long-fu, , PAN Zhen-yuan#, NlE Xin-hui#
1 Key Laboratory of Oasis Eco-agricultural, Xinjiang Production and Construction Corps/Agricultural College, Shihezi University, Shihezi 832003, P.R.China
2 College of Informatics, Huazhong Agricultural University, Wuhan 430070, P.R.China
3 Cotton Research Institute, Shihezi Academy of Agricultural Sciences, Shihezi 832011, P.R.China
4 National Key Laboratory of Crop Genetic Improvement/College of Plant Sciences & Technology, Huazhong Agricultural University, Wuhan 430070, P.R.China
Abstract Lignin metabolism plays a pivotal role in plant defense against pathogens and is always positively correlated as a response to pathogen infection.Thus, understanding resistance genes against plant pathogens depends on a genetic analysis of the lignin response.This study used eight Upland cotton lines to construct a multi-parent advanced generation intercross (MAGIC) population (n=280), which exhibited peculiar characteristics from the convergence of various alleles coding for advantageous traits.In order to measure the lignin response to Verticillium wilt (LRVW), the artificial disease nursery (ADN) and rotation nursery (RN) were prepared for MAGIC population planting in four environments.The stem lignin contents were collected, and the LRVW was measured with the lignin value of ADN/RN in each environment, which showed significant variations.We employed 9 323 high-quality single-nucleotide polymorphism (SNP) markers obtained from the Cotton-SNP63K array for genotyping the MAGIC population.The SNPs were distributed through the whole genome with 4.78 SNP/Mb density, ranging from 1.14 (ChrA06) to 10.08 (ChrD08).In addition, a genome-wide association study was performed using a Mixed Linear Model (MLM) for LRVW.Three stable quantitative trait loci (QTLs), qLRVW-A04, qLRVW-A10, and qLRVW-D05, were identified in more than two environments.Two key candidate genes, Ghi_D05G01046 and Ghi_D05G01221, were selected within the QTLs through the combination of variations in the coding sequence, induced expressionpatterns, and function annotations.Both genes presented nonsynonymous mutations in coding regions and were strongly induced by Verticillium dahliae.Ghi_D05G01046 encodes a leucine-rich extensin (LRx) protein involved in Arabidopsis cell wall biosynthesis and organization.Ghi_D05G01221 encodes a transcriptional co-repressor novel interactor of novel interactor of jasmonic acid ZIM-domain (JAZ–NINJA), which functions in the jasmonic acid (JA) signaling pathway.In summary, the study creates valuable genetic resources for breeding and QTL mapping and opens up a new perspective to uncover the genetic basis of VW resistance in Upland cotton.
Keywords: genome-wide association study, lignin response, MAGIC population, Upland cotton, Verticillium wilt
1.lntroduction
Upland cotton (Gossypium hirsutumL.), an important industrial and valuable cash crop,is one of the leading world sources of renewable textile fibers and oilseeds (Zhang Tet al.2015; Fenget al.2022), accounting for 97% of the world cotton production (Zhang Jet al.2015b).Nonetheless, the full potential of this crop is significantly impaired by poor resistance to diseases, especiallyVerticilliumwilt (VW), which is the most devastating and widespread disease of cotton, caused by the opportunistic fungusVerticilliumdahliae(Guoet al.2016; Liet al.2019; Zhanget al.2019a; Tianet al.2021).This fungus naturally exists in soil and can penetrate the cortex and xylem of cotton plants through the roots (Klostermanet al.2009), ultimately taking over the whole plant.The rapid spread of the fungus into the mycelium blocks the plants’ water transportation system, resulting in leaf wilting and yellowing, which can lead to the death of the whole plant (Zhao Pet al.2014).Many attempts have been made to minimize the impacts of VW on cotton production, ranging from chemical precautions (e.g., coating seeds and spraying the soil) (Lopissoet al.2017) to alternating cultivation patterns (Wanget al.2011) and breeding of VW-resistant varieties of Upland cotton (Wildermuth 1971; Zhanget al.2018), the latter is considered the most economical and effective strategy (Crouset al.2006, 2019).Thus, identifying genes associated with VW resistance is key to understanding the physiological interplay between cotton andV.dahliae, facilitating genetic improvement against VW resistance.
Many VW resistance genes/quantitative trait loci (QTLs) have been identified since the recent development of single nucleotide polymorphism (SNP) techniques.About 119 QTLs related to disease incidence (DInc) and disease index (DI) have been identified from the cotton chromosome 25 through the exploration of 196 recombinant inbred line (RIL) populations and CottonSNP70K chip (Palangaet al.2017).Using a panel of 299 accessions and 85 630 SNPs (Liet al.2017), a total of 17 significant SNPs have been mapped.Likewise, five QTLs from 18 significant SNPs were identified by exploring Cotton 63K SNP array and accessions from 120 core elite kinds of cotton (Zhaoet al.2021).Ten QTLs associated with the leaf severity index of the disease phenotype were identified by using 2 084 cotton accessions and 4 730 SNP alleles (Bardaket al.2021).Also, two QTLs for VW resistance in cotton were identified using bulk segregant analysis (BSA).In BSA, the F2segregating population is developed through the hybridization of the resistant cultivar (ZZM2) with a susceptible one (J11) (Cuiet al.2021).A total of 40 QTLs associated with VW DI were identified using 300 chromosome segment substitution lines (CSSLs) constructed from the Upland cotton cultivar ‘CCRI36’ and the Sea island cotton cultivar ‘Hai1’ (Rashidet al.2021).Despite many VW resistance QTLs having been identified using linkage mapping or GWAS, only a few major genes have been cloned and employed in breeding because of the complexity of this desirable trait shaped by a combination of factors, including population structure, phenotypes, genotypes, and environmental conditions (Zhanget al.2014).
Traditionally, VW disease diagnosis has relied on the color of leaves (Zhao Yet al.2014; Martinezet al.2018; Abdelraheemet al.2020; Zhanget al.2021; Zhaoet al.2021) and stems (Donget al.2006) displaying typical phenotype of VW resistance.However, such visual determinations are subjective, resulting in considerable deviation, seriously affecting the accuracy of VW resistance gene mapping.Lignin is an important component of the plant cell wall and a critical physical barrier against pathogen infection (Chezem and Clay 2016; Karasovet al.2017; Xionget al.2021).Any pathogen infection intensifies the accumulation of lignin to help resist tissue invasion and hamper microbial spread (Hückelhoven 2007; Liet al.2019; Huet al.2020).It has been previously observed that lignin deposition plays an important role in cotton resistance againstV.dahliaeleaf blight (Tanget al.2019).Therefore, identifying key genes regulating the metabolic lignin response is significant for studying VW resistance.Many complex populations have been used in mapping analysis to detect more reliable QTLs, such as the multi-parent advanced generation intercross (MAGIC) populations (Cavanaghet al.2008), which are made genetically rich by combining alleles of all parent lines.MAGIC has been widely used in crop QTL mapping, such as with corn (Dell’Acquaet al.2015), rice (Bandilloet al.2013), sorghum (Ongom and Ejeta 2018), kidney bean (Diazet al.2020), barley (Novakaziet al.2020), and wheat (Huanget al.2012; Sannemannet al.2015).
This study explored the potential of a MAGIC population generated from eight Upland cotton lineages through genotyping by a Cotton-SNP63K array.The lignin response toVerticilliumwilt (LRVW) is suggested as a novel phenotypic approach in GWAS identification of key resistance candidate genes.The results provide invaluable resources for lineage breeding and QTL mapping and offer valuable resources to lineage breeding and QTL mapping and unfurl a novel perspective to explore the genetic resources in cotton VW resistance.
2.Materials and methods
2.1.Plant materials
Eight Upland cotton lineages, including Xinluzao 26, Xinluzao 48, Xinluzao 37, Xinluzao 33, and four inbred lineages (Appendix A), were selected as parents to build a MAGIC population.All materials were thankfully provided by the Cotton Research Institute, Shihezi Academy of Agriculture Science, Xinjiang Uygur Autonomous Region, China.
2.2.Upland cotton MAGlC population development
The MAGIC population construction was divided into two main parts: initial converging crossbreeding and subsequent successive selfing (Huanget al.2015).In the first stage, eight parent lineages (G0) were crossed to produce four sets of parental hybrid combinations: A×B (AB), C×D (CD), E×F (EF), and G×H (GH), which was done in Shihezi in the summer of 2008.During the winter of 2008, four F1plants (G1) were crossed in Sanya to obtain four-cross combinations (G2): AB×CD (ABCD) and EF×GH (EFGH).In the summer of 2009, an eightcross combination (G3): ABCD×EFGH (ABCDEFGH) was obtained in Shihezi.In the second stage, the eightcross combination P1P2P3P4P5P6P7P8 was employed in successive selfing.Ultimately, 280 new lineages were established through selfing for about 10 generations from 2009 to 2015 (Fig.1).
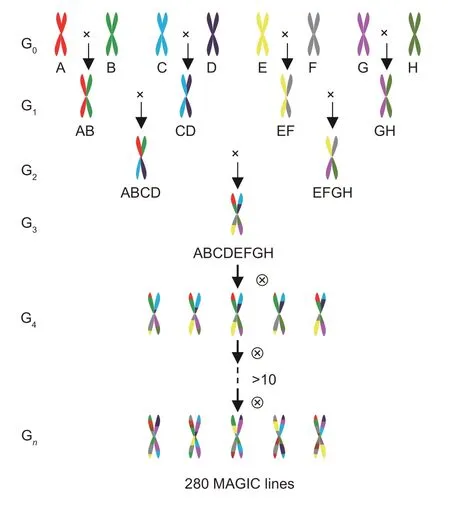
Fig.1 Construction of a MAGIC population from eight parental founders.G0–Gn denotes for generations of crossing and selfing.A–H represents the parental lineages P1–P8.
2.3.Experimental design of field trials and phenotypic data analysis
To assess the LRVW, an artificial disease nursery (ADN) and a rotation nursery (RN) were established for planting MAGIC populations in the towns of Shihezi (44.30°N, 86.03°E) and Manas (44.30°N, 86.22°E) in Xinjiang, during 2019 and 2020.
The ADN was 100 m long and 17.4 m wide.Before sowing, diseased stalk fragments were added to soil spread around the field, then plowed 2–3 times to increase the density of pathogenic bacteria and fungi in the soil of the artificial disease nursery.The RN was a crop field where cotton and wheat cultures were rotated to ensure the soil contained the least possible fragments of diseased stalks.Both nurseries received standard agronomic field management for cotton.Each line was sowed in a plot containing two rows (2-m long with plants interspaced 9.5-cm).A randomized complete block design (RCBD) was applied to the ADN and RN, with two replications (n=2).In order to decrease experimental error, a 10-cm section of the cotton stem was collected from above the cotyledon node.A combination of 10 plants from each row was used to determine the total lignin content at the ripening period.
Total lignin content was determined by the lignin thioglycolic acid (LTGA) reaction as described previously (Bubnaet al.2011; Fuet al.2019; Liet al.2021).A standard curve was built with alkaline lignin (CAS: 8068-05-1, China).The LRVW was calculated based on the ADN/RN ratio for each of the four groups of paired phenotypic data obtained, namely E1-ADN (Shihezi, 2019)/E1-RN (Shihezi, 2019), E2-ADN (Manas, 2019)/E2-RN (Manas, 2019), E3-ADN (Shihezi, 2020)/E3-RN (Shihezi, 2020) and E4-ADN (Manas, 2020)/E4-RN (Manas, 2020).Descriptive statistics were calculated with IBM SPSS (SPSS for Windows, v.21.0, SPSS, Chicago, Illinois, USA), returning range, mean, SD, and CV of the LRVW.Obtained LRVW correlations and their respective distributions were analyzed and plotted with R package ggplot2 (R Studio, Boston, USA).The broadsense heritability (h2) for LRVW was performed using QTL ICiMapping 4.2.
2.4.Genotyping and quality control
The 280 MAGIC lineages were grown in fields for DNA sampling.The young leaf tissue was used to extract genomic DNA.DNA was standardized at 50 ng mL–1for each accession and was processed according to Illumina protocols.The DNA was then hybridized to the CottonSNP63K (Hulse-Kempet al.2015) array, and the Genome Studio v2011.1 (Illumina, USA) was used for quality control and SNP calling.Sequences containing SNPs at a miss ratio <0.1, minor allele frequency (MAF) ≥0.05, and a heterozygous rate <0.5 were reserved (Ball 2013) and mapped to theG.hirsutumgenome (WHU) using BWA Software (Li and Durbin 2010).BAM alignment files were generated with SAMtools v.1.3 (Liet al.2009).
2.5.Population structure and LD analysis
The coverage of each accession against each chromosome of theG.hirsutumgenome and nucleotide diversity was calculated using the Powermarker v.3.25 (Liu and Muse 2005).The structure of the MAGIC population was analyzed by the Admixture Software (Alexanderet al.2009).Principal component analysis (PCA) based on the same SNP set was carried out using the EIGENSOFT Software (Priceet al.2006).The relative kinship matrix of 288 cotton lines was computed using the SPAGeDi Software (Hardy and Vekemans 2002).Genome-wide linkage disequilibrium analyses were conducted among all 280 accessions in the association panel to evaluate the resolution of linkage disequilibrium (LD) by performing pairwise calculations of LD between SNPs usingr2in a sliding window of 50 markers using PopLDdecay (Zhang Cet al.2019).Graphs depicting the decay of LD with the physical distance between SNPs were visualized using ggplot2 in R.
2.6.GWAS in the MAGlC population
Firstly, Q-Q (quantile-quantile)-plot comparisons were used to identify the most reasonable model from Mixed Linear Model (MLM), Efficient Mixed-Model Association (EMMA), General Linear Model (GLM), and Multiple Loci Mixed Linear Model (MLMM) with the R package GAPIT (Lipkaet al.2012).Phenotypic data for Q-Qplot comparisons and GWAS analysis included average LRVW values of two replicates and BLUP (Best Linear Unbiased Prediction) of the data from four environments (E1–E4) (Piepho 1994).The Manhattan map (Manhattan plot) was produced using the R package ggplot2.We used a genome-wide significance threshold of 1/n(n= 9 323) for each GWAS to screen any significant SNPs.Then, we employed the snpEff Software to annotate and predict the effects of variants on genes (Cingolaniet al.2012).
2.7.ldentification of candidate genes
The study first identified the regions located within 500 kb upstream and 500 kb downstream of the snps with the lowestP-value as candidate QTL regions based on the reference genome of the Upland cotton (G.hirsutum(AD1) ‘TM-1’ genome WHU_updated v1) (https://www.cottongen.org/find/genes) (Liet al.2017; Zhenget al.2017; Suet al.2020).Then, the regions were used for candidate gene identification according to their intragenic SNP variation and annotated with theArabidopsisthalianadatabase (https://www.arabidopsis.org/).
2.8.Expression analysis of candidate genes
Expression patterns for the candidate genes in TM-1 under each experimental treatment were determined by quantitative RT-PCR (qRT-PCR).RegardingV.dahliaedisease assays, TM-1 seedlings were grown in Hoagland medium for up to 2 wk and then infected by dipping their roots into aV.dahliae991 spore suspension (1×10⁵spores mL–1) for 2 min after wounding the root upon full expansion of the second leaf.Control seedlings were likewise treated and dipped in sterile water.Samples from the stems of treated and control groups were collected after 0, 6, 12, 24, and 48 h post-inoculation.A minimum of three plants were collected per sample of each time point, towards a total of three biological replicates.All samples were immediately frozen in liquid nitrogen and kept at –80°C for subsequent procedures.
Total RNA was extracted from the seedling stems using the Plant RNA Purification Kit (TranGen Biotech, Beijing, China).Obtained RNA was reverse-transcribed with a Prime-Script RT Reagent Kit with gDNA Eraser (TaKaRa, China) according to the manufacturer’s protocol.The qRT-PCR was performed using the SYBR qRT-PCR kit on a BIO-RAD C1000 Touch Thermal Cycler CFX96 Real-Time System.For quantification, a 20-μL reaction mixture containing diluted cDNA and Green Super-mix was used, from which transcript abundance was determined according to the manufacturer’s protocol.The PCR settings were: preincubation at 94°C for 30 s; denaturation at 94°C for 5 s with 45 cycles, annealing at 60°C for 15 s; extension at 72°C for 10 s.The cotton geneUBQ7(Ghi_A11G05811) was used as an internal control.The relative expression of target genes was determined in triplicates for each time point using the 2–∆∆CTmethod (Livak and Schmittgen 2001; Luoet al.2018; Wanget al.2020).Primers for qRT-PCR were designed using NCBI (https://www.ncbi.nlm.nih.gov/tools/primer-blast/) (Appendix B).
The tissue expression levels of the candidate genes were obtained from Publicly available RNA-seq data of cotton downloaded from the NCBI-SRA database (https://www.ncbi.nlm.nih.gov/; SRA Study ID: SRX202873) (Zhang Tet al.2015).
3.Results
3.1.The abundant phenotypic variation of the MAGlC population based on the LRVW
Eight Upland cotton accessions presenting different responses to VW resistance, pronounced adaptability, high yield, and fiber quality were chosen as parents’ lineages (PM) to generate a MAGIC population (Appendices A and C).An eight-way inter-cross strategy was adopted to favor the accumulation of favorable alleles from the eight PMs.As a result, a set of 280 stable inbred MAGIC lineages (MLs) was developed from selfing for up to 10 generations (Fig.1).These eight PMs and 280 MLs were explored for association analysis.
The lignin content of cotton stems sampled from the four experimental settings in the ADN or the RN revealed a significant positive response from RN to ADN for most population lines (Fig.2).The LRVW was calculated based on the ADN/RN for paired treatments E1 (E1-ADN/E1-RN), E2 (E2-ADN/E2-RN), E3 (E3-ADN/E3-RN), and E4 (E4-ADN/E4-RN).The average LRVW values of the PMs in the four environments ranged from 0.99 to 1.47, with the highest in P6 and the lowest in P2 (Appendix C), which were negatively correlated with DI (Appendix C).Phenotypic statistical analysis of the MAGIC population reveals complex variations among the treatments (Appendix D).Coefficients of variation (CV) for LRVW ranged from 12.61 to 18.20% in PMs and from 15.00 to 19.00% in MLs (Appendix D).Theh2of LRVW was estimated at 70.36%.Phenotype trends of LRVW remained relatively stable in the four environments.Comparing LRVW between different years revealed a high correlation of LRVW within the same year, e.g., E1–E2 (89%) and E3–E4 (91%) (Fig.3).
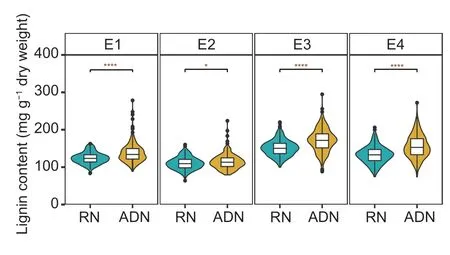
Fig.2 Lignin contents of 288 obtained accessions under rotation nursery (RN) and artificial disease nursery (ADN).The significance analysis was determined by t-test.* and **** indicate significances at P<0.05 and P<0.0001, respectively.
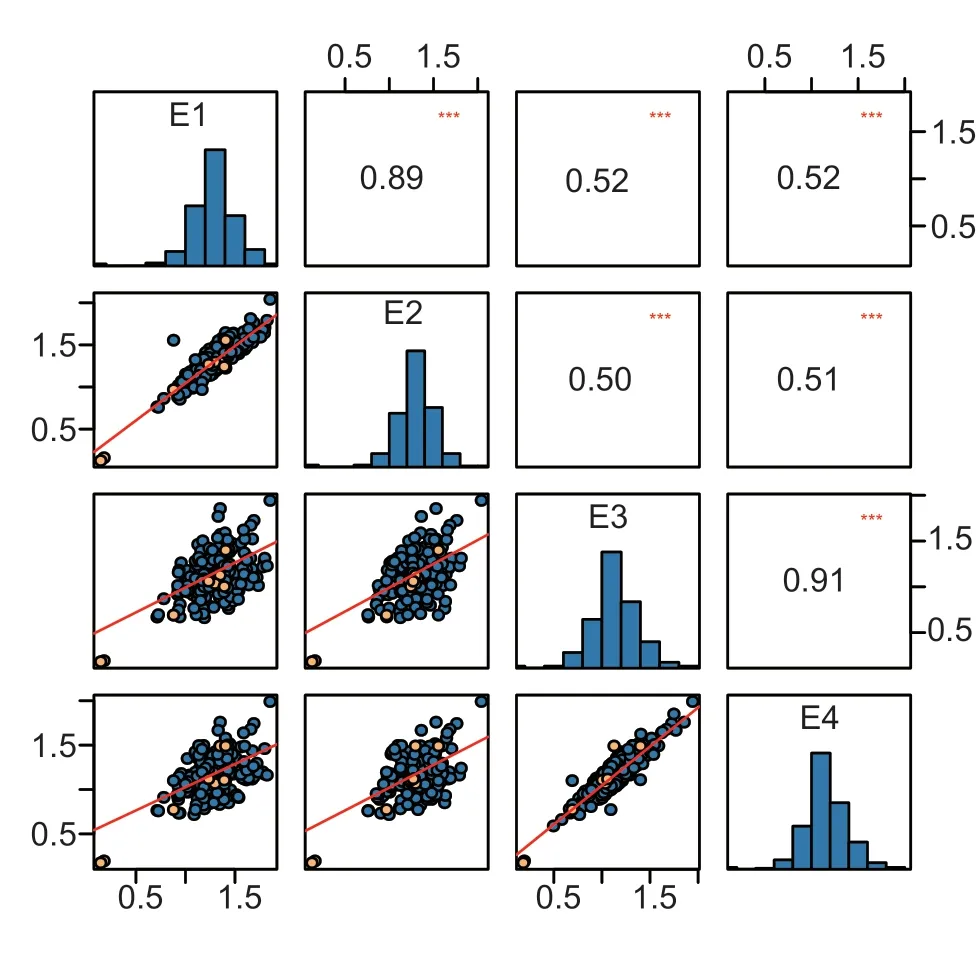
Fig.3 Distributions and correlations of lignin response to Verticillium wilt (LRVW) across four experimental crop treatments.The frequency distributions of LRVW are shown on the central diagonal in the form of a blue histogram; scatter plots of every environment are shown in the areas below the diagonal; the blue dots are the MAGIC lineages, and the yellow dots are the PMs; numerical correlation coefficients among the environments are shown in the areas above in the diagonal.*** indicates significance at P<0.001.
3.2.The abundant genetic variation of the MAGlC population based on the Cotton-SNP63K array
These totaled 9 323 high-quality SNPs (Fig.4; Appendix E), which proved unevenly distributed across theG.hirsutumgenome, where 4 269 mapped to the A subgenome and 5 054 to the D sub-genome.Furthermore, the density of SNPs varied across the 26 genome chromosomes, ranging in density from 140 SNPs on ChrA06 to 643 snps in ChrD08; the whole-genome average density of SNP markers was approximately 4.78 SNP Mb–1, respectively, ranging from 1.14 SNP Mb–1in ChrA06 to 10.08 SNP Mb–1in ChrD08.The average genetic diversity was 0.338, and the average value of polymorphism information content (PIC) was 0.285, ranging from 0.23 to 0.34 across chromosomes (Appendix E).The population structure collaboratively indicated that a significant population stratification existed in the 280 Upland cotton accessions (K=3) (Appendix F).Principal component analysis showed that the MAGIC population could be split into three groups, which were used for the MAGIC population structure controlling when doing GWAS (Appendix F).
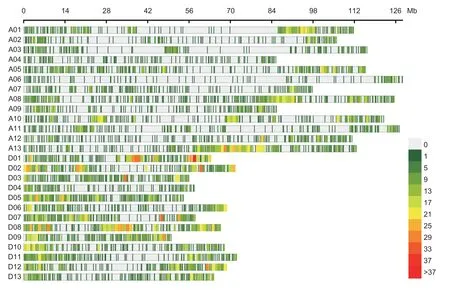
Fig.4 Observed single-nucleotide polymorphism (SNP) distribution across the 26 chromosomes (A01–D13) of the Upland cotton genome.
The decay distances of the LD between 9 343 SNP markers were calculated using PopLDdecay and R software.A total of 41 550 665 possible pairwise combinations were obtained and used for statistical analysis (Fig.5-A).As a result, 78.16% of the SNPs had significant LD (P<0.01), and all chromosomes showed LD decay (Fig.5-B).The LD decay in the population was very slow, dropping to 0.2 at around ~1 700 kb.Another obvious inflection point was observed in the LD variation curve whenr2=~0.24 (Fig.5-C), and the LD decay distance is ~500 kb.According to the results, a middle value of 1 000 Kb was set for LD attenuation distance to identify the candidate regions of the QTLs.
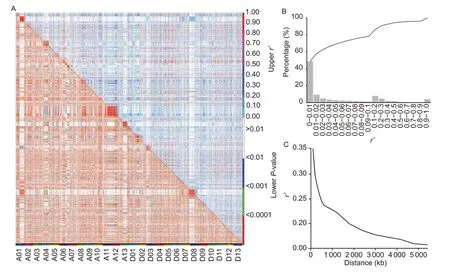
Fig.5 Summary of linkage disequilibrium (LD) in the generated multi-parent advanced generation intercross (MAGIC) population.A, the distribution of r2 and P-value for 9 323 SNPs across 26 chromosomes.B, the histograph of r2.C, Linkage disequilibrium decay curve was determined according to r2.
3.3.Three stable QTLs associated with LRVW detected by GWAS
In order to evaluate the models, this study compared the Q-Q plots for the LRVW and BLUP values generated by four models (MLM, EMMA, GLM, and MLMM) (Appendix G), which indicated that the false positives were the best controlled in the MLM.Then, the MLM was selected for performing GWAS on LRVW.The SNPs with −log10Pvalues above 3 (1/9 323) were selected as significant trait-associated SNPs.Finally, a total of eight SNPs significantly associated with LRVW were identified from the four experimental treatments and BLUP (Fig.6; Appendix H) atP<0.001 (P=1/9 323, −log10P=3).Among these eight SNPs, three were detected in two or three treatments, namely i65694Gm (in E1, E2, and BLUP), i21091Gh (in E1 and E2), and i64761Gm (in E1 and BLUP).These SNPs are respectively located in chromosomes A04, A10, and D05, thus representing three QTLs, namelyqLRVW-A04,qLRVW-A10, andqLRVW-D05(Appendix H).
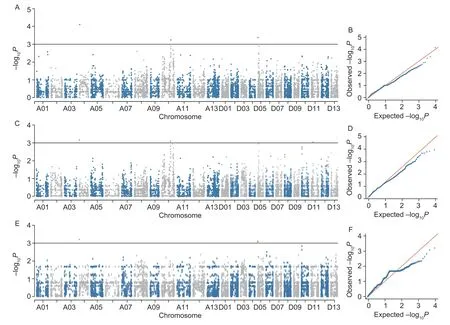
Fig.6 Overview of significant Manhattan and quantile-quantile (Q-Q) plots of GWAS results in triplicates.A and B, Manhattan and Q-Q plots in E1.C and D, Manhattan and Q-Q plots in E2.E and F, Manhattan and Q-Q plots in BLUP data.
3.4.Two key candidate genes selected according to gene sequence variations, expression patterns, and function annotations
Candidate regions were restricted around LD decay distances of 500 kb within the three obtained QTLs.Such three candidate regions spanned 179 genes (Appendix I) and 35 SNPs (Appendix J), among which 13 genes had 14 SNP intragenic variants, while five genes presented missense translation mutations, i.e., likely affecting protein function (Appendix K).These five candidate genes were located onqLRVW-D05, and their functions were annotated with theArabidopsisthalianadatabase (https://www.arabidopsis.org/).Ghi_D05G01046encodes a leucine-rich extensin (LRx) involved in cell wall biosynthesis and organization (Draegeret al.2015).A mutation from A to C resulted in the 314th amino acid changing from glutamic acid to aspartic acid.Ghi_D05G01131encodes a tetratrico peptide repeat (TPR)-like superfamily protein, and a mutation from A to G resulted in the second amino acid changing from threonine to alanine.Ghi_D05G01221encodes a transcriptional co-repressor novel interactor of JAZ–NINJA, which participates in the jasmonic acid (JA) signaling pathway, root development, and leaf development.A conserved TPL-binding domain contained the associated nonsynonymous SNP where an A to G mutation resulted in the 73rd amino acid changing from glutamine to arginine.Ghi_D05G01476encodes a CCCH-type zinc finger family protein, and a mutation from A to G resulted in the 831st amino acid changing from lysine to arginine.Ghi_D05G01511encodes a secreted transmembrane peptide (STMPs), and a mutation from A to G resulted in the 49th amino acid changing from asparagine to serine (Appendix K).
In order to clarify the spatio-temporal expression patterns of candidate genes, the tissue expression levels of the candidate genes were obtained from publicly available RNA-seq data of cotton (Zhang Tet al.2015), which showed thatGhi_D05G01221andGhi_D05G01046were highly expressed in most tissues, especially in root and stem.In contrast, the expression level of others was low in most tissues (Appendix L), especiallyGhi_D05G01511, which showed almost no expression in the stems.Additionally, expression profiles of the five candidate genes under the experimental treatments were determined by qRT-PCR, where resistance against VW was grouped as either ‘V.dahliae991’ or ‘Mock’.At the cotton stem, expression levels ofGhi_D05G01221andGhi_D05G01046increased significantly after 12 h of infection, suggesting these two genes were strongly influenced byV.dahliae991, especiallyGhi_D05G01046, whose expression had increased by about 13 times above the Mock after 48 h of infection.On the other hand, the expression ofGhi_D05G01131,Ghi_D05G01476, andGhi_D05G01511did not change regularly after infection (Fig.7).Thus, among the five candidate genes,Ghi_D05G01221andGhi_D05G01046were finally selected as key candidate genes.
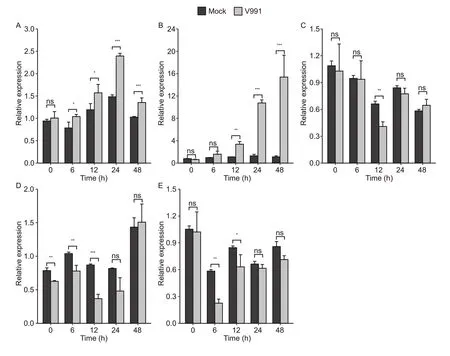
Fig.7 qRT-PCR analysis of the selected candidate genes responding to cotton infection by Verticillium dahliae 991 (V991).A–E, the induced expression patterns of candidate genes Ghi_D05G01221, Ghi_D05G01046, Ghi_D05G01131, Ghi_D05G01476,andGhi_D05G01511 under V991 or Mock (in stems).Statistical significance was determined by t-test (ns, P>0.05; *, P≤0.05; **, P≤0.01; ***, P≤0.001).
Additionally, a significant difference in LRVW was found between the genotypes of ‘AA’ and ‘GG’ alleles ofGhi_D05G01221, and those who had the ‘GG’ allele showed a higher LRVW value than the ‘AA’ variant (Appendix M).A similar phenomenon was also found for the ‘AA’, ‘AC’, and ‘CC’ alleles genotypes ofGhi_D05G01046; those with the ‘AA’ and ‘AC’ alleles showed a higher LRVW value than the ‘CC’ variant (Appendix M).
4.Discussion
4.1.The advantage of MAGlC populations and their application in gene mapping
MAGIC populations have been widely employed in crop breeding and QTL mapping because of their robustness, efficiency, and low false-positive rate (Cavanaghet al.2008; Huanget al.2018).For breeding, a MAGIC population is generated from multiple parents presentingdesirable characteristics in numerous traits, enhancing the chance that polymerization of favorable alleles will result in efficient breeding (Cavanaghet al.2008).For QTL mapping, a MAGIC population has more diverse genetic variation and recombination rates than a bi-population and a simpler structure than natural populations, which is advantageous for the genetic analysis of complex traits (Cavanaghet al.2008; Huanget al.2015).In this study, the eight parents derived from varieties and strains displayed differentiated fiber yield, fiber quality, environmental adaptability, and resistance to VW.Therefore, the MAGIC population constructed in this study helps investigate the genetic basis of VW resistance, cotton breeding, and genetic analysis of other traits.
4.2.LRVW phenotype uncovering a new perspective on the genetic basis of VW resistance in cotton
Cotton VW is the deadliest crop disease affecting cotton production yield and quality (Xuet al.2011).In the search for alternative solutions to the problem, extensive research has been done with mapping VW resistance genes/QTLs (Zhang Jet al.2015b; Abdelraheemet al.2017).However, few key genes have been identified and cloned due to numerous drawbacks regarding populations, phenotype identification, and environment (Zhang Jet al.2019).For instance, identifying VW resistance phenotype in any plant is unreliable because early segregating populations (such as F2, BC1, and F2:3) are empirically irreproducible (Zhang Jet al.2015a).To overcome this shortcoming, early segregating populations can be replaced by permanent populations, such as recombinant or backcross inbred lines or MAGIC populations (Jianget al.2009; Fanget al.2013, 2014).Furthermore, as VW resistance is a complex mosaic phenotype, it can be hard to identify.An artificial grading scale is a usual method to identify VW resistance (Jianget al.2009; Fanget al.2013, 2014; Zhanget al.2021), which is an inherently imprecise approach (Zhang Jet al.2015b).In addition, a cotton field is a complex environment easily influenced by many factors.Thus, any genes proposed from studies with artificial inoculations may not behave exactly as expected in the field (Zhanget al.2014).These are mere examples of the many obstacles to cloning key VW resistance genes, which call for novel approaches to overcome.
During plant infection, the VW pathogen must initially invade the cortical cells and later enter the vascular bundle cells; in either case, it must cross cell walls laterally.Studies have shown that cotton varieties with higher lignin content in the cell wall are more infectionresistant (Liet al.2019).Moreover, higher lignin concentrations in infected cells will inhibit toxins and enzymes produced by the pathogen in the stem vascular tissues (Hückelhoven 2007; Xuet al.2011; Liet al.2019).Still, the regulation mechanisms of the defensive lignin response to VW have remained unclear.To investigate the genetic basis of lignin response to VW, we used a MAGIC population for GWAS based on the phenotype of LRVW.As a result, three stable QTLs related to LRVW were identified.Among which,qLRVW-A04overlapped withqVWR-08-c4-1as revealed by exploring a backcrossinbred line population with VW resistance (Zhang Jet al.2015b);qLRVW-A10andqLRVW-D05are novel QTLs.In addition, the lignin contents of ADN were significantly higher than those of RN across all four experimental treatments, confirming that lignin production is a typical response to VW infection.According to our results, LRVW is related to VW resistance and could be a reliable phenotype to identify QTLs related to VW resistance, thus establishing a novel tool to uncover the genetic basis of VW resistance in Upland cotton.
4.3.Key candidate genes linked to VW resistance
This study selected five candidate genes from a pool of 179 genes located within candidate genomic regions of the three QTLs according to intragenic missense mutations.Two key candidate genes,Ghi_D05G01046andGhi_D05G01221, were further selected according to their predicted function and observed expression patterns.Ghi_D05G01046encodes an extracellular protein (LRX) comprising an N-terminal leucine-rich repeat (LRR) domain and a C-terminal extension domain.InArabidopsis,LRX1andLRX2are mainly expressed in root hairs and involved in cell wall development (Baumbergeret al.2001).LRX3,LRX4, andLRX5are also involved in cell wall development, and mutants oflrxsreportedly resulted in changes in the lignocellulosic fraction, pectin, and xylan (Draegeret al.2015).The expression ofGhi_D05G01046increased by about 13 times above the Mock after 48 h of infection, showing a pronounced response to VW infection.This could be related to pathogen invasion, where more lignin would effectively develop a denser cell wall to resist pathogen invasion (Hückelhoven 2007).Therefore, it seems likely thatGhi_D05G01046is involved in VW resistance in regulating cell wall development and lignin synthesis in cotton plants.
Regarding the other candidate gene,Ghi_D05G01221encodes a transcriptional co-repressor JAZ–NINJA.In plants, JAZ–NINJAs are negative regulators of jasmonate responses.It is established that JA is involved in multiple biological and abiotic stress responses by promoting the accumulation of resistance-related secondary metabolites (Barahet al.2013; Shitanet al.2013).In fact, JA can be triggered by pathogen infection to mediate cell wall lignin deposition (Dennesset al.2011).The expression ofGhi_D05G01221gradually increased over the course of 12 h followingV.dahliae991 treatment.Thus, the results indicate thatGhi_D05G01221may be related to LRVW through the JA pathway.In short, the two candidate genes identified in this study are highly likely to be involved in VW resistance by mediating lignin synthesis.
4.4.The candidate genes showed similar induced patterns in both roots and stems of seedlings
The deposition of lignin in cotton stem runs through the whole development process, which is regulated by many factors, such as biological and abiotic factors (Sobczaket al.2010; Zhu 2016).This study collected the lignin contents from cotton stems during the ripening period to obtain greater differences in lignin content between AND and RN.However, the induced expression of candidate genes could be performed at any stage, especially the seedling stage, which was widely used for simple operation, short cycle, easy RNA extraction, and other advantages (Wuet al.2021).Therefore, the induced expression patterns of the candidate genes were performed by using the cotton stems at the seedling stage.
Although the pathogen infection occurs in the root of the plant, its signal can also be quickly transmitted to other tissues and cause the response of other organs, which is usually transmitted by hormonal signals or other signal pathways (Okamotoet al.2016; Nishida and Suzaki 2018; Ohet al.2018; Toyotaet al.2018; Takahashi and Shinozaki 2019).In our results, the expression of the two key candidate genes (Ghi_D05G01046andGhi_D05G01221) were up-regulated in both stems and roots afterV.dahliaeinduction, while the response of candidate genes in stems was slightly later than that in roots (Appendix N), which may be caused by the time lag in signal transmission (Yanget al.2018).
5.Conclusion
This study generated a MAGIC population from eight parent lineages with desirable characteristics in different traits and genotyped using the Cotton-SNP63K array.The novel phenotype-generated LRVW was used for GWAS.As a result, three stable QTLs, namelyqLRVW-A04,qLRVW-A10, andqLRVW-D05, were identified from more than two experiments.Analysis of gene sequences, expression, and annotation of the QTLs culminated in selecting two key candidate genes,Ghi_D05G01046andGhi_D05G01221, containing nonsynonymous mutations within their coding regions.The two selected key genes are strongly induced byVerticilliumdahliaeand are predicted to function in cell wall biosynthesis.The study provided valuable genetic resources for resistant plant breeding and QTL mapping and a new perspective to understand the genetic basis of VW resistance in cotton.
Acknowledgements
This work was financed by the National Natural Science Foundation of China (31760402 and 31771844) and the Innovation Leadership Program in Sciences and Technologies for Young and Middle-aged Scientists of Xinjiang Production and Construction Corps, China (2019CB027).
Declaration of competing interest
The authors declare that they have no conflict of interest.
Appendicesassociated with this paper are available on https://doi.org/10.1016/j.jia.2022.08.034
杂志排行
Journal of Integrative Agriculture的其它文章
- Review on the fully mulched ridge–furrow system for sustainable maize production on the semi-arid Loess Plateau
- Development and characterization of a novel common wheat–Mexico Rye T1DL·1RS translocation line with stripe rust and powdery mildew resistance
- Revealing the process of storage protein rebalancing in high quality protein maize by proteomic and transcriptomic
- Dry matter production and panicle characteristics of high yield and good taste indica hybrid rice varieties
- Late sowing enhances lodging resistance of wheat plants by improving the biosynthesis and accumulation of lignin and cellulose
- Effects of sowing date and ecological points on yield and the temperature and radiation resources of semi-winter wheat
