Evolution of edge turbulent transport induced by L-mode detachment in the HL-2A tokamak
2023-03-09TingWU吴婷LinNIE聂林YiYU余羿JinmingGAO高金明JunyanLI李俊颜HuicongMA马会聪JieWEN闻杰RuiKE柯锐NaWU吴娜ZhihuiHUANG黄治辉LiangLIU刘亮DianlinZHENG郑典麟KaiyangYI弋开阳XiaoyanGAO高霄雁WeiceWANG王威策JunCHENG程钧LongwenYAN严龙文LaizhongCAI才来中ZhanhuiW
Ting WU(吴婷),Lin NIE(聂林),Yi YU(余羿),,∗,Jinming GAO(高金明),Junyan LI(李俊颜),Huicong MA(马会聪),Jie WEN(闻杰),Rui KE(柯锐),Na WU(吴娜),Zhihui HUANG(黄治辉),Liang LIU(刘亮),Dianlin ZHENG(郑典麟),Kaiyang YI(弋开阳),Xiaoyan GAO(高霄雁),Weice WANG(王威策),Jun CHENG(程钧),Longwen YAN(严龙文),Laizhong CAI(才来中),Zhanhui WANG(王占辉) and Min XU(许敏),∗
1 Southwestern Institute of Physics,Chengdu 610041,People’s Republic of China
2 Sino-French Institute of Nuclear Engineering and Technology,Sun Yat-Sen University,Zhuhai 519082,People’s Republic of China
3 Institute of Fusion Science,School of Physical Science and Technology,Southwest Jiaotong University,Chengdu 610031,People’s Republic of China
Abstract This paper presents the characteristics of L-mode detachment,together with the behavior of edge turbulent transport and plasma confinement on the HL-2A tokamak.Partially detached and pronounced detached states have been achieved in L-mode plasma.Stored energy was maintained before and after detachment.Edge turbulence and its transport have increased obviously in the partially detached state.In the pronounced detached state,redistribution of the density and temperature profiles due to detachment leads to low amplitude of electron temperature and pressure,as well as very weak edge turbulence and transport.Despite strong plasma radiation in the pronounced detached state,reduced edge turbulent transport contributes to maintaining stored energy in detached L-mode plasma in HL-2A.Different detachment states play an important role in the redistribution of density and temperature profiles,which requires further study.
Keywords:L-mode detachment,turbulent transport,confinement,HL-2A tokamak
1.Introduction
Power heat load on the divertor target is one of the most urgent issues for future fusion devices.The detachment scenario is believed to be a way to achieve stable H-mode operation[1,2].The physics of detachment is very complex.Plasma confinement varies with different gas species,materials of the first wall and divertor configurations in detached H-mode plasma[3–8].Experimental results show that after detachment,plasma performance with relatively closed divertor configurations is better than that with relatively open divertor configurations in DIII-D[8,9].This means that exploring closed divertor physics is of great significance.The HL-2A tokamak has a very closed divertor configuration[10],which has advantages for the study of detachment physics.
Recently,it has been reported that L-mode plasma with high power shows good confinement properties and no ELM activities via Ar seeding in ASDEX-Upgrade experiments[11],indicating the importance of L-mode detachment.It was proposed that the study of edge turbulence becomes important due to its effects of confinement degradation.In addition,the plasma profiles(such as radial profiles of electron density and temperature)redistribute after detachment[3–8],which has strong effects on the evolution of plasma confinement and edge turbulence.In turn,edge turbulence affected by detachment plays a role in the redistribution of plasma profiles.Hence,the study of edge turbulent transport evolution in the process of detachment is crucial.The radial profiles of relative density fluctuation at the plasma boundary are measured using reflectometry in different states of L-mode detachment in ASDEX-Upgrade[12],which shows an increasing tendency to change from the attached to the pronounced detached state,but turbulent transport is not reported.More studies of the evolution of edge turbulence and its induced transport under detachment are required,especially in plasma with a closed divertor.
In this work,edge turbulent transport in L-mode plasma during the process of detachment is investigated in detail in the HL-2A tokamak.Based on the characteristics of detachment and edge turbulence evolution,the process of attachment to detachment is divided into five stages:the attached state,the pre-partially detached state,the partially detached state,the pre-pronounced detached state and the pronounced detached state.Plasma confinement barely varies in this process.The rest of this paper is as follows.In section 2,the experimental setup is described in detail.The experimental investigation of compatibility of confinement with detachment in L-mode plasma is presented in section 3,which includes observation of L-mode detachment,variation of plasma confinement and evolution of edge turbulent transport.The last two sections provide discussion and conclusions.
2.Experimental setup
Experiments were conducted in L-mode deuterium plasmas on the HL-2A tokamak,which has a major radius ofR=1.65 m,minor radius ofa≈0.4 mand toroidal magnetic field ofBt≈1.3 −2.7T.Typical discharge parameters of the HL-2A tokamak can be found in[13].Various diagnostics are employed in the experiments to investigate the process from attachment to detachment,part of which is shown in figure 1(a).Plasma radiation is estimated by two 16-channel arrays of absolute extreme ultraviolet(AXUV)detectors in the main chamber and the divertor regions with a sampling rate of 20 kHz.Passive visible spectroscopy can measure the line emission from impurity,covering almost the whole cross-section with a spatial resolution of 2.7 cm and a temporal resolution of 10 ms[14].Meanwhile,high-speed vacuum ultraviolet(VUV)spectroscopy can measure the impurity line emission in the mid-plane with a time resolution of about 17μs[15].TheDαdetector in the divertor has a time resolution of 1μs.Two infrared(IR)cameras are installed at different toroidal positions to measure the heat flux onto the outer target.The target probe arrays consisting of 274 tips in total,are installed on both the inner and outer target plates[16],which have a spatial resolution of 1.2 cm and a temporal resolution of 1μs.
A fast reciprocating Langmuir probe array[17]is developed as the main tool to characterize the edge turbulence,which will be carefully discussed in this paper.It is located at the outer mid-plane at the low-field side,as shown in figure 1(a)and zoomed-in figure 1(b).It can move from the far SOL region to the edge region with a speed of about 1 m s−1,covering a radial distance of 8 cm.Radial profiles of plasma parameters can be obtained during discharge with a sampling rate of 1 MHz.The probe arrays consist of three probe heads,marked as Probes A,B and C in figure 1(b).Probe B is located at the mid-plane and the other two are separated poloidally with a central distance of 5 cm between the nearby probe heads.These three probe heads are also radially separated with a 0.5 cm distance between Probes B and C,and a 1 cm distance between B and A.Seven probe tips can be installed on each probe head,which are listed on the three radial steps with a step distance of 3 mm.Two of the seven tips on Probe C are left open in the experiments presented in this paper due to the limitation of the 19-tip vacuum socket.The height and diameter of each tip are 2.5 and 2 mm respectively.The poloidal separation of the adjacent tips is 5 mm.The two tips highlighted in green are to measureV−andV,+and the others are all designed to diagnose floating potentialVf.The fluctuation of poloidal electric fieldis derived from the poloidal floating potential difference neglecting electron temperature fluctuation,where symbol∼denotes the fluctuation of parameters.The fluctuated radial velocity,turbulent particle flux and radial electric field are calculated asrespectively,where〈…〉denotes a time ensemble average.In addition,the diagnostic system of Doppler backward scattering(DBS)is utilized to measure the relative density fluctuation as well as the poloidal velocity with a sampling rate of 1.25 MHz[18].The 14-channel DBS measures plasma parameters in the plane that locates 13 cm lower than the midplane.The measured poloidal wave numberkθis in a range of 4–22 cm−,1 which differs from the reciprocating probe arrays(kθ<3cm−1).
In addition,gas is injected into the divertor chamber and the gas puffing signal denotes the voltage applied to solenoid valves on the pipes.The gas injection can be either continuous or in pulses,determined by the voltage applied to the valve.In the case of pulse injection,the duty cycle and the amplitude of the voltage applied to the valve control the amount of injected gas.In the case of continuous injection(which lasts for about 100–400 ms),the voltage is usually small to avoid too much gas puffing.The gas puffing in the inner and outer target can be set differently.It usually takes about 50–150 ms for the injected gas to move through the pipes into the divertor and the main chambers.
3.Experimental results
3.1.Confirmation of L-mode detachment
In HL-2A L-mode plasma,detachment has been achieved in various ways,such as different impurity gases,toroidal injection locations and duration of pulses.In this paper,shot#38008 is selected as a typical shot of L-mode detachment.The main parameters of this shot are plasma currentIp≈165 kA,toroidal magnetic fieldBt≈1.3T,NBI powerPNBI≈300 kW,Ohmic heating voltageVL≈1.8 V,lineaveraged densitywith its ratio to Greenwald density limitedge safety factorqa≈3.1,and the stored energyWe≈12 −18 kWfor the duration of NBI heating.
In this shot,mixed gas of N2(60%in volumn)+D2(40%)is injected into the divertor chamber in pulses.The pulse sequence starts at 1010 ms with different time intervals,and the injection location varies in the inner and outer divertor target,as shown in figure 2(b).The method of injection is designed to achieve different states of detachment and avoid excessive gas injection,which can lead to disruption.In the outer divertor,the duration of the four pulses is 20,20,15 and 15 ms,respectively,with an interval of 50 ms.In the inner divertor,the duration of the four pulses is 7,7,5 and 5 ms,respectively,with an interval of 50 ms.In figure 2,two detaching processes due to the first two gas pulses,highlighted in magenta,correspond to the time period of 1080–1135 and 1150–1270 ms.The two processes present similar performances and the second one is described in detail.With the increase in line-average density and radiation measured by VUV and AXUV in the main chamber,the radiation measured by AXUV andDαin the divertor chamber decreases.The ion saturation current density measured by target probe arrays and the heat flux measured by the IR camera in the outer target show a dramatic reduction.In addition,the CCD camera pictures confirm stronger radiation close to the X-point after detachment in figure 3.In addition to the X-point,figure 3 shows that the visible radiation at the plasma boundary becomes stronger in the detached state than that in the attached state.These are all typical characteristics of detachment[2].In fact,the time interval of detachment can be longer than the energy confinement time,which is about tens of milliseconds,but not ten times longer than energy confinement time due to many reasons,such as limited duration of NBI heating and discharge control in HL-2A in the last campaign.It is difficult to have slow evolution of the detachment states,which may result in transient rather than stationary regimes.
Figure 4(a)illustrates the ion saturation current densityJsatmeasured by the target probe arrays on the inner divertor target,which shows an apparent decrease from 5 to about 2 A cm −2 when reaching detachment.The maximum electron temperature in the poloidal direction(Zin figure 4(b))shows a sharp reduction from 20 to 3 eV.The heat flux measured by the IR camera decreases from 0.5 to about 0.2 MWm−2,which decreases by 60% in the outer target(figure 4(c)).These results from the divertor target demonstrate further that detachment has been realized in the HL-2A tokamak.In addition,it is found that the inner target detaches earlier than the outer target.The inner target starts detaching at about 1150 ms,while the outer target starts the process of detachment at about 1158 ms.
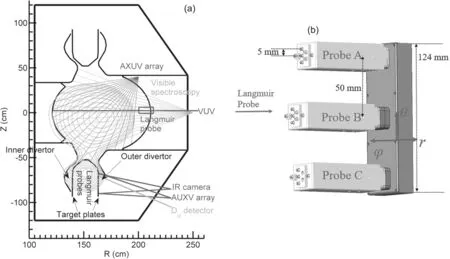
Figure 1.(a)Skeleton of parts of the diagnostics employed in the main plasma chamber and divertor region and(b)a schematic diagram of a probe array with θ denoting the poloidal direction,φ denoting the toroidal direction and r denoting the radial direction.
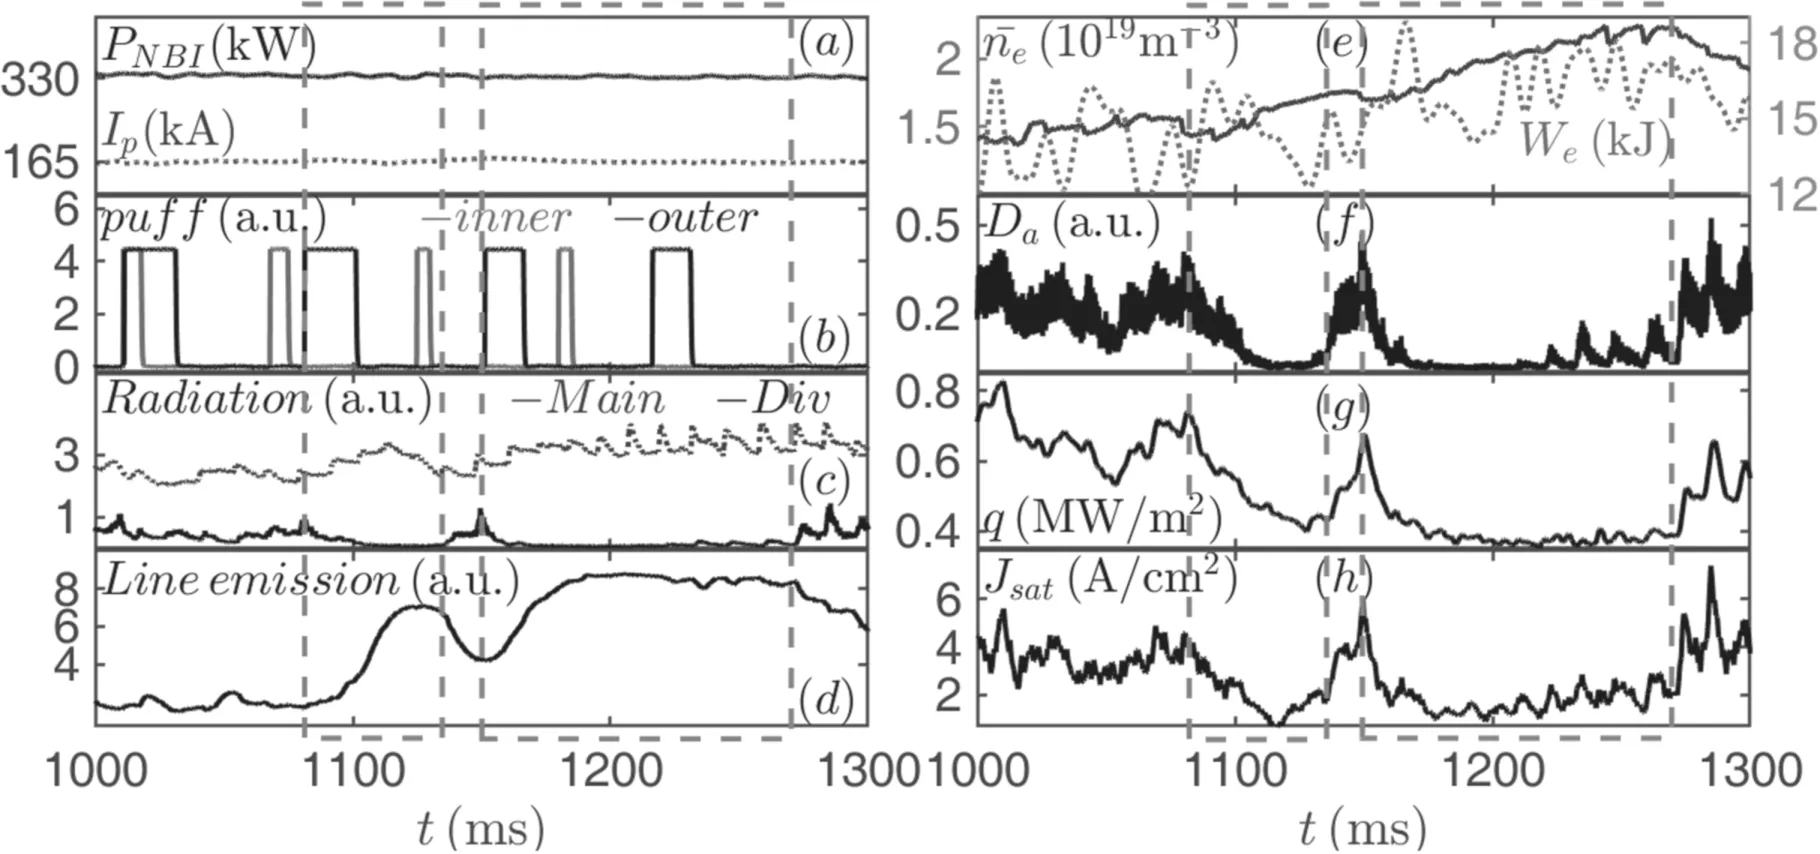
Figure 2.Time evolution of relevant plasma parameters in the main and divertor chambers,among which(a)is the NBI power PNBI and plasma current Ip ,(b)the gas puffing in the inner and outer divertor,(c)the plasma radiation in the main chamber and in the divertor measured by AXUV,(d)the line emission of nitrogen measured by VUV,(e)the line-average density and stored energy We,(f)the Dα radiation in the divertor,(g)the heat flux on the outer target measured by the IR camera and(h)the ion saturation current density Jsat in the outer target measured by the target probe arrays.Two magenta boxes are the two processes of attachment to detachment.
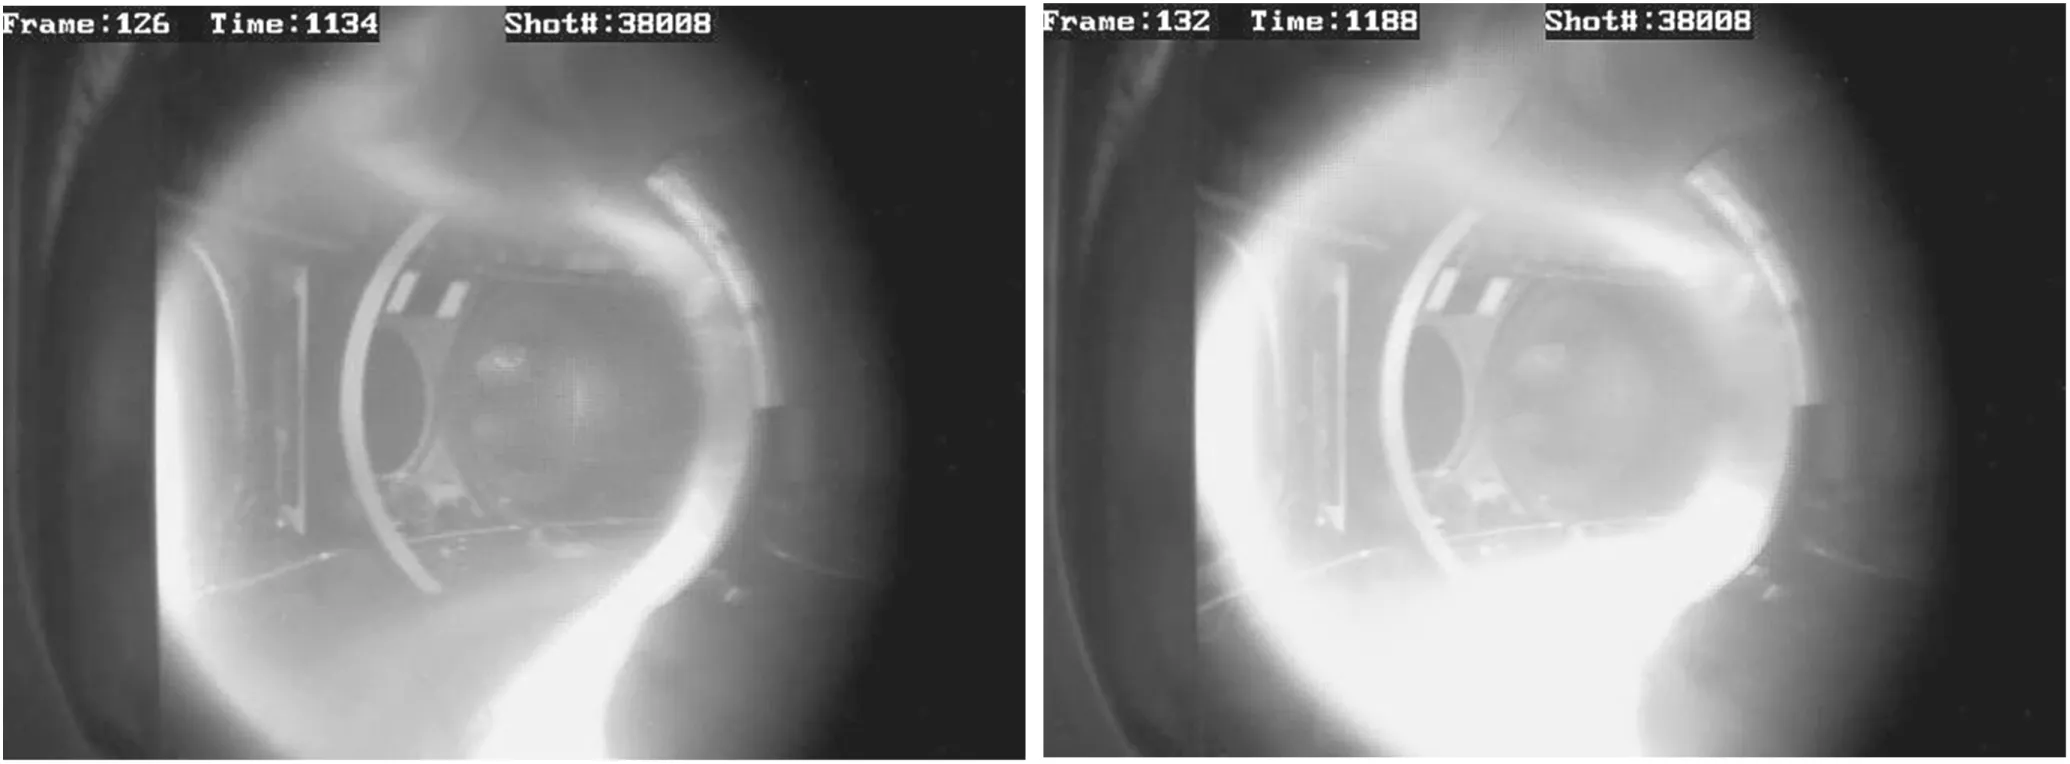
Figure 3.CCD camera shows the distribution of plasma radiation in the main chamber(a)in the attached state(after puffing)and(b)in the pronounced detached state.
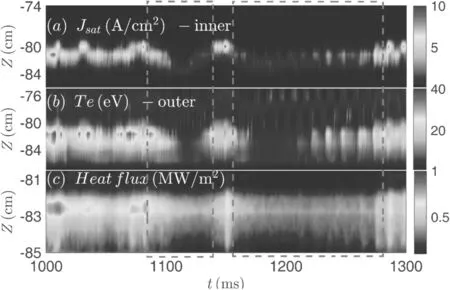
Figure 4.Spatial-temporal of(a)ion saturation current density by target probe arrays at the inner divertor target,(b)electron temperature from target probe arrays and(c)heat flux measured by the IR camera at the outer divertor target.Two magenta boxes are the two processes of attachment to detachment.
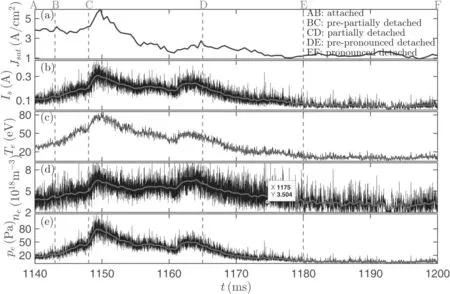
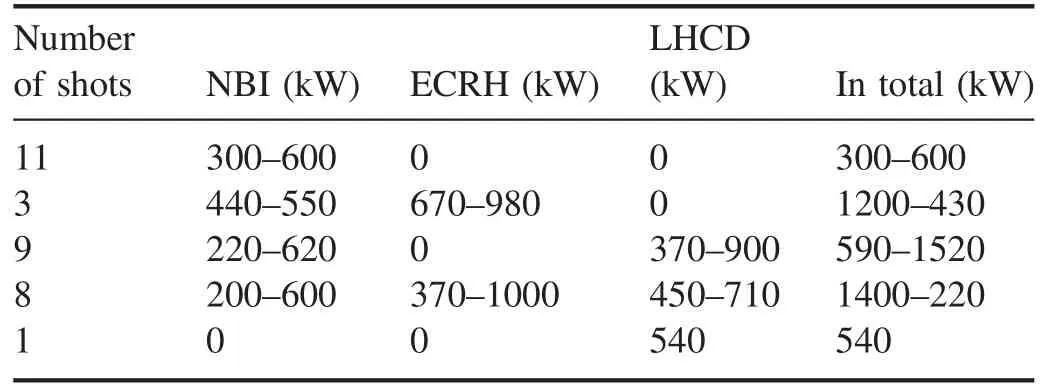
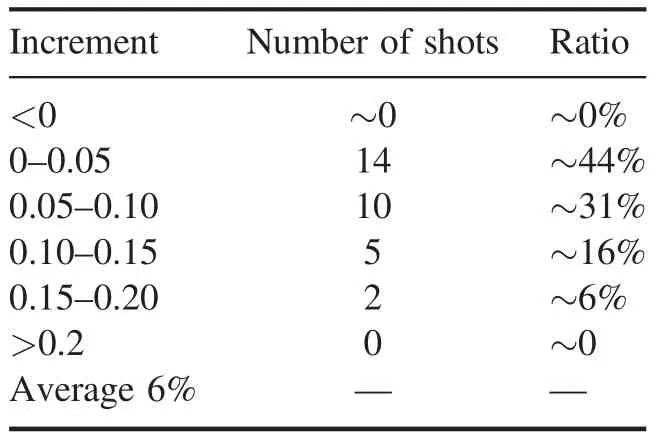
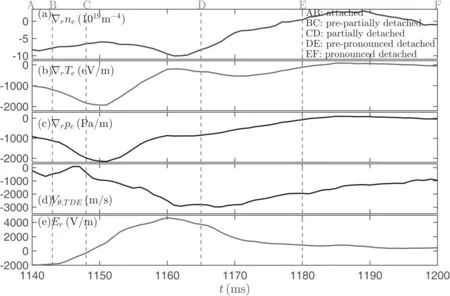
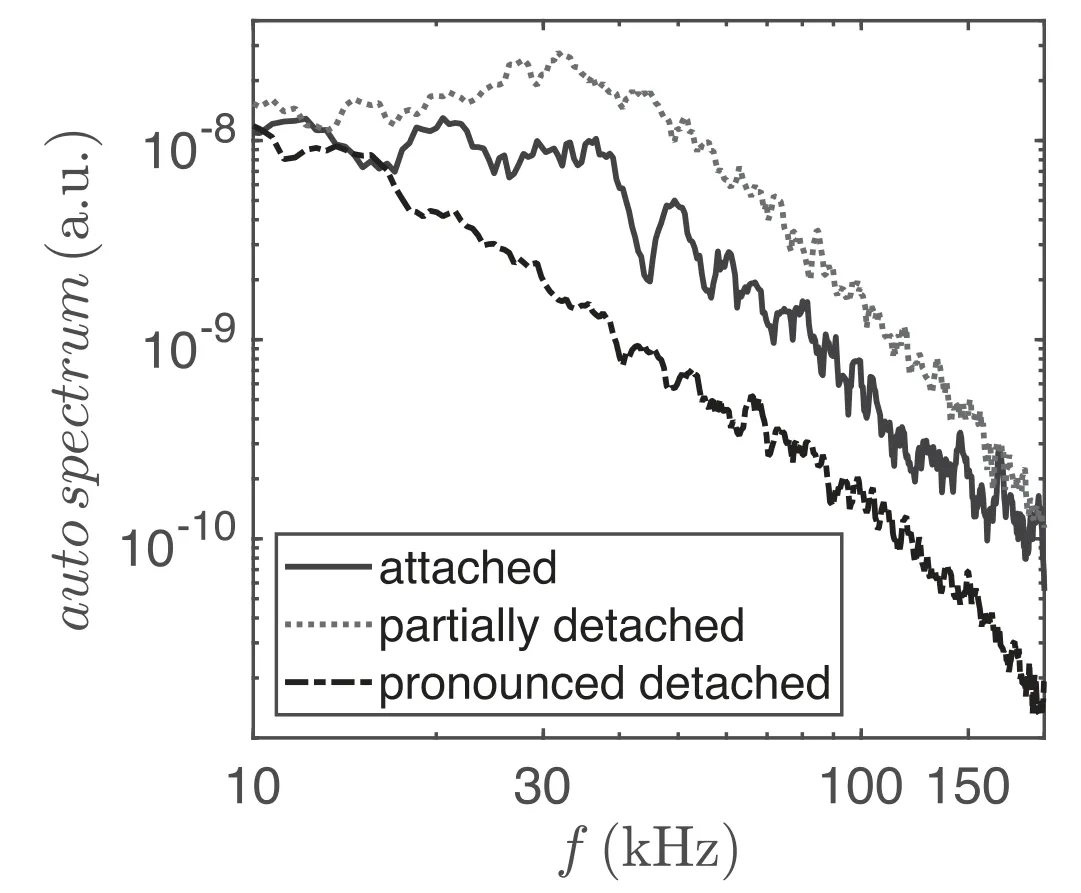
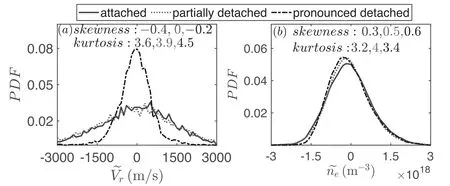
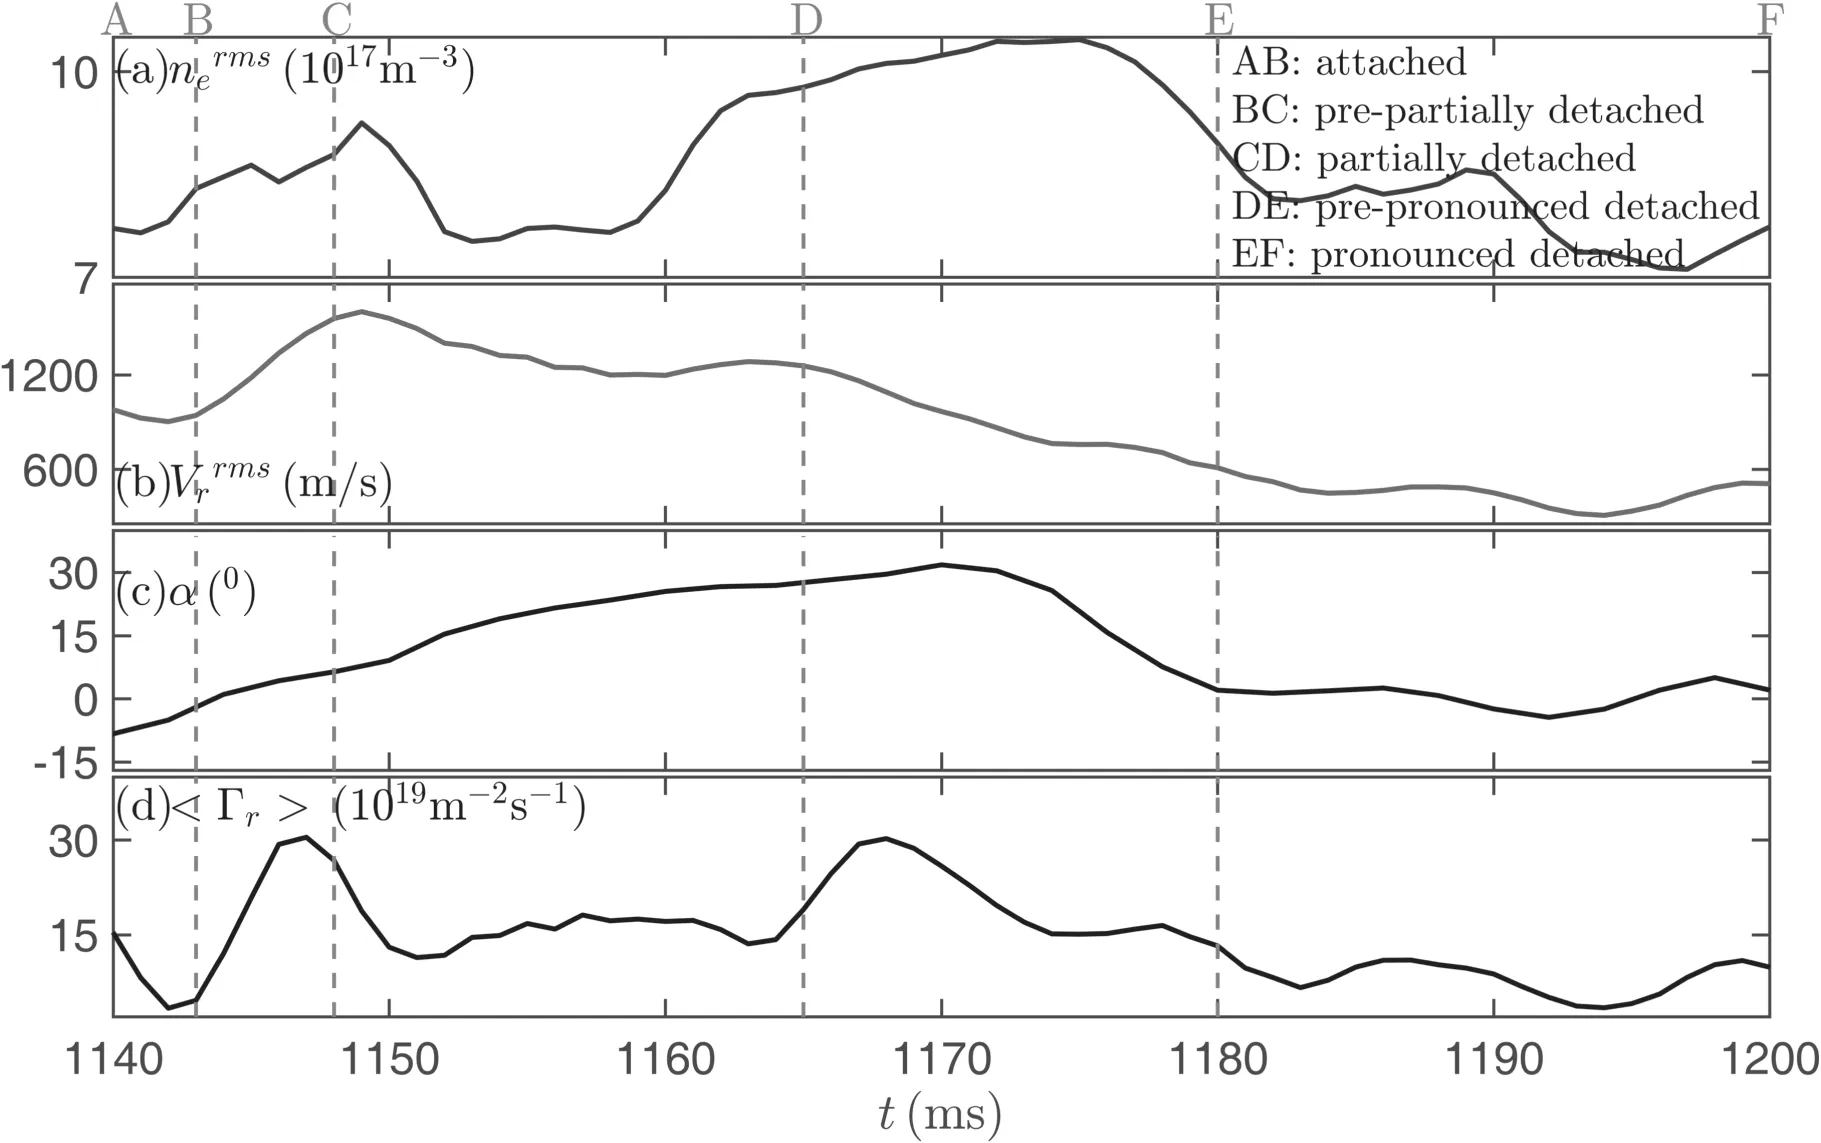
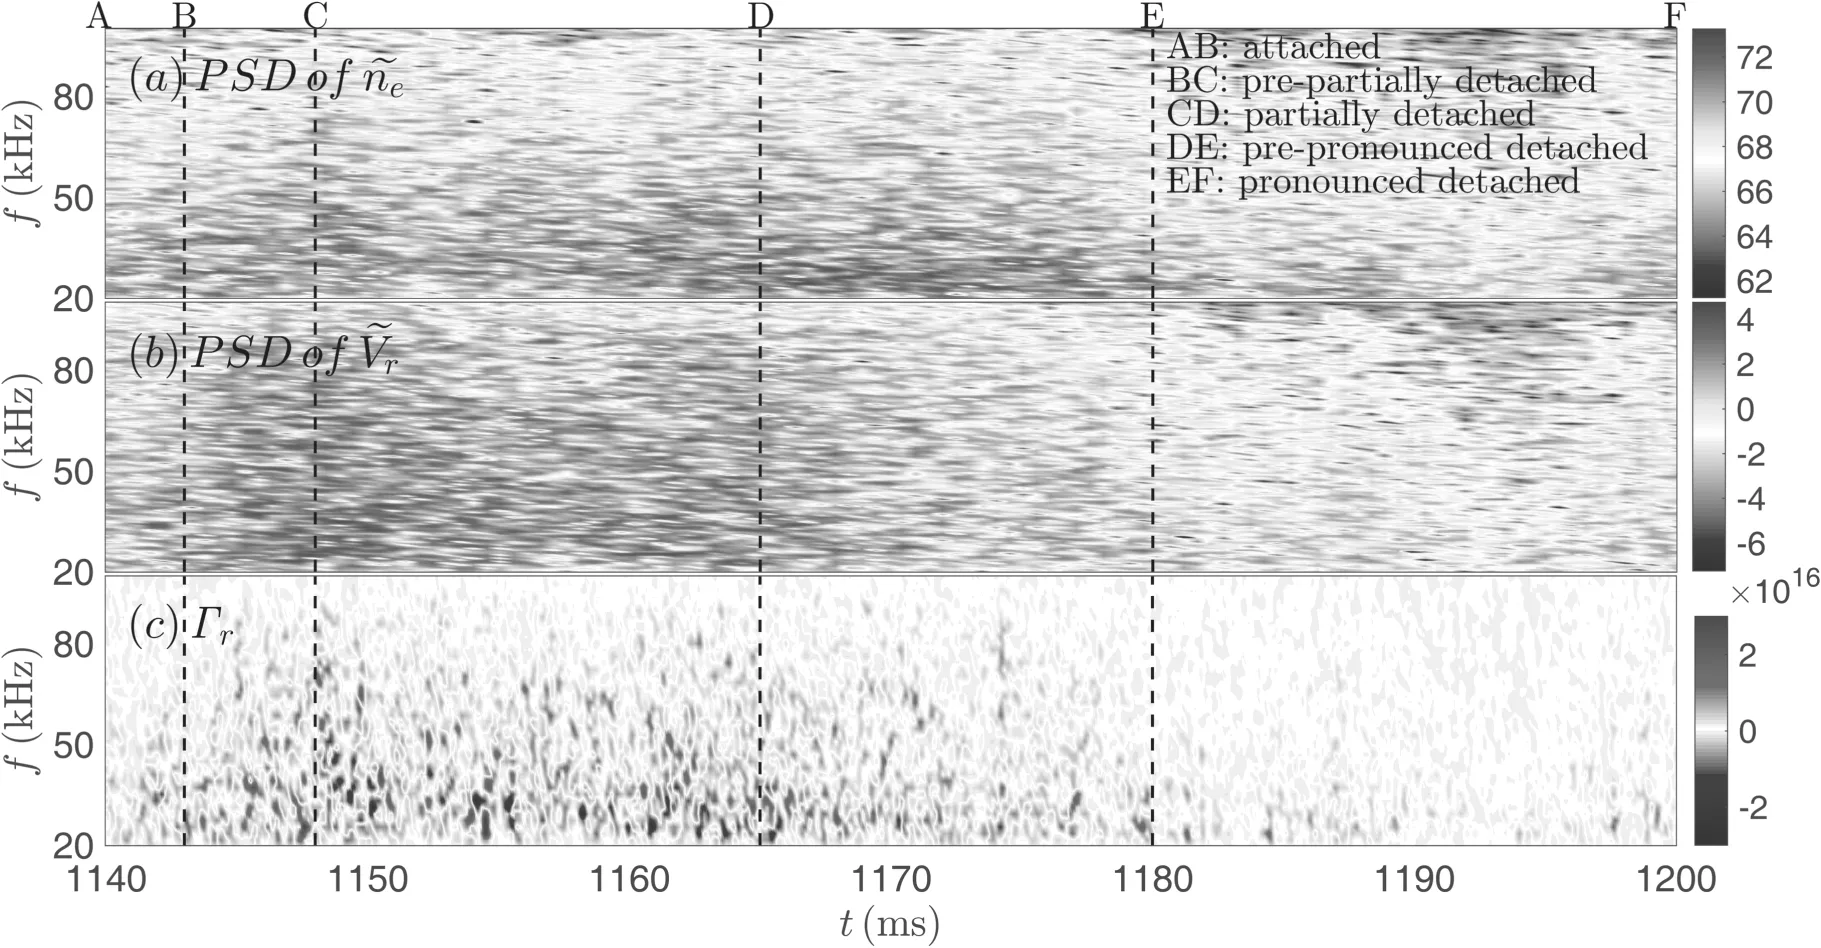
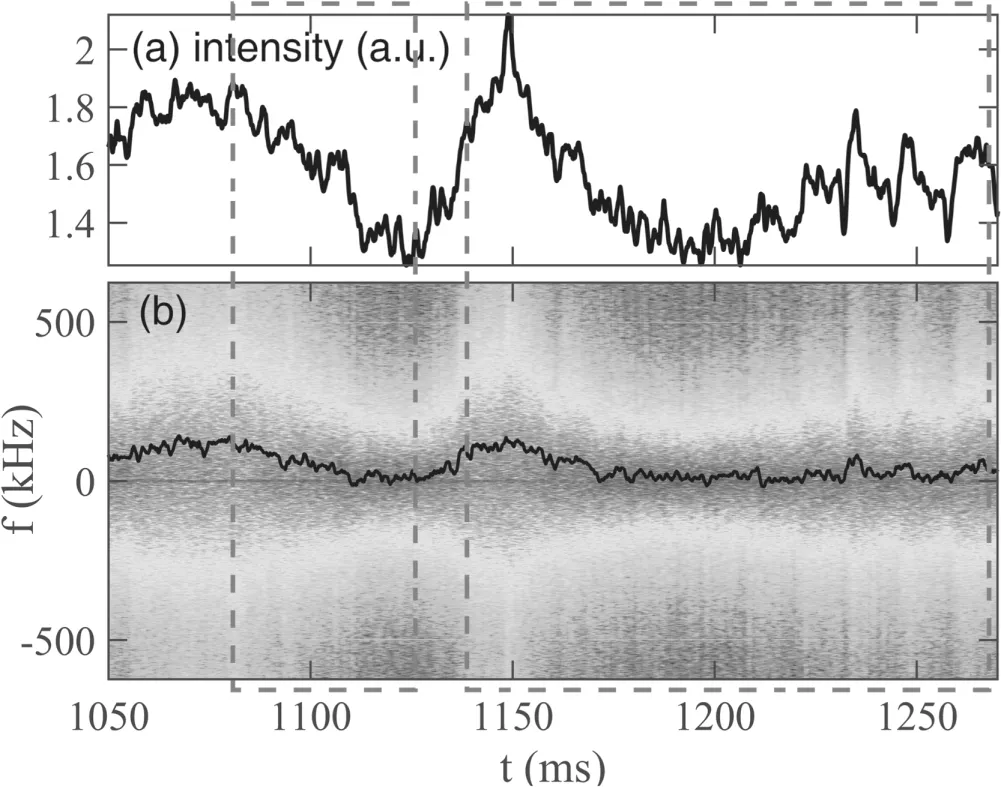
Figure 5 presents the spatiotemporal information of NII line emission in the main chamber visible spectrometry.There is a pronounced peak around the time 1100 ms.Another NII emission peak shapes during the time of 1150–1200 ms and then decays gradually without keeping injectingN2.The interval between peaks is attributed to the pulse of injection.The NII emission concentrates in the lower half plane(−35 cm Figure 5.Spatial-temporal profiles of N II emission in log-scale in the main chamber shown by visible spectroscopy.Two magenta boxes are the two processes of attachment to detachment. Figure 6.Time evolutions of(a) Jsat in the outer target,(b)ion saturation current Is,(c)electron temperature Te ,(d)electron density n e ,(e)electron pressure pe measured near the LCFS by Langmuir probes in the outer mid-plane. As shown in figure 2(e),core confinement is not degraded after detachment on HL-2A L-mode plasma.In order to investigate how divertor detachment affects confinement,32 shots with different gas species,gas injection methods and locations as well as various heating schemes are analyzed and listed in tables 1 and 2.In table 1,injected gas is either mixed gas(N2+ D2)orN2only from the inner and/or outer target.Injection of other gases is not discussed here since the plasma behavior may be different.‘NW’ means gas is injected only from the northwest sector,while ‘NW+SO’ means gas is injected from both the northwest and southeast sectors.‘Continuous’ means gas is injected continuously for 100–400 ms.In table 2 the Ohmic heating power is not included since it is almost the same in different shots,which is about 300 kW(the plasma current is about 160 kA times,the loop voltage about 1.8 V).In order to obtain reliable results,the strategy is to make an average of stored energy of 50 ms(comparable to the energy confinement time)before detachment as the value of stored energy before in the attached state,and an average of stored energy within tens of milliseconds as the value of stored energy in the detachment state during each shot.Here,the detached state can be either the partially detached state or the pronounced detached state. Table 3 shows the increment of stored energy after detachment.In 75%of shots,the stored energy presents a low amplitude of increment(less than 10%);and in the other shots,the stored energy increases by 10%–20%.The average increment of stored energy after detachment is about 6% in these 32 shots.It can be concluded that the stored energy is not degraded but shows a slight increment after detachment in HL-2A L-mode plasma. Table 1.Information of gas injection. Table 2.Information of heating scheme. Table 3.Increment of stored energy after detachment in 32 shots. As illustrated above,plasma radiation in the main chamber increases to a great extent(figures 2(c)and 4),while the total energy remains the same or increases a little(figure 2(e)).There must be a change of some other physical quantities to conserve the energy.Since the plasma profiles,especially edge profiles,change significantly during detachment,edge turbulence and transport,which are critical to plasma confinement,are investigated in the following sections.Since turbulence in plasma affects confinement,it is necessary to investigate the evolution of edge turbulent transport during detachment. 3.3.1.Edge plasma parameters before and after detachment.Turbulence and induced transport near the last closed flux surface(LCFS)before and after detachment in the outer midplane are carefully analyzed.The Langmuir probe stays at a fixed position,which is very close to the LCFS during a time interval from 1140 to 1200 ms.Plasma performance is similar in process from attachment to detachment,so we take the second process in typical shot #38008 as an example.As shown in figure 6,the process of attachment to detachment is divided into five elaborate states according to plasma parameters on the divertor target and edge turbulent transport:the attached state(AB zone),the pre-partially detached state(BC),the partially detached state(CD),the pre-pronounced detached state(DE)and the pronounced detached state(EF).In the two pre-state states,plasma parameters evolve rapidly in the outer mid-plane.The classification of each state in this paper is identified according to plasma parameter evolution in the divertor as well as in the mid-plane,which is different to the classification in AUG[19,20].The phenomenology reported here does not correspond to what is typically performed in detachment experiments. In the attached state,Dαradiation in the divertor region is strong andJsatis about 4 A cm−2in the outer divertor target.The plasma parameters,such as the electron densityneand electron temperatureTeand their radial gradients,are stable.In the pre-partially detached state,the inner and outer targets are still in the attached state.In addition tone,which increases slightly,Teand electron pressurepeand their radial gradients increase rapidly.In the partially detached state,Jsatin the outer divertor target usually decreases and then remains at a low amplitude,while edge plasma parameters in the outer mid-plane are maintained at high levels.TheDαsignal shows the same tendency asJsat.It is noted that it is the sawtooth(t∼1148 ms)that causes a peak in the signals.Meanwhile,the radiation close to the X-point becomes stronger.The pre-pronounced detachment states are characterized by a dramatic reduction in edge plasma parameters in the outer mid-plane in a timescale of about 15 ms,particularlyTe,which decreases from about 46 to 12 eV,by about 80%.Thenein the edge shows a smaller reduction since the line-average density increases rapidly,as shown in figure 2(e).An obvious and interesting fact is that the gradients of these parameters become smaller and smaller,and at the end of this pre-pronounced detached state they all approach 0,as shown in figures 7(a)–(c).In this state,Dαin the divertor chamber andJsatin the outer target decrease to very low amplitudes.In the pronounced detached state,Dαin the divertor chamber andJsatin the outer target are maintained at very low amplitudes,while visible radiation is very strong near the X-point and it becomes stronger at the plasma boundary,as shown in figure 4.The strong radiation cooled the plasma boundary,resulting in the main plasma parameters,especiallyTeandpe,being at very low amplitudes.Their gradients are all near 0,implying a very flat edge plasma profile. The physics of the plasma parameter evolutions in the outer mid-plane before pronounced detachment can be understood by means of examining edge radial electric fieldErand poloidal velocityVθ,which are almost synchronously evolving.Erremains at −2000 V m−1in the attached state,and then varies rapidly to about 0 V m−1in the pre-partially detached state and keeps increasing to as large as 4000 V m−1in the partially detached state,which results in a strong poloidal velocityVθshear layer around the LCFS.Erdecreases from 3500 V m−1sharply to a few hundred V m−1in the pre-pronounced state and remains at a very low amplitude in the pronounced detached state.The evolutions ofErandVθimply the dramatic change of edge turbulence and flow shear.More information about edge turbulence and transport is required,which necessitates further study. 3.3.2.Edge turbulence and transport.Edge turbulence and transport play an important role in plasma confinement.Understanding how edge turbulence transport evolves and its relation to detachment will be helpful for detachment operation for tokamaks.Figure 8 shows the auto-spectra of ˜Isin the attached,partially detached and pronounced detached states around the LCFS measured by Langmuir probe arrays in the outer mid-plane.The auto-spectra of ˜Isin the pre-partial and prepronounced detached states are not discussed here because plasma parameters evolve rapidly during both states.According to the auto-spectra,the characterized bands of turbulence are in the frequency range of about 20–100 kHz.It is clear that turbulence intensity increases in the partially detached state.When the plasma reaches the pronounced detached state,the turbulence intensity decreases dramatically,but is much smaller than that of the attached state. Figure 7.Time evolutions of the radial gradient of(a)electron density ∇rne,(b)electron temperature ∇rTe,(c)electron pressure ∇rpe,(d)poloidal velocity by time delay estimate(TDE)Vθ,TDE,and(e)the radial electric fieldEr measured near the LCFS by Langmuir probes in the outer mid-plane. Figure 8.Auto-spectra of in the attached,partially detached and pronounced detached states around the LCFS measured by Langmuir probe arrays in the outer mid-plane. Figure 9.Normalized PDFs of the(a)radial velocity fluctuation and(b)electron density fluctuation. Figure 10.Time evolution of the rms of(a)electron density fluctuation and(b)radial velocity fluctuation,(c)cross-phase between fluctuated density and radial velocity and(4)turbulent particle flux in the process from attached to pronounced detached state. Figure 11.(a)Time-frequency PSD of the density fluctuation,(b)time-frequency PSD of radial velocity fluctuation and(c)spectral function of turbulent particle flux. Figure 12.(a)Relative density fluctuations and(b)spectrogram of the Doppler backscattering signal measured at the edge plasma together with the derived poloidal velocity.Poloidal velocity is obtained from the estimated Doppler shift(black line)times a constant 0.014. The normalized probability distribution functions(PDFs)of fluctuated radial velocity fluctuations and electron density fluctuations are shown in figure 9.One can see that the PDFs of radial velocity fluctuations are very similar in the attached and partially detached states,lying in a range from −3000 to 3000 m s−1,while they are concentrated in a range from−1500 to 1500 m s−1in the pronounced detached state.It is clear that the width of half height of the PDF in the pronounced state is much smaller than those in the attached and partially detached states.The kurtosis values are 3.6,3.9 and 4.5 in the attached,partially detached and pronounced detached states,respectively.The larger kurtosis value agrees with the smaller width of half height of the PDF in the pronounced detached state,indicating the strong reduction in radial velocity fluctuations in this state.The values of skewness of radial velocity fluctuations in the three states are about −0.4,0 and −0.2,respectively.Negative skewness value means that the PDF is negatively deviated.The PDF of fluctuated electron density varies slightly.Its skewness values are 0.3,0.5 and 0.6 in the three states,respectively,meaning that distribution of density fluctuation is positively deviated and increases slightly. Turbulent particle flux is studied in detail in figure 10.denotes the root mean square(rms)of density fluctuation,andrepresents the rms of fluctuated radial velocity.The correlation coefficient between the density and radial velocity fluctuation is about 0.75–0.78,which varies slightly from the attached to the pronounced detached state.The cross-phase of fluctuated density and radial velocity is shown in figure 10(c).Density fluctuation varies moderately in the whole process.The radial velocity fluctuation level is about 1200 m s−1in the attached state,and dramatically increases to 1800 m s−1in the pre-partially detached state,and then remains at about 1500 m s−1in the partially detached state,followed by a sharp decrease to about 800 m s−1in the pre-pronounced detached state,and finally remains at a magnitude of a few hundred m s−1in the pronounced detached state.The cross-phase is about negative 10° in the attached and pre-partially detached states,and then rises to about positive 20°and maintains this in the partially detached state.It decreases to about 0 in the pre-pronounced detached state and remains the same in the pronounced state. In the attached state,the time-averaged turbulent particle flux is very small,due to the negative cross-phase between density and radial velocity fluctuation,which may be convective cells locating around the LCFS.Turbulent particle flux increases dramatically in the pre-partially detached state,mainly due to the sharp increase in turbulent radial velocity.However,the radial electric field is very small in this state.Turbulent particle flux decreases apparently and then remains in the partially detached state,which is consistent with the strongE×Bshear in this state.In the pre-pronounced state,turbulent particle flux increases at first,corresponding to both the increase in density fluctuation and reducedEr;then turbulent particle flux decreases mainly due to the decreased radial fluctuated velocity as well as contributions from the cross-phase between electron density fluctuation and radial velocity fluctuation.The evolution of turbulent particle transport is consistent with the variation inEr.In the pronounced detached state,due to the redistribution of plasma profiles in the edge,radial gradients of electron temperature and electron pressure are approaching 0.This means that the free energy source for turbulence is very small,which is a major reason for the very low intensity of turbulence and transport in the pronounced detached state. Figure 11 shows the time-frequency spectra of the fluctuated density,radial velocity and turbulent particle flux in log-scale.It can be seen that the main frequency band is in the range of 20–100 kHz,and decays quickly in the above frequency band before the pronounced detached state.However,turbulence above 30 kHz is strongly suppressed in the prepronounced detached state.The major frequency band and intensity of turbulence of radial velocity fluctuation vary obviously in different states.The frequency band becomes broader in the pre-partially detached state and then becomes a little smaller in the partially detached state,and then decreases sharply in the pre-detached state.It decreases further in the pronounced state,whose main turbulence frequency band can hardly be seen.The evolution tendency of turbulent particle flux is similar to that of the fluctuated radial velocity.Here,the spectral function of the turbulent particle flux is the real part of the cross-spectral density(CSD)of density fluctuation and radial velocity fluctuation,as expressed in[21].Hence,it is concluded that with the higher frequency band(f>30 kHz)of fluctuated density,the whole frequency bands of fluctuated radial velocity and turbulent particle flux are strongly suppressed in the pronounced detached state.The results shown in figures 8–11 are consistent in terms of edge turbulence and transport. The relative density fluctuation and poloidal velocity are also measured by the DBS near the LCFS,as shown in figure 12.In figure 12(a),the intensity of relative density fluctuation increases in the partially detached state and decreases in the pronounced state,which agrees with the results in figure 8 measured by Langmuir probe arrays.The poloidal velocity increases in the partially detached state and approaches 0 in the pronounced detached state,which is also consistent with the results of the poloidal velocity measured by Langmuir probe arrays at the outer mid-plane. The reason for non-degradation of plasma confinement under pronounced detachment may be interpreted as follows:although the radiation in the main plasma and especially in the X-point are strong,the intensity of edge turbulent transport is very weak due to flat plasma profiles at the edge;electron density in the core is increasing;electron temperature does not change much in the core plasma.As a consequence,the confinement does not degrade in HL-2A L-mode detached plasma.The effects of the closed divertor configuration on the detachment and edge turbulence transport require further study. The change in the radial electric fieldErin the pronounced detached state is discussed here.As stated in[22],the general tendency is that the better confinement is coupled with more negativeErand lower edge turbulent transport in H-mode plasma.However,in this work,Eris approaching zero in the pronounced state,while the plasma confinement is not degraded simultaneously mainly due to lower edge turbulent transport in detached L-mode plasma in HL-2A.The mechanisms behind the reduced edge turbulent transport in general H-mode plasma(due to stronger shear flow)and the detached L-mode plasma in HL-2A(due to edge cooling via radiation)are different.In addition to turbulent transport,one more significant channel of power exhaust radiation should be considered for confinement in the detached plasma.The fact thatEris approaching zero in the detached L-mode plasma measured by Langmuir probe can be validated by the DBS data in figure 12,where a black line denotes the poloidal velocity approaching zero.This result is different to the general tendency in[22]. It is not very clear why the electron temperature and pressure increase rapidly in the pre-partially detached state.However,the soft X-ray signals are analyzed,and it is found that signals in the center channels decrease while signals in the outside channels increase.This may imply that the plasma energy may propagate from the core to the plasma edge in this case.There are similar observations from other shots,including the shots that have continuous injection up to 300 ms.This may contribute to the increment in electron temperature in the pre-partially detached state,but this requires further study in the near future. The paper presents the characteristics of L-mode detachment,together with its induced evolutions of edge turbulent transport and plasma confinement in NBI-heated plasma in the HL-2A tokamak.Partially detached and pronounced detached states have been achieved in L-mode plasma.The evolution of plasma parameters and edge turbulence in the outer midplane during detachment are carefully discussed to understand the detachment process.The stored energy is maintained in the process from attachment to pronounced detachment.In the partially detached state,edge turbulence and its transport have increased obviously compared to the attached state.In the pronounced detachment state,the redistribution of the plasma profiles due to detachment leads to low amplitude of electron temperature and pressure,as well as very weak edge turbulence and transport.Despite the strong plasma radiation in the pronounced detached state,the reduced edge turbulent transport contributes to the retention of stored energy in detached L-mode plasma in HL-2A.Detachment plays a significant role in the redistribution of plasma profiles,which should be studied further in each detached state. This work is supported by National Key Research and Development Program of China(Nos.2018YFE0303102,2018YFE0 309103,2017YFE0300405 and 2017YFE0301203),National Natural Science Foundation of China(Nos.U1867222,11875124,11905051,11805055 and 11875020)and the Sichuan Youth Science and Technology Innovation Team Project(No.2020JDTD0030). ORCID iDs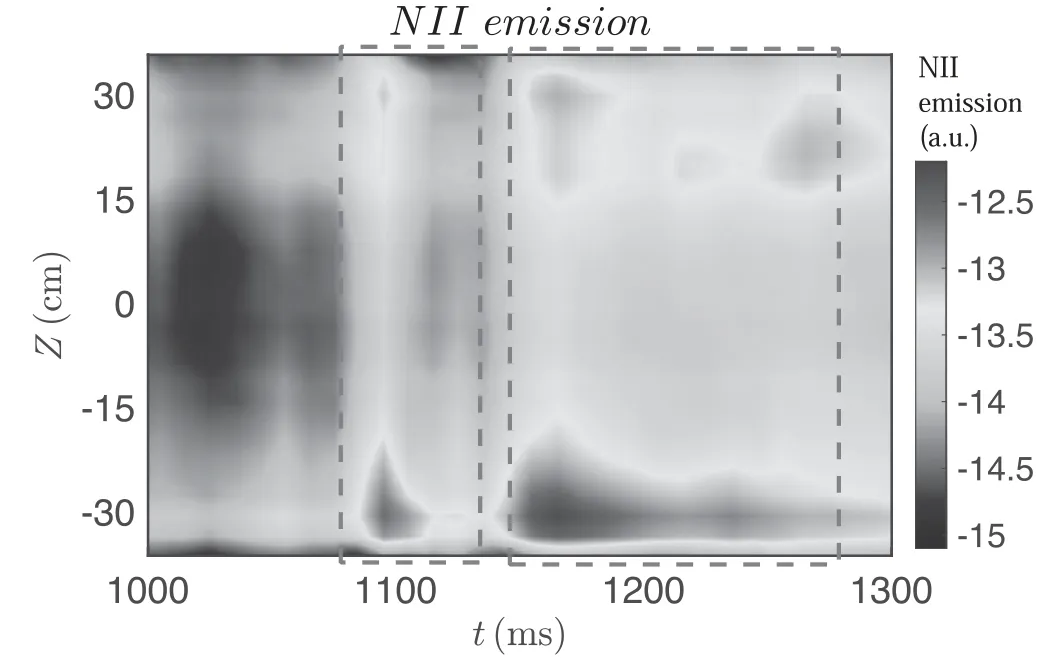
3.2.Plasma confinement under L-mode detachment

3.3.Edge turbulent transport under L-mode detachment
4.Discussion
5.Conclusion
Acknowledgments
猜你喜欢
杂志排行
Plasma Science and Technology的其它文章
- Quasi-coherent mode in core plasma of SUNIST spherical tokamak
- High-resolution x-ray monochromatic imaging for laser plasma diagnostics based on toroidal crystal
- Numerical study of viscosity and heat flux role in heavy species dynamics in Hall thruster discharge
- Development of miniaturized SAF-LIBS with high repetition rate acousto-optic gating for quantitative analysis
- A study of the influence of different grid structures on plasma characteristics in the discharge chamber of an ion thruster
- Focused electron beam transport through a long narrow metal tube at elevated pressures in the forevacuum range
