Correlation between metabolic dysfunction-associated fatty liver disease and liver fibrosis based on Fibrotouch
2023-02-23LIUYunxiaoSUNWeiDOUJingLITIPUAbulimitiZHANGBingGUOYanGUOFengWANGXiaozhong
LIU Yun-xiao, SUN Wei, DOU Jing, LITIPU Abulimiti, ZHANG Bing, GUO Yan, GUO Feng, WANG Xiao-zhong✉
1. Fourth Clinical Medical College of Xinjiang Medical University, Urumqi 830000, China
2. Department of Hepatology, Affiliated Traditional Chinese Medicine, Xinjiang Medical University, Urumqi 830000, China
Keywords:
ABSTRACT Objective: The study aimed to investigate the correlation between metabolic dysfunctionassociated fatty liver disease and liver fibrosis based on Fibrotouch.Methods: During the years 2015-2018, a total of 401 patients with fatty liver diagnosed by imaging and met the diagnostic criteria of MAFLD, examined by transient elastography (TE) were enrolled in the Department of Hepatology of the Traditional Chinese Medical Hospital Affiliated to Xinjiang Medical University.The patients were classified into 4 MAFLD subgroups: MAFLD lean/normal weight group (n=25), MAFLD overweight group (n=52), MAFLD obese group (n=249) and MAFLD diabetic (MAFLD-DM) group (n=75), according to their body mass index (BMI) with or without diabetes mellitus (DM).Fasting plasma glucose (FPG), glycated hemoglobin A1c(HbA1c), liver and kidney function, blood lipid, routine blood test, liver stiffness value (LSM),controlled attenuation parameter (CAP) and so on ,were collected.A variety of noninvasive hepatic fibrosis indexes such as NAFLD fibrosis score (NFS), aspartate aminotransferase (AST)to platelet (PLT) ratio index (APRI), diabetes score (BARD) and fibros-4 index (FIB-4) were used to evaluate the risk of hepatic fibrosis, comparing the general information, biochemical indicators and non-invasive liver fibrosis indicators among them.Whether accompanied with liver fibrosis or not.The patients were divided into MAFLD group and MAFLD liver fibrosis group Univariate analysis and multivariate Logsitics regression analysis were performed to analyze the correlation between MAFLD and liver fibrosis.Results: Systolic blood pressure(SBP), diastolic blood pressure (DBP), PLT, AST, alanyl aminotransferase (ALT), alkaline phosphatase (ALP), gamma-glutamyltransferase (GGT), total cholesterol (TC), low density lipoprotein cholesterol (LDL-C), very low density lipoprotein cholesterol (VLDL-C), albumin(A lb), APRI, FIB-4, hyperlipidemia, history of lipid-regulating drugs, and history of viral hepatitis (hepatitis B and hepatitis C) were not statistically significant.Age, sex, body mass index (BMI), triglyceride (TG), high density lipoprotein cholesterol (HDL-C), creatinine(Cr), uric acid (UA), FPG, HbA1c, NFS score, BARD score, LSM, CAP, diabetes mellitus,hypoglycemic or antihypertensive drug use history, drinking history, smoking history were statistically significant.The proportion of significant and advanced liver fibrosis in MAFLDobese group and MAFLD-DM group was significantly higher than other two groups.Increased BMI, CAP, and APRI scores were associated with an increased risk of liver fibrosis in MAFLD by univariate and multivariate analyses.Conclusion: BMI,CAP and APRI score are risk factors for the progression of liver fibrosis in MAFLD.
1.Introduction
Nonalcoholic fatty liver disease (NAFLD) is a common cause of chronic liver disease worldwide.The prevalence of NAFLD in Asia is 29.62%[1] ,and it is increasing year by year.Nafld has caused a significant economic burden of disease,and it is urgent to take targeted public health strategies.Metabolism of NAFLD in 2020 changed its name to related to fatty liver disease (metabolic associated fatty liver diseases,MAFLD)[2],characterized by systemic metabolic disorders related to hepatic steatosis.MAFLD emphasizes overweight/obesity,type 2 diabetes mellitus (T2D), or metabolic disorders as its basic pathogenic factors.Although MAFLD and NAFLD have overlapping effects[3] between prevalence and incidence,MAFLD has a higher level of metabolic abnormalities and fibrosis burden[4] ,thereby better distinguishing patients[5]with metabolic liver disease and accurately identifying their complications risk[6] of NAFLD.While such a diagnosis would not significantly change its prevalence, it might reduce its incidence[7].Therefore, the use of MAFLD diagnostic criteria will be helpful for the identification, diagnosis and treatment of patients at risk of steatosis and liver fibrosis,and it is an important predictor of liver complications.This research has focused on MAFLD group,based on Fibro touch noninvasive diagnosis of liver fibrosis,discusses the group of liver fibrosis, analyze the related influence factors of the two possible plans to further study the relativity between MAFLD and liver fiber to change support,eventually to MAFLD liver fibrosis development provide risk early warning.
2.Objects and Methods
2.1 Subjects
The data of patients diagnosed with MAFLD in the Traditional Chinese
Medicine Hospital Affiliated to Xinjiang Medical University from January 2020 to December 2022 were collected.In strict accordance with the inclusion and exclusion criteria (see Figure 1),401 patients were finally included.
2.2 Diagnostic Criteria
MAFLD diagnostic criteria: refer to the 2020 “Introduction to the International expert consensus on the new definition of metabolicassociated fatty liver disease”[8].According to the 2000 World Health Organization Asian-BMI classification[9],BMI< 23 kg/m2was defined as normal or low weight; Overweight was defined as 23~25 kg/m2 ; 25 kg/m2was obese.Exclusion criteria: age <18 years old;Patients with autoimmune liver disease,drug-induced liver injury and other specific liver diseases leading to fatty liver disease;Severe heart, lung,kidney,brain and other important organ diseases,severe blood system and mental diseases; Pregnancy,malignant tumor and infectious diseases.This study was reviewed and approved by the Medical Ethics Committee of our hospital (Ethics batch number:2023XE -GS 1 9 0).
2.3 Research Methods
2.3.1 General information
The clinical data of all patients were retrospectively collected through the hospital electronic medical record system,and the general information of patients such as gender,age,height,weight,SBP ,DBP,smoking and drinking history,medication history,and past history were recorded.BMI=weight (kg)/height (m) square was calculated.
2.3.2 Biochemical indicators
PLT,ALP,GGT,FPG,HbA1c, Cr,UA,TG,TC,HDL-C, LDL-C,VLDL-C, AST,ALT and Alb were collected.
2.3.3 Assessment of liver fibrosis
Fibro touch and serology were used for non-invasive diagnosis of liver fibrosis,respectively.FIB-4 index was calculated as age × AST(U/L)/PLT (* 109/L) *√ AST (U/L).APRI score = [( upper limit of normal AST/AST) × 100/PLT( *109/L)] , NFS score =-1.675+0.037* age (years) +0.094*BMI (kg/m2) + 1.13* impaired FPG /DM (is +1, No +0) +0.99 *AST/ALT ratio - 0.013 *PLT- 0.66 *ALb(g/dl); BARD score: A BMI of 28 = 1 or + AST/ALT acuity 0.8 =1 + DM = 1.MALFD complicated with liver fibrosis was defined as any of the following non- invasive fibrosis scores,such as FIB-4 index 1.3,APRI score 0.5, NFS score > - 1.455, and BARD score > 2.According to Fibro Touch LSM, F0 : <7.3 kPa for no fibrosis;F1 :7.3~9.7 kPa for mild fibrosis; F2 :9.7- 12.4 kPa for moderate fibrosis; F3:1 2.4~1 7.5 kPa for severe fibrosis; F4: 17.5 for liver cirrhosis.
2.3.4 Assessment of the degree of steatosis
CAP was monitored by Fibrotouch to evaluate steatosis.
2.4 Statistical processing
The data were sorted out, a database was established, and SPSS 23 statistical software was used for statistical analysis.Count data were expressed as median, quartile or rate (%), and χ2test was used.Measurement data to mean±standard deviation (±s), said to normality and f test, meet the normality and homogeneity of variance using multiple sets of single factor analysis of variance; Meet the normal distribution of variance but not neat, USES the Welch inspection; The rank-sum test was used when the normality was not satisfied.The chi square test line of single factor analysis and binary Logistic regression Hosmer - Lemeshow test line and factor analysis,to explore the dangerous factors of MAFLD merger of liver fibrosis.P<0.05 was considered statistically significant.
3.Results
3.1 Comparison of general data and clinical indicators among the four groups
In this study,a total of 401 patients were included in this study,including 25 MAFLD lean/normal group, 52 MAFLD overweight group, 249 MAFLD obese group, and 75 MAFLD-DM group.Among them, each group between SBP, DBP, PLT, AST, ALT,ALP, GGT, TC, LDL-C, VLDL-c, propagated, APRI, FIB-4,hyperlipidemia and lipid medicinal drug history, history of viral hepatitis (hepatitis B and C), there were no statistically significant differences.There were significant differences in age, gender,BMI, TG, HDL-C, Cr, UA, FPG, HbA1c, NFS score, BARD score,LSM, CAP, history of diabetes, history of antidiabetic drugs or antihypertensive drugs, history of drinking, and history of smoking between the groups (P<0.05).See table 1.

Fig 1 Flowchart of the inclusion and exclusion
3.2 Comparison of liver fibrosis stages among the four groups
According to LSM, there were significant differences in liver fibrosis staging among the groups (P<0.05).The proportion of moderate to severe liver fibrosis in MAFLD obesity group and MAFLD diabetes group was significantly higher than that in the other two groups.See Table 2.

Tab 2 Comparison of liver fibrosis stages among the four groups
3.3 MAFLD combination of liver fibrosis, single factor analysis and multifactor Logsitics regression
Univariate analysis by χ2test showed that BMI, CAP, APRI,and drinking history were risk factors for liver fibrosis in MAFLD(P<0.05).See Table 3.Multivariate Logsitics regression showed that BMI, CAP, and APRI were independent risk factors for MAFLD with liver fibrosis (P<0.05), while drinking history was not an independent risk factor for MAFLD with liver fibrosis (P>0.05).See Table 4.
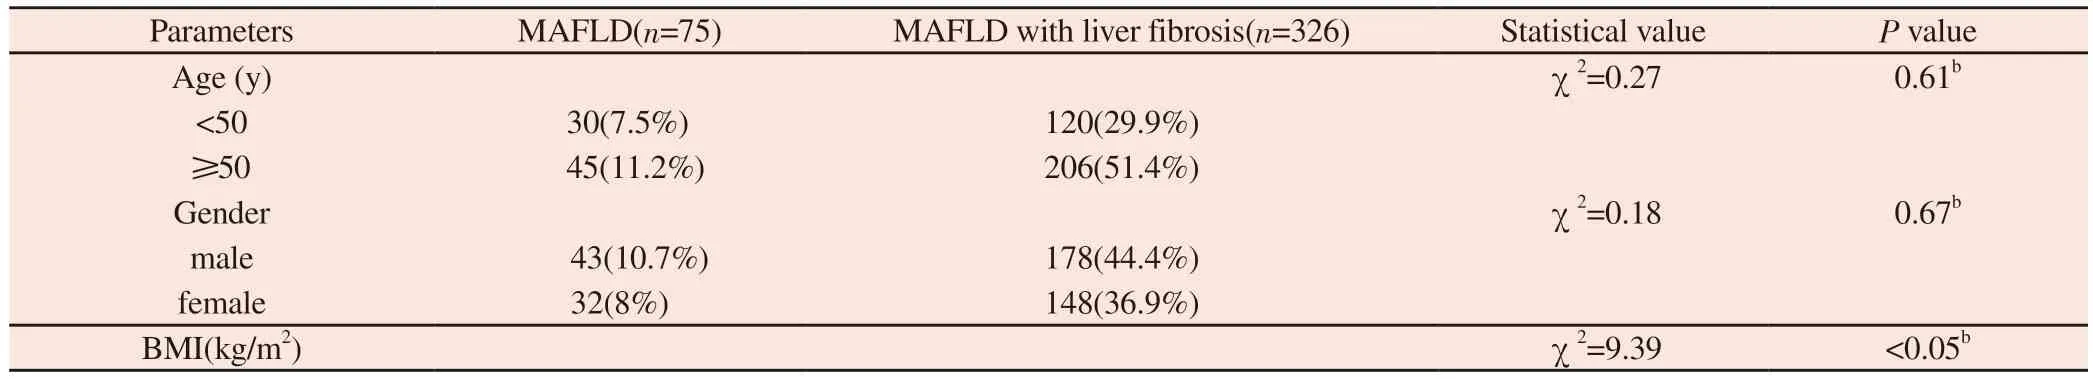
Tab 3 Univariate analysis of MAFLD with liver fibrosis
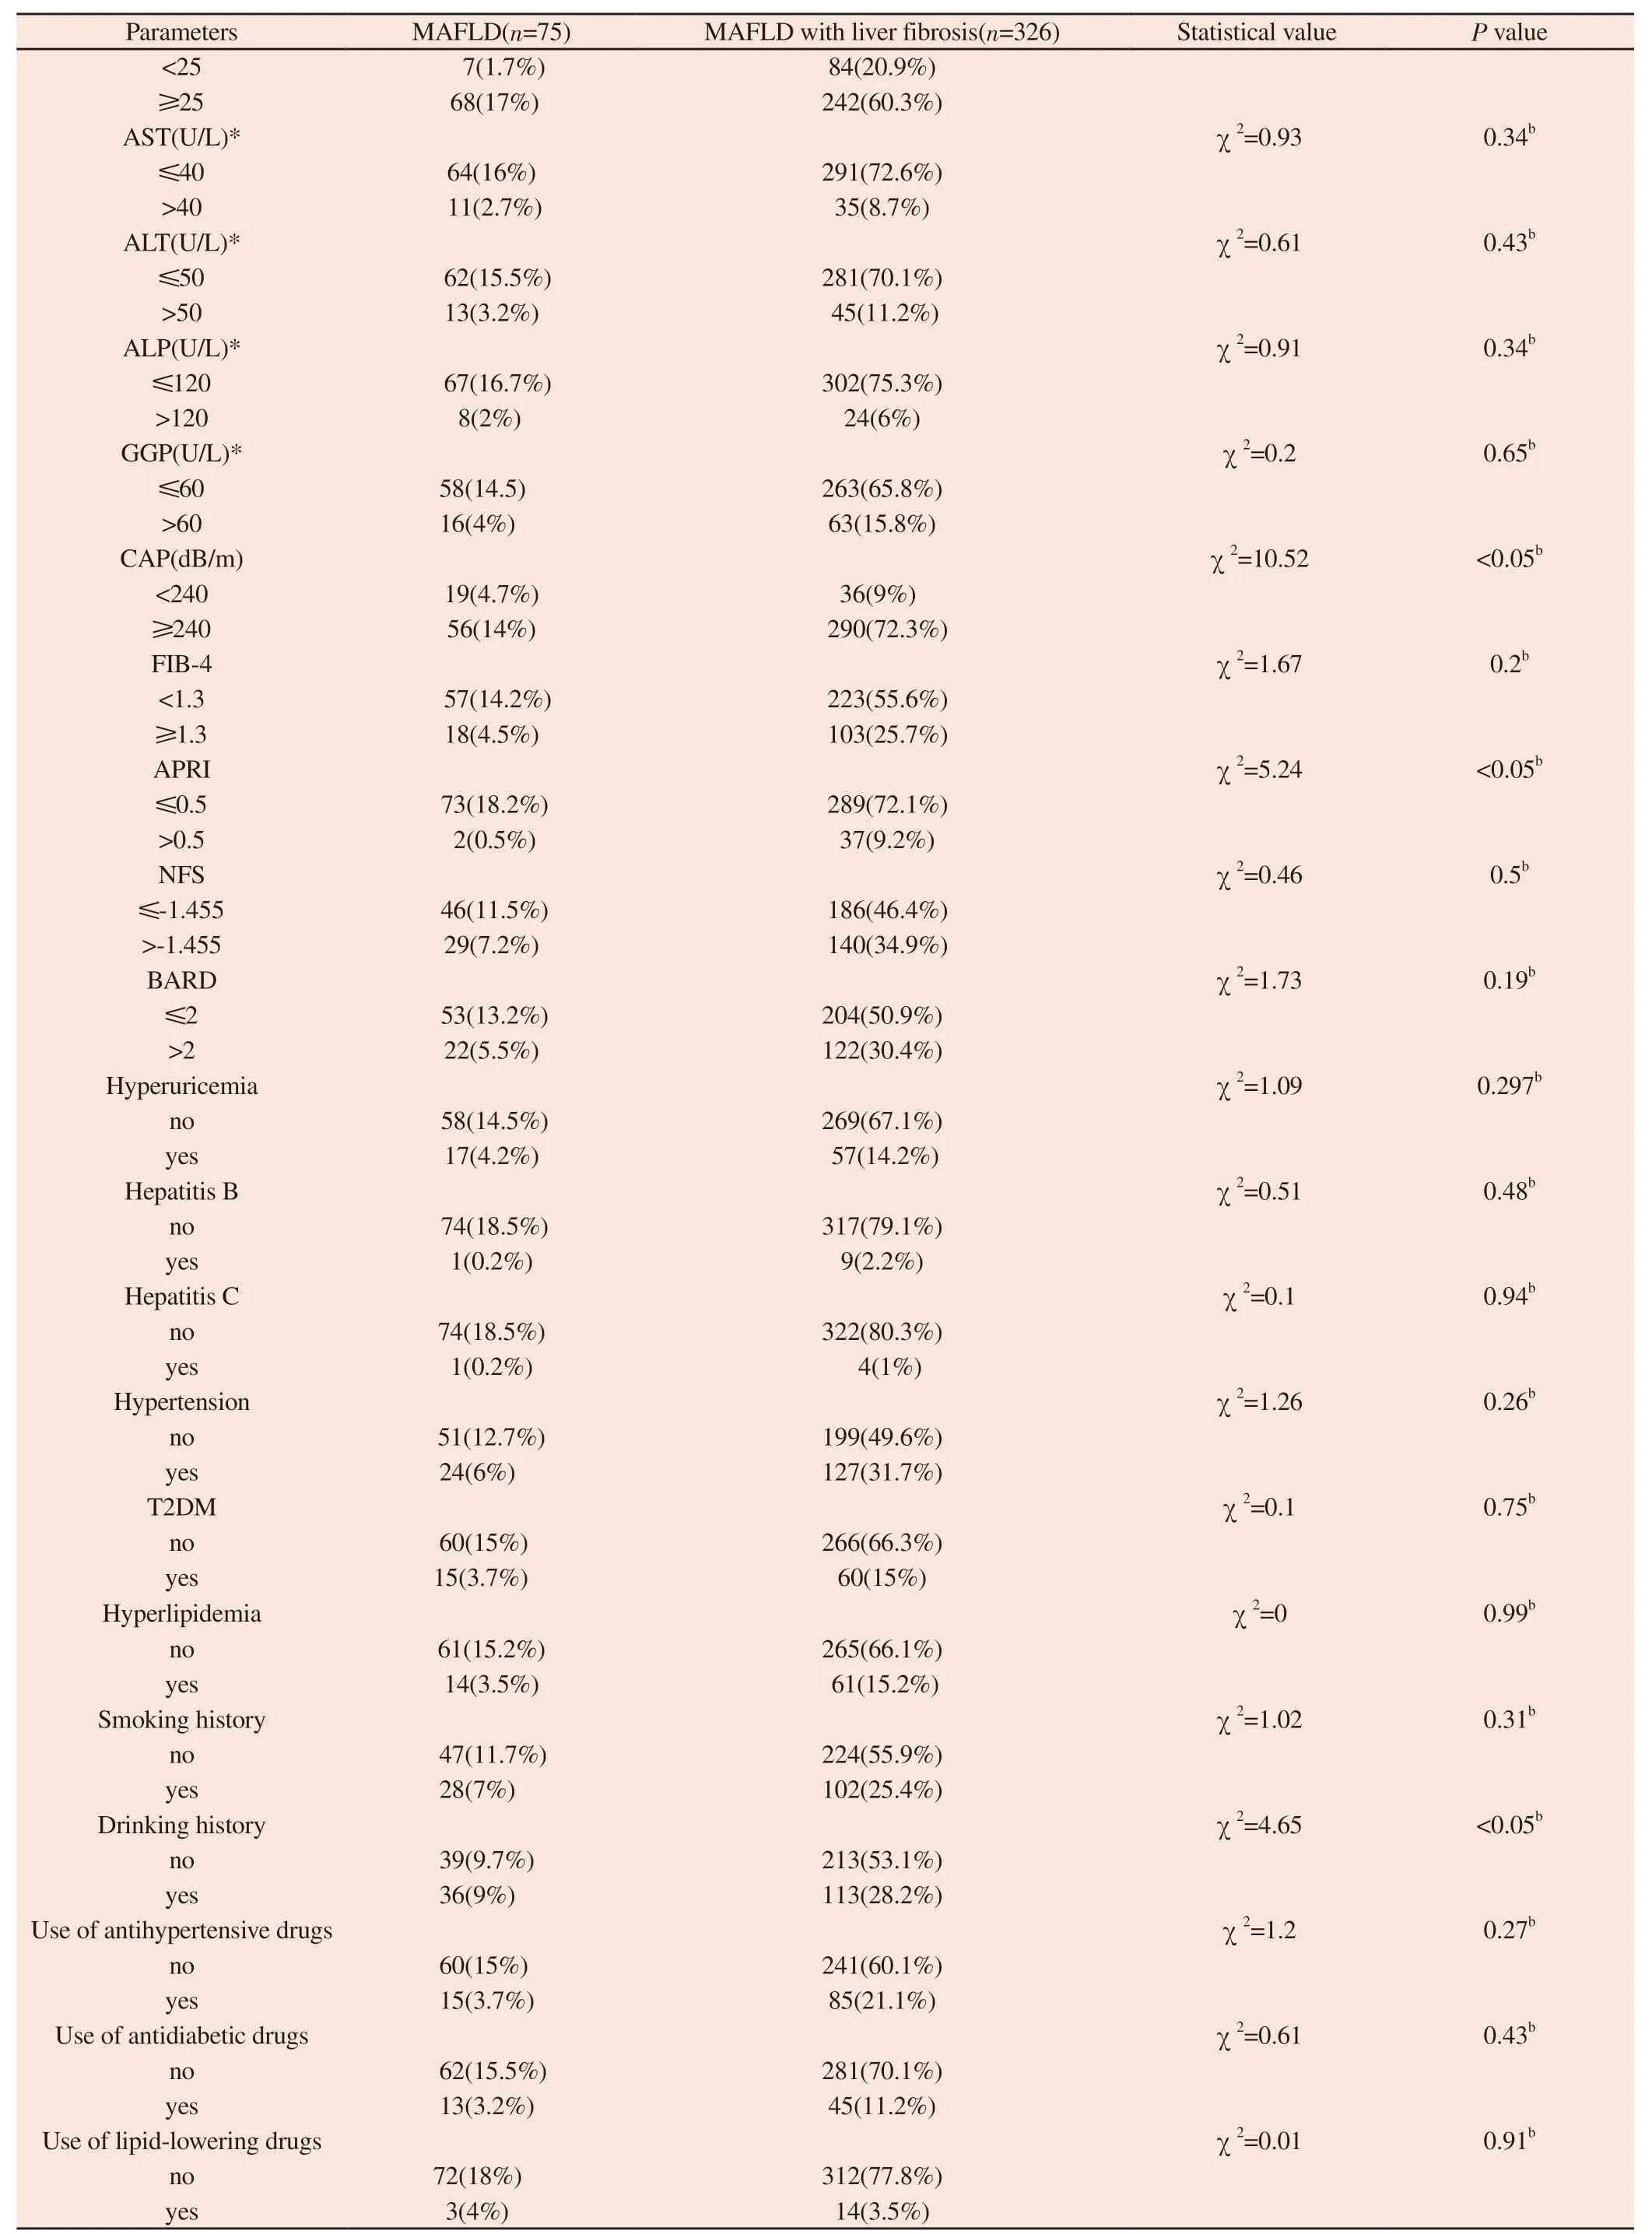
Note: b : χ2 test; * According to the reference range of liver function in our hospital, groups were grouped with the upper limit of normal range.
3.4 Predictive model construction and evaluation
Will be the risk factors included in the Logistic regression analysis,the regression equation model: BMI Log it (P ) = 2.64 + 1.2* 0.83 * CAP - 1.5 5 * APRI.The Hosmer-Lemeshow goodness of fit test showed that the fitting effect was good (χ2=4.16 ,P=0.53).

Tab 4 Multivariate logistic regression analysis of MAFLD with liver fibrosis
4.Discussion
MAFLD affects up to one-third of the global population and is increasing along with the rising incidence of T2DM and obesity.MAFLD increases the risk of end-stage liver disease, hepatocellular carcinoma, death and liver transplantation, and produces extrahepatic diseases, including cardiometabolic diseases and cancer.As an inclusive diagnosis, MAFLD is completely different from the exclusive diagnosis of NAFLD, focusing on systemic diseases and taking metabolic abnormalities and hepatic steatosis as diagnostic criteria.Due to the high prevalence of metabolic diseases in MAFLD population, it is mainly manifested as overweight and glucose imbalance[10].Therefore, BMI and T2DM cannot be regarded as confounding factors but as a component of their diagnosis[11].With the prevalence of obesity and alcohol consumption, studies have found[12] that overweight/obese subjects who drink more than the guidelines have significantly higher liver disease morbidity and mortality than those with normal weight.Moreover, overweight/obesity would increase the risk of alcohol-related liver disease and mortality.However, moderate alcohol consumption is beneficial to the risk of metabolic syndrome and insulin resistance, and can reduce the risk of adverse cardiovascular outcomes and all-cause mortality in patients with NAFLD.Therefore, the effect of alcohol consumption on the mortality of NAFLD patients depends on the amount of alcohol consumed, and moderate alcohol consumption is beneficial for the development and severity of NAFLD, that is, moderate alcohol consumption has a protective effect on the mortality of NAFLD patients, rather than a risk factor.In view of this, further analysis of this research is not to drink, but simply to distinguish the history of drinking, history is not prove that alcohol is MAFLD occur a risk factor for liver fibrosis.
Obesity is one of the most important risk factors for NAFLD/MAFLD.In a study[14], it was found that the prevalence of obesity in MAFLD group was 71.1%, and 79% of obese people had MAFLD.Most of the patients with MAFLD obesity is defined by BMI, it is the most widely used describing the general and central obesity index body.The internal and external validation of NAFLD by BMI and triglyceride glucose (TyG-BMI) proved that TyG-BMI could accurately distinguish NAFLD in the Japanese population,and TyG-BMI was independently and positively correlated with NAFLD [15].A risk stratification nomogram was established by BMI and waist circumference[16], or by BMI, body mass index and waist circumference[17] to screen the risk of MAFLD in overweight or obesity.BMI as a benchmark can better interpret the risk of obesity-related MAFLD/NAFLD, provide red signals for high-risk patients, promote early lifestyle intervention may help to reduce the risk of adverse outcomes, and point out the direction for accurate prevention screening and treatment monitoring.BMI and obesity are independent predictors associated with steatosis[17].Regardless of the presence of obvious fibrosis and T2DM, liver fat accumulation leads to early liver dysfunction in patients with NAFLD[18], and this functional change occurs very early.CAP measured by TE has been shown to be associated with hepatic steatosis and is a convenient,sensitive and non-invasive indicator of metabolic disorders[19].Increased CAP corresponded to the severity of steatosis.Hepatic steatosis is the first step in the pathogenesis of nonalcoholic steatohepatitis (NASH) and liver fibrosis.
The extent of liver fibrosis is the best predictor of liver outcomes.The main reason for the development and evolution of liver fibrosis in MAFLD is the change in the composition of extracellular matrix(ECM).Excessive ECM production and inflammatory responses lead to progressive liver fibrosis, cirrhosis, and even liver failure.Therefore, the progression of MAFLD is closely related to fibrosis[20].In a Rotterdam cross-sectional survey study[21], it was found that the incidence of fibrosis in patients with MAFLD was significantly higher than that in patients with NAFLD, and was more related to severe liver fibrosis.Identify risky MAFLD patients in clinical practice is essential.Although liver biopsy is currently considered the “gold standard” for the diagnosis of liver fibrosis due to the high prevalence of MAFLD, it is impractical to perform liver biopsy in every patient.Non-invasive tests for liver fibrosis with good performance and convenience can overcome the limitations of liver biopsy.Currently, non-invasive scores include APRI, FIB-4, BARD and NFS scores, and ultrasound or magnetic resonance elastography techniques to assess the degree of liver fibrosis.Most of these scores have been tested in NAFLD/MAFLD subjects, but the sensitivity and specificity of different diagnostic methods vary, and not all methods are widely applicable due to economic considerations.TE is the assessment of liver fibrosis and fatty degeneration of one of the best diagnostic method.Fibroscan is recommended by the European Association for the Study of the Liver (EASL) and the American Association for the Study of Liver Diseases (AASLD) to evaluate liver fibrosis in patients with NAFLD.Because it has the advantages of non-invasive, easy to use, low failure rate and high diagnostic efficacy, and LSM is positively correlated with the degree of fibrosis and the progression of MAFLD[22], it is a predictor of all-cause mortality in NAFLD patients[23].However, inflammation of the liver or blood stasis, cholestasis, eating, etc all can affect the LSM,affect the accuracy of liver fibrosis degree judgment.Therefore, it can be combined with other non-invasive liver fibrosis markers to assist the diagnosis.FIB-4 and NFS are considered to be effective predictors of advanced fibrosis, but their performance in predicting fibrosis stage changes is inconsistent and susceptible to interference by factors such as obesity[24].Obesity affects NAFLD fibrosis biomarkers in the performance of the NFS and the specificity of the BARD, score will be increased with the increase of BMI by[25].And FIB - 4 and NFS scores of the specificity of the diagnosis of liver fibrosis increased with the increase of age, especially at the age of 65 or higher specificity were 35% and 20% respectively, thus higher false-positive rate[26].Compared with FIB-4, APRI was the best index for identifying F3, F4 and F1, F2 stages of liver fibrosis,with an area under the ROC curve of 0.923, a sensitivity of 84.1%,and a specificity of 88.2%[27].Even when FibroScan is not available,APRI is still the best indicator for assessing liver fibrosis in NAFLD patients and the most suitable substitute for TE to detect significant fibrosis in NAFLD patients[27].This may be because APRI formula in the laboratory parameters of accurately measuring the use, as the research of NAFLD fibrosis etiology.In addition, APRI is also valuable for excluding advanced fibrosis[28].
In summary, this study suggests that MAFLD complicated with liver fibrosis is significantly correlated with BMI, CAP, and APRI,suggesting that controlling metabolic factors and experimental value indicators is conducive to delaying the progression of liver fibrosis in MAFLD, which has positive significance for improving obesity and metabolic abnormalities, in order to provide valuable advice for the study of MAFLD.
Conflict of interest statement
All the authors declare no conflict of interest.
Author’s contribution
Liu Yunxiao is responsible for the project design,writing papers;Sun Wei and Dou Jing clinical data collation; LiTifu Ablimiti and Guo Yan,liver fibrosis data collation; Zhang Bing,statistical analysis;Guo feng to participate in thesis modification; Wang Xiaozhong was responsible for drawing up the writing ideas,guiding the writing and finalizing the manuscript.
杂志排行

Journal of Hainan Medical College的其它文章
- Research progress in genomics associated with prognosis of upper tract urothelial carcinoma
- A review of clinical research on using FIT screening for colorectal cancer
- Clinical efficacy of external treatment with Zi Cao Yang He Tang combined with hormone therapy for granulomatous mastitis and its effect on cellular pyroptosis proteins
- Sociopsychological impact factors of depression patients during the COVID - 19 epidemic period
- Exploring the mechanism of moist exposed burn ointment for the treatment of diabetic ulcer based on network pharmacology and molecular docking
- Clinical efficacy of leprerelin acetate with different dosage forms in central precocious puberty girls