Evaluation of Uncertainty for Determination of Stevioside Content in Fermented Milk by HPLC
2023-02-21ZhiyongLUHongYUEYuelianNINGXiaoyanHUANGWenhuiHUShuoTANGYujuRENLijunLIUCuizhiLI
Zhiyong LU, Hong YUE, Yuelian NING, Xiaoyan HUANG, Wenhui HU, Shuo TANG, Yuju REN, Lijun LIU, Cuizhi LI
Inner Mongolia Yili Industrial Group Co., Ltd., Hohhot 010110, China
Abstract [Objectives]The paper was to establish an evaluation method for the uncertainty of stevioside(including stevioside, rebaudioside A, rebaudioside B, rebaudioside C, rebaudioside F, Dulcoside A, rubusoside and steviolbioside)content determination in fermented milk based on HPLC.[Methods]The mathematical model of stevioside content and the propagation rate of uncertainty were established, and the sources of uncertainty were analyzed.[Results]The uncertainty mainly came from four main aspects, including standard uncertainty u(C)introduced by solution concentration C, standard uncertainty u(V)introduced by sample volume V, standard uncertainty u(m)introduced by sample mass m weighing and standard uncertainty u(frep)introduced by measurement repeatability of stevioside content after sample dissolution and constant volume.The uncertainty estimation table and fishbone chart of stevioside content X determination were established.The relative synthetic standard uncertainty of stevioside content was obtained, and the standard uncertainty was extended to form the measurement result of stevioside content and its uncertainty report.[Conclusions]The evaluation results can be directly applied to the daily practical detection work.
Key words HPLC, Stevioside, Uncertainty, Relative synthetic standard uncertainty, Extended standard uncertainty
1 Introduction
Stevioside is a series of tetracyclic diterpenoids found in the leaves ofSteviarebaudiana, a perennial herb belonging to Compositae, and its fine products are white powder.It is a kind of natural sweetener with low calories and high sweetness, widely used in low calorie drinks, yogurt, tablet candy and medicine, being an important food additive.In recent years, stevioside has been used in drinks, biscuits, candies and dairy products,etc.Therefore, it is necessary to conduct rapid, sensitive and effective determination of stevioside content for monitoring product quality and controlling product risks, which is of great significance to food safety and national health.
The application of uncertainty has received more and more attention in all walks of life in China.The uncertainty for determination of stevioside content in fermented milk by HPLC was discussed in this paper.The evaluation results can be directly applied to the daily practical detection work.
2 Materials and methods
2.1 Materials and reagentsAcetonitrile(chromatographically pure, Knowles); sodium dihydrogen phosphate, phosphoric acid(chromatography pure, Tianjin Damao Chemical Reagent Factory); zinc acetate, potassium ferrocyanide, glacial acetic acid(guarantee reagent, Tianjin Damao Chemical Reagent Factory); stevioside, rebaudioside A, rebaudioside B, rebaudioside C, rebaudioside F, Dulcoside A, rubusoside and steviolbioside(standard, Anpel).
2.2 Instruments and equipmentsHigh performance liquid chromatography(Agilent); AB265-S analytical balance(Mettler-Toledo, Switzerland); ultrasonic cleaner(Changzhou Kaihang Instrument Co., Ltd.); MS3 vortex mixer(IKA).Measuring instruments and equipments: electronic balance(1/10 000), 50 mL volumetric flask, 10 mL volumetric flask.
2.3 Methods
2.3.1Preparation of filtrate.About 10 g of fermented milk(accurate to 0.1 mg)were loaded into a beaker, added with 15 mL of water and mixed evenly.After treated by ultrasonic sound in 45 ℃ water bath for 15 min, the solution was mixed with 15 mL of acetonitrile, and then continuously treated by ultrasonic sound in 45 ℃ water bath for 10 min to ensure that all of rebaudioside A in the fermented milk were extracted.Approximately 2 mL of zinc acetate solution and 2 mL of potassium ferrocyanide solution were added, mixed well, and transferred to a 50 mL volumetric flask, and finally set to the constant volume with purified water.After standing, the solution was filtered through 0.45 μm organic phase microporous filter membrane, and the filtrate was to be tested.
2.3.2Preparation of standard solution(volumetric method).(i)Standard stock solution(1.0 mg/mL): 0.05 g of standard(accurate to 0.1 mg)were placed in a 50 mL volumetric flask, completely dissolved in 30% acetonitrile aqueous solution, and set to the constant volume.(ii)Rebaudioside A standard intermediate solution: 1mL of each stevioside standard stock solution were absorbed, and set to the constant volume in 10 mL volumetric flasks separately.(iii)Rebaudioside A standard working solution: stevioside standard intermediate solution(0.2, 0.5, 1.0, 2.0, 5.0 mL)were absorbed into 10 mL volume flasks and set to the constant volume with 30% acetonitrile aqueous solution.The series concentrations were 2.0, 5.0, 10.0, 20.0, and 50.0 μg/mL.
The above working solutions were prepared immediately before use.
2.3.3Calculation of rebaudioside A content.The contentXof rebaudioside A in fermented milk was calculated by working curve.
2.3.4Mathematical models and propagation rate of uncertainty.The formula for the determination of rebaudioside A contentXby HPLC was:
X=(C×V×n)/m
(1)
whereXstands for the content of rebaudioside A in the sample, mg/kg;Cstands for the concentration of rebaudioside A in the test solution, μg/mL;Vstands for the constant volume, mL;nstands for the dilution ratio;mstands for the weighing mass of the sample, g.The calculation result retained 3 significant digits.By combining similar influencing factors, repetitive factors of inputsC,V,mandnwere combined and classified as repetitive factors of outputX.Therefore, it was not necessary to evaluate the uncertainty component by repeated introduction of inputsC,Vandnseparately, but the uncertainty component by repeated introduction of measurement results(rebaudioside A contentX)was directly assessed.The test did not involve dilution, sonwas not assessed.For this reason, equation(1)was changed as follows:
X=(CV/m)×frep
(2)
wherefrepis the correction factor of influencing factors of measurement repeatability, and is assigned with 1.From formula(2), it can be seen that the inputsC,V,mandfrepwere interrelated, and the standard uncertainty was synthesized by square and root method.Moreover, the formula for the content of rebaudioside A was only the product and quotient of the inputsC,Vandm, so the synthetic standard uncertainty was calculated in the following simplified way.

(3)
wheresensitivitycoefficientsare: c1=1, c2=1, c3=-1, c4=1.
3 Results and analysis
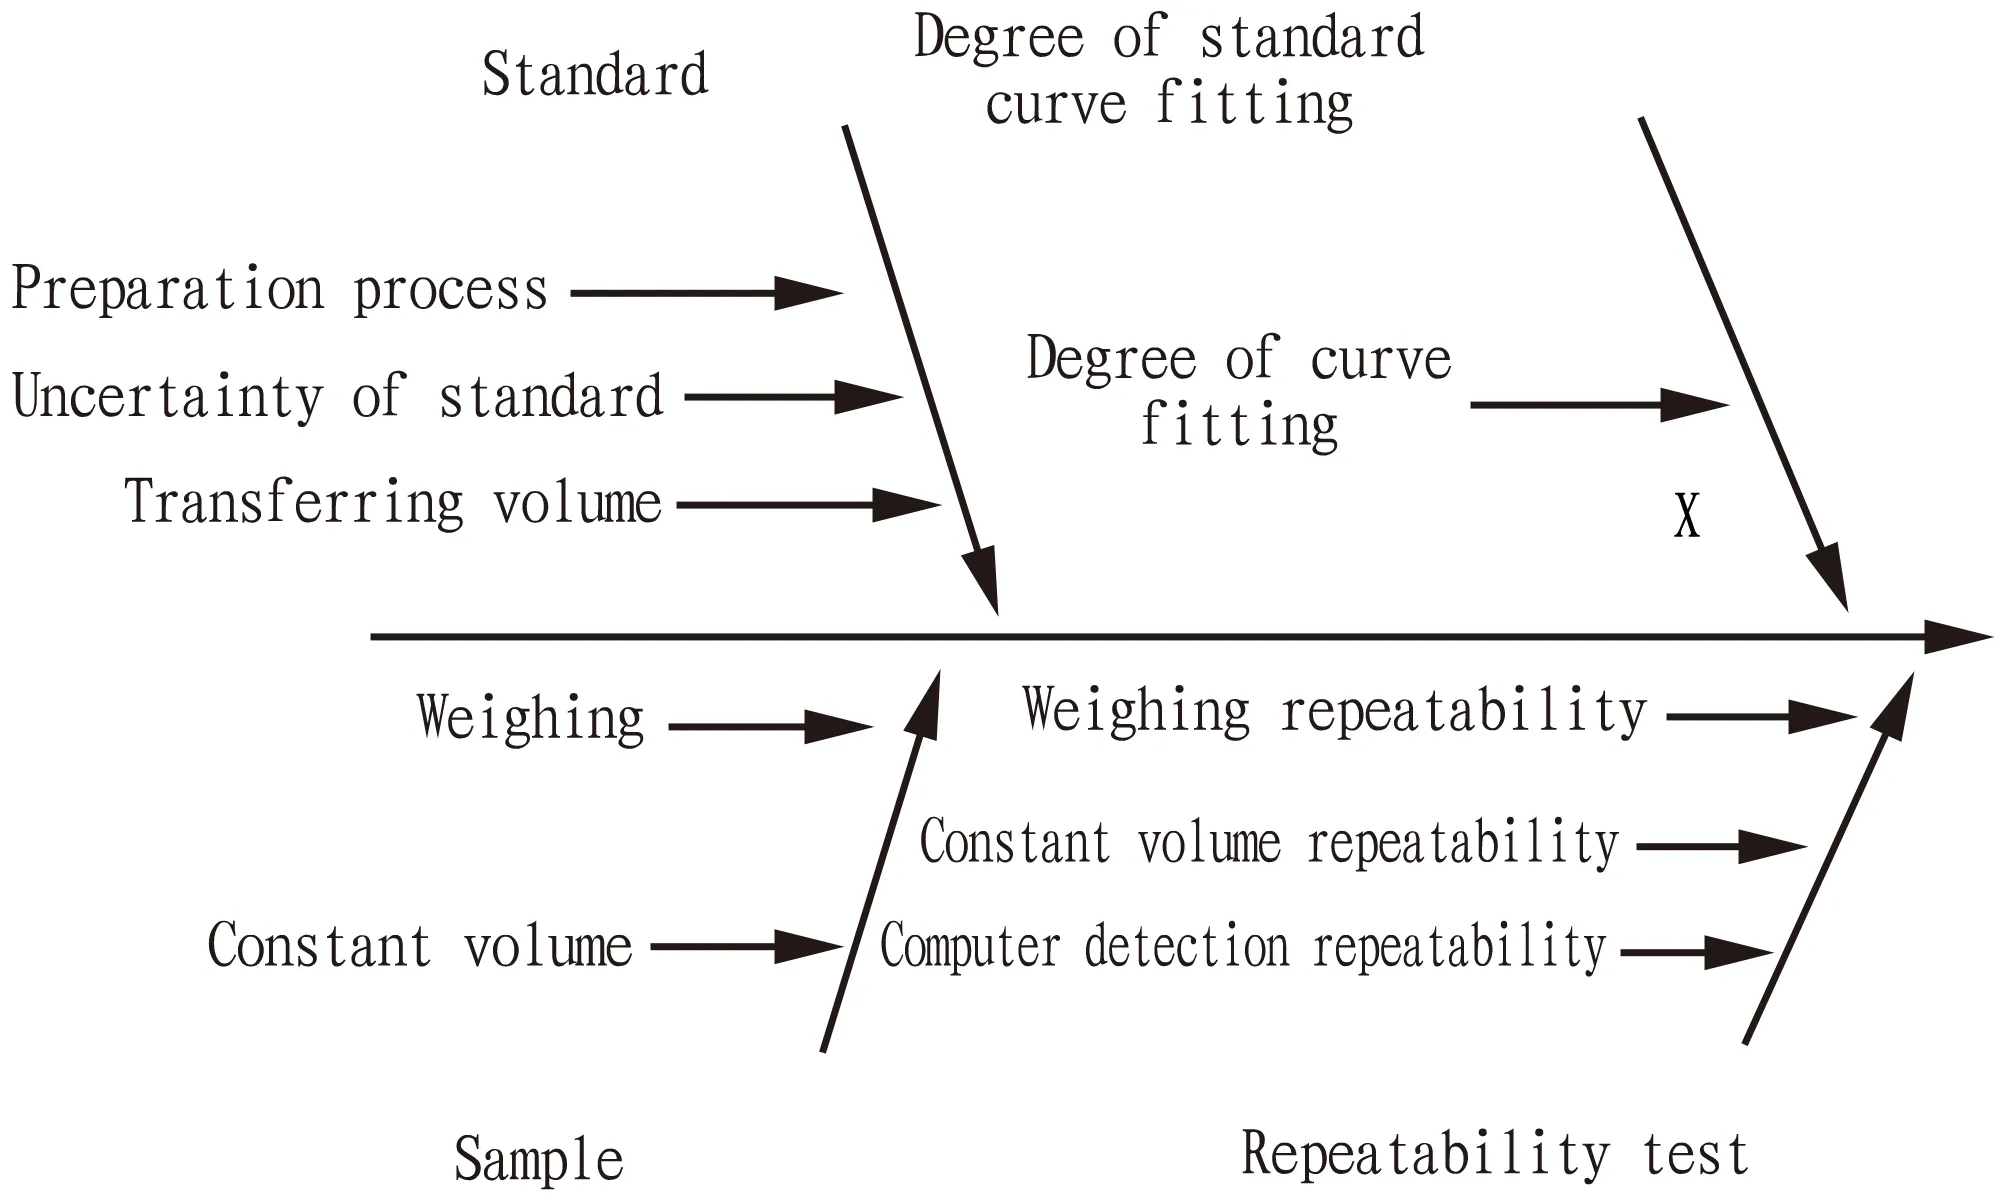
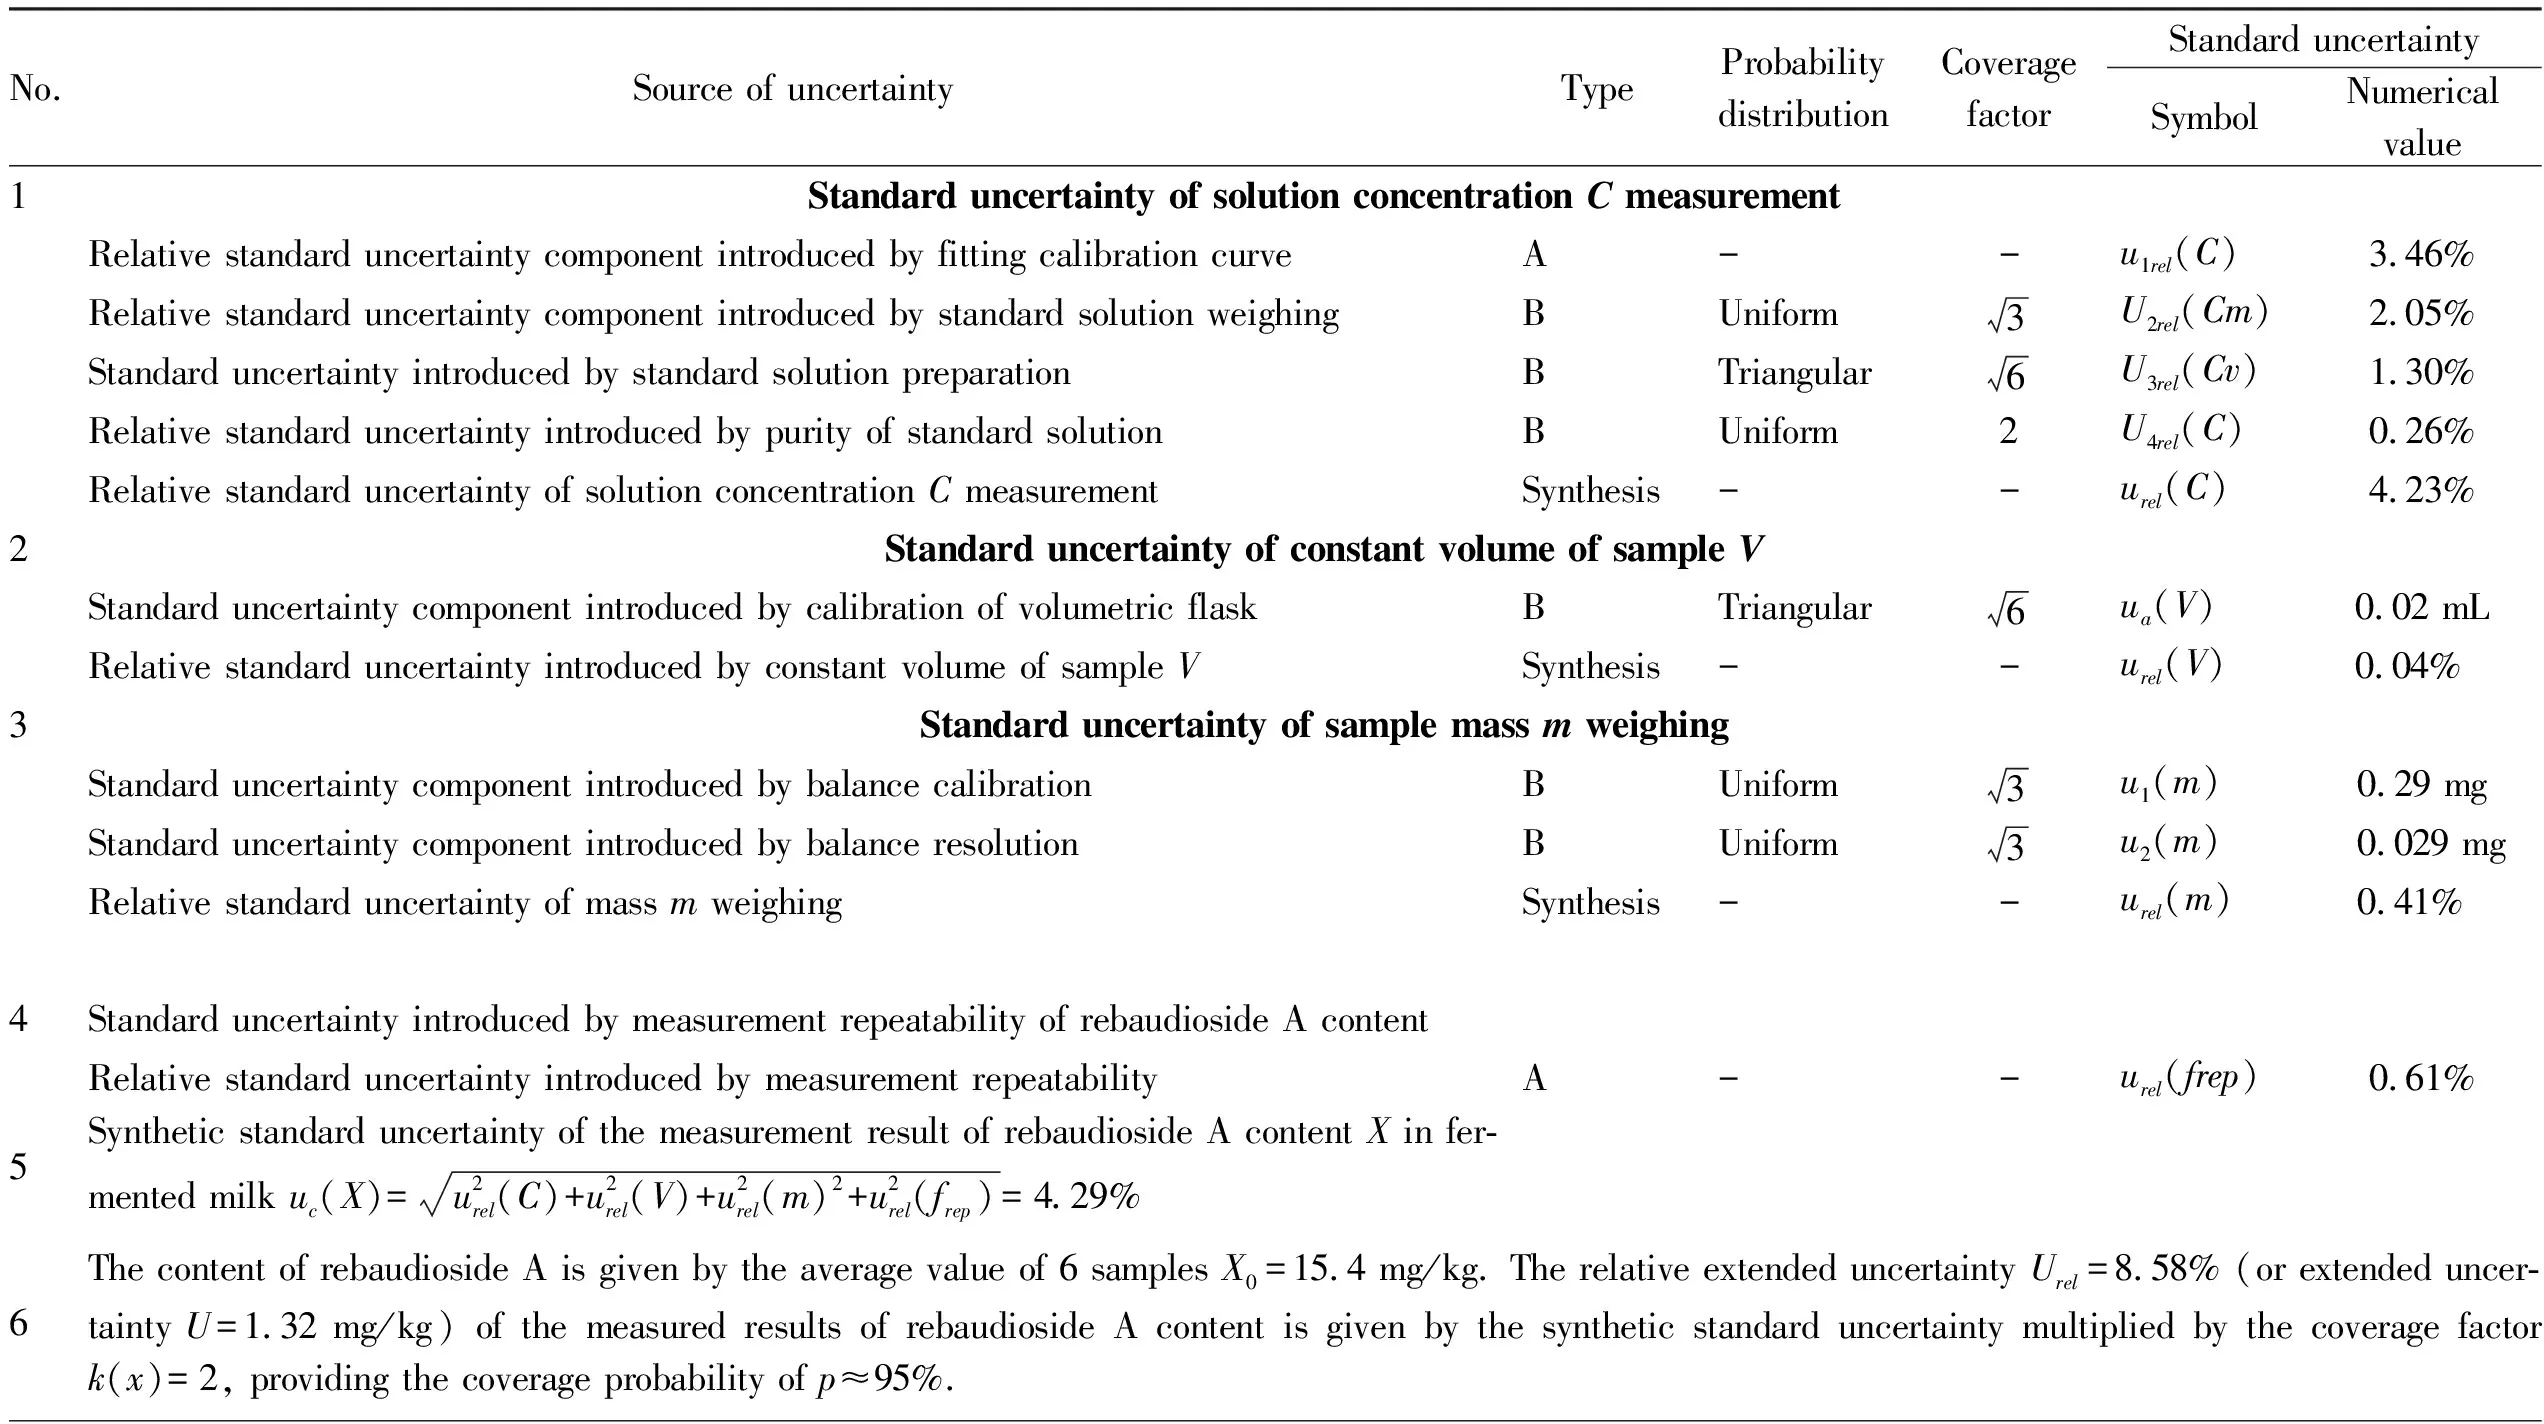
3.1 Sources of measurement uncertaintyTable 1 and Fig.1 show the sources of uncertainty and related information.The uncertainty of outputXcame from four aspects.

Fig.1 Fishbone chart of influencing factors of uncertainty

Table 1 Prediction of uncertainty for determination of rebaudioside A content X
3.1.1Standard uncertaintyu(C)introduced by solution concentrationCafter sample dissolution and constant volume.Standard uncertaintyu(C)introduced by solution concentrationCafter sample dissolution and constant volume included four sources: standard uncertainty introduced by least square fitting calibration curveu1rel(C); relative standard uncertainty introduced by standard solution weighingU2rel(Cm); standard uncertainty introduced by standard stock solution and working solution volume in standard solution preparation processU2rel(Cv); standard uncertainty introduced by standard solution concentrationu3rel(C).
3.1.2Standard uncertaintyu(V)introduced by sample volumeV.Standard uncertaintyu(V)introduced by sample volumeVincluded three sources: calibration, repeatability and temperature effect.Repeatability was classified into the repeatability of rebaudioside A contentu(frep).Since the laboratory was equipped with effective moisture and temperature control systems such as air supply and exhaust and ice water, the standard uncertainty introduced by temperature could be ignored, and only the standard uncertaintyu(V)introduced by calibration of pipette and constant volume flask was evaluated, namely the uncertainty component introduced by constant volume of the sample.
3.1.3Standard uncertaintyu(m)introduced by sample massmweighing.Because the massmcould not be measured directly, it was actually obtained by using the decrement method through two weighing, that is, by one reset weighing.The uncertainty of these measurements was derived from three sources: calibration, repeatability, and resolution, and repeatability was classified into the repeatability of rebaudioside A contentu(frep).Therefore, only the standard uncertainty introduced by calibration of analytical balanceu1(m)and that introduced by resolution of analytical balanceu2(m)were evaluated.Because the same balance was used to weigh within a narrow range, the sensitivity of balance mass difference could be negligible.
3.1.4Standard uncertainty introduced by measurement repeatability of rebaudioside A contentu(frep).
3.2 Evaluation of uncertainty
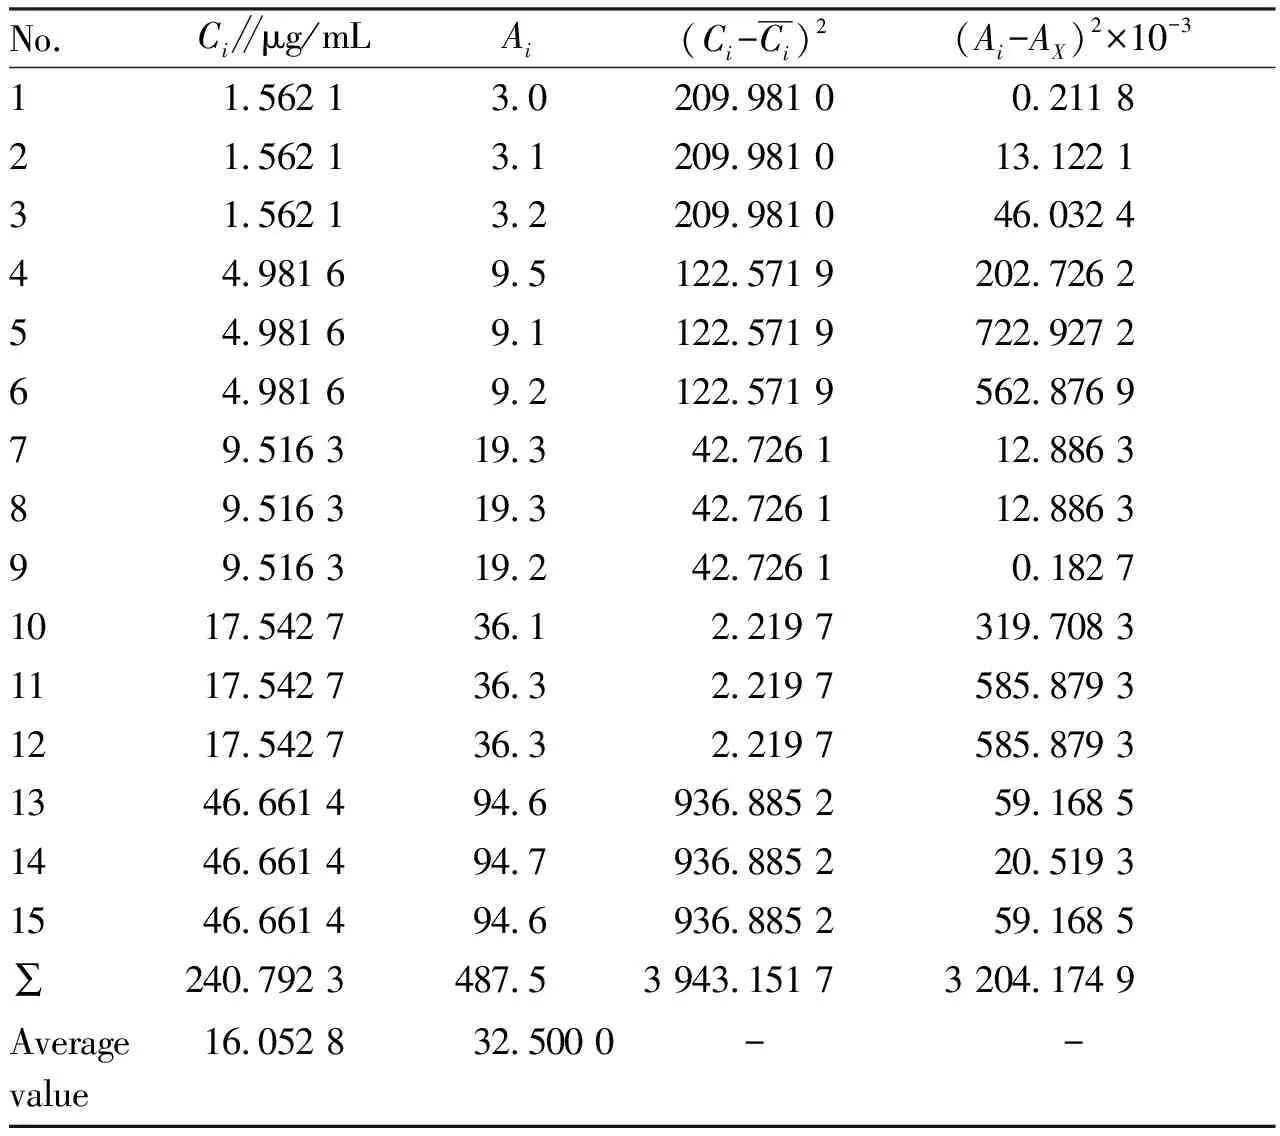
3.2.1Evaluation of standard uncertaintyu(C)for determination of solution concentrationCof rebaudioside A sample after constant volume.(i)Evaluation of relative standard uncertainty componentu1rel(C)of sample measurement introduced by fitting calibration curve.The experimental data of rebaudioside A are shown in Table 2.
The equation of calibration curve was:
Ai=2.036 8×Ci-0.196 2.
whereAiis the peak area of rebaudioside A;Ciis the concentration of rebaudioside A, and the correlation coefficient is 0.999 8.
Ai=aCi+b
(4)
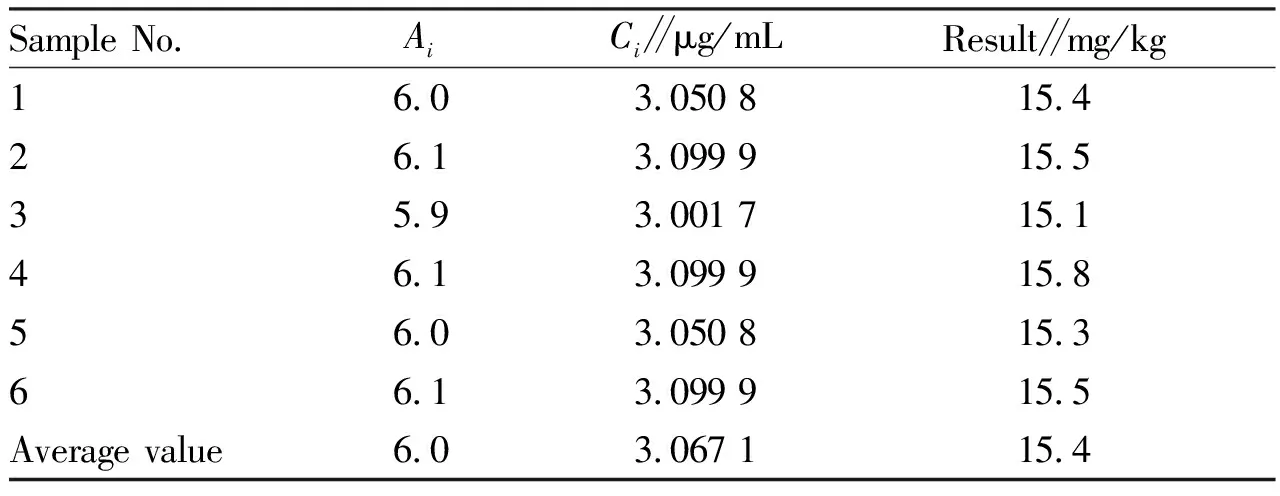
Six(m=6)parallel measurements were made on the sample, and the averageA0and average sample concentrationC0were obtained as follows:A0=6.0,C0=3.067 1 μg/mL(Table 3).

Table 2 Experimental data of rebaudioside A

Table 3 Independent repeated measurement results of the content of 6 samples

Table 4 Uncertainty introduced by calibration of pipette in quasi-solution preparation
The standard uncertainty componentu1(C)for determination of solution concentrationCintroduced by least square fitting calibration curve can be calculated.
The standard deviation of regression was:
(5)

=0.106 μg/mL
(6)
whereAxis the peak area calculated by formula(4)whenC=Ci;n=15 is the number of data pairs(Ci,Ai);m=6 is the number of parallel measurements of the sample.Therefore, relative standard uncertainty introduced by fitting calibration curve was:
u1rel(C)=u1(C)/C0=0.106/3.067 1=3.46%
(7)
(ii)Evaluation of relative standard uncertainty componentu2rel(C)introduced by preparation of standard solution.
Evaluation of relative standard uncertainty componentu2rel(Cm)introduced by standard solution weighing: Because the massmcould not be measured directly, it was actually obtained by using the decrement method through two weighing, that is, by one reset(empty flask)weighing.The uncertainty of these measurements was derived from three sources: calibration, repeatability, and resolution, and repeatability was classified into the repeatability of rebaudioside A contentu(frep).Therefore, only the standard uncertainty introduced by calibration of analytical balanceu1(m)and that introduced by resolution of analytical balanceu2(m)were evaluated.The sensitivity of balance mass difference could be negligible.

(8)

(9)
Therefore, the standard uncertainty introduced by electronic balance calibration was:

=0.29 mg
(10)
The mass of rebaudioside A standard was actually given by the decrement method through two measurements, so the relative standard uncertainty component ofmweighing was:
(11)
Evaluation of standard uncertaintyu2rel(Cv)introduced by calibration of pipette and volumetric flask in the preparation of standard curve:
The relative standard uncertainty of sample volumeVintroduced by calibration of volumetric flasks when preparing stock solution and constant volume of working solution(Table 4)was as follows.

Table 5 Independent repeated determination of rebaudioside A content in 6 samples

The relative standard uncertainty was:urel(V10)=0.020 4/50=0.040 8%.

The relative standard uncertainty was:urel(V10)=0.008 16/10=0.081 6%.
In the measurement process, the standard products used 50 mL volumetric flask once, 10 mL volumetric flasks 6 times, 200 μL pipette once, 1 000 μL(transferring 500 μL)pipette once, 1 000 μL(transferring 1 000 μL)pipette once, 5 000 μL(transferring 2 000 μL)pipette once, 5 000 μL(transferring 5 000 μL)pipette once.Therefore, the uncertainty was caused by the volume in the preparation process.
The uncertainty introduced by the volume of pipette was:

=1.28%
(12)
The uncertainty introduced by the volume of volumetric flask was:
(13)
The uncertainty of standards introduced by pipette and volumetric flask was:
(14)
(iii)Evaluation of relative standard uncertaintyu3rel(C)introduced by standard concentration.
According to the standard certificate of sodium hyaluronate, the extended uncertainty of sodium hyaluronate standard solution was 0.5%,k=2, purity of standard product 98%, and the relative standard uncertainty was:
u3rel(C)=0.5%/(98%×2)=0.26%
(15)
(iv)Evaluation of synthetic standard uncertaintyurel(C)of solution concentrationC:

=4.23%
(16)
3.2.2Standard uncertainty evaluation of sample volumeV.The standard uncertaintyu(V)of sample volumeVincluded two sources: calibration and repeatability effect.Repeatability was included infreprepeatability of rebaudioside A content, and only the standard uncertaintyu(V)introduced by calibration was assessed.

(17)
The relative standard uncertainty was:
urel(V)=0.020/50=0.04%
(18)
3.2.3Evaluation of standard uncertaintyu(m)introduced by sample massmweighing.Because the massmcould not be measured directly, it was actually obtained by using the decrement method through two weighing, that is, by one reset(empty flask)weighing.The uncertainty of these measurements was derived from three sources: calibration, repeatability, and resolution, and repeatability was classified into the repeatability of rebaudioside A contentu(frep).Therefore, only the standard uncertainty introduced by calibration of analytical balanceu1(m)and that introduced by resolution of analytical balanceu2(m)were evaluated.The sensitivity of balance mass difference could be negligible.

(19)

(20)
Evaluation of relative standard uncertainty componentu(m)introduced by sample massmweighing: The uncertainty componentsu1m(m)andu2m(m)were interrelated, and the synthetic standard uncertainty introduced by sample massmweighing was obtained by square and root method:

=0.29 mg
(21)
The sample massm=10.000 0 g=10 000 mg, which was actually obtained by subtracting two measurements using the decrement method, so the uncertainty componenturel(m)of sample massmweighing was:
(22)
3.2.4Six copies of samples were weighed, processed simultaneously, and tested under the same conditions.The analysis results were as follows.
The content of rebaudioside A in 6 samples was determined independently and repeatedly, and the average value of the measured results wasX0=15.4 mg/kg(Table 5).The standard deviation of a single measurement was calculated by using Bessel’s formula.
(23)
The relative standard uncertainty introduced by measurement repeatability of content was:
(24)
3.3 Evaluation of synthetic uncertainty and extended uncertainty
3.3.1Evaluation of relative synthetic standard uncertainty of outputs.The relative synthetic standard uncertainty of rebaudioside A content was calculated by formulae(16),(18),(22)and(24):

=4.29%
(25)
3.3.2Evaluation of extended standard uncertainty for determination of rebaudioside A content in fermented milk.Because of coverage factork(x)=2 and coverage probabilityp≈95 %, the relative extended uncertaintyUrelof the measurement results of rebaudioside A content in raw materials was:Urel=ucrel(X)×k(x)=4.29%×2=8.58%.
3.3.3Measurement results of rebaudioside A content and uncertainty report.The content of rebaudioside A was given by the average value of 6 samplesX0=15.4 mg/kg.The relative extended uncertaintyUrel=8.58%(or extended uncertaintyU=1.32 mg/kg)of the measured results of rebaudioside A content was given by the synthetic standard uncertainty multiplied by the coverage factork(x)=2, providing the coverage probability ofp≈95%.
4 Conclusions
There were four main sources of uncertainty in the analysis of stevioside content(rebaudioside A as an example).The above evaluation process showed that the standard uncertainty for determination of solution concentrationCwas the main source.It can be clearly seen from Table 1 that the relative standard uncertainty component introduced by fitting calibration curve and that introduced by standard solution weighing were the main sources of standard uncertainty for determination of solution concentrationC.Since the transferring volume of standard solution and the weighing sample of standard product were very small in the test, it was an effective means to control the uncertainty of this experiment by strictly controlling the preparation of standard solution and the weighing procedure of standard product, operating in accordance with the standard specification of weighing, and periodically calibrating balance and pipette.
杂志排行
Asian Agricultural Research的其它文章
- Research Status of Land Use and Carbon Emissions in China: A Visual Analysis Based on CiteSpace
- High-quality Development Evaluation System of Water Parks
- Recommendations for Using Crop Straws to Produce Organic Ferti-lizers in Liaoning Province
- Volatile Components and Antitumor Activity of Ganoderma lucidum Spore Oil and Its Molecular Distillation Components
- Technique for Ecological Pond Breeding of Charybdis japonica
- Extraction of Astragalus Polysaccharides and Ganoderma lucidum Mycelia Polysaccharides and Their in Vitro Antioxidative Effects
