Study on the refined classification method of mangrove tree species based on Sentinel-2 MSI images combined with object-oriented
2023-02-20ZHAOYangLIWeiweiTIANZhenXUEZhiyongZHUJianhua
ZHAO Yang,LI Weiwei,2,TIAN Zhen,2,XUE Zhiyong,2,ZHU Jianhua,2
1.National Ocean Technology Center,Tianjin 300112,China;
2.Key Laboratory of Ocean Observation Technology,MNR,Tianjin 300112,China
Abstract:Mangroves are one of the most typical coastal ecosystems,and the accurate identification of mangrove interspecies types is of great significance for the conservation, restoration and carbon stock assessment of mangrove ecosystems.Remote sensing is an effective means to identify mangrove interspecies types, but traditional remote sensing methods for mangrove classification are mostly based on image elements, and there is much room for improving the accuracy of the classification results.Therefore,based on Sentinel-2 MSI images,this study introduced image segmentation techniques on the basis of traditional remote sensing classification methods.Object-oriented Support Vector Machine (SVM) and Random Forest (RF)classification methods have been respectively constructed, and the classification accuracy and applicability of each model have been analyzed on this basis.(1) The introduction of image segmentation technology can effectively improve the "salt and pepper"phenomenon of classification results and enhance the recognition accuracy of mangrove interspecies types.The overall classification accuracy of SVM and RF classification algorithms based on image elements was 78.82% (Kappa=0.75) and 82.94% (Kappa=0.82), respectively.In contrast,the overall classification accuracy of object-oriented SVM and RF models was 81.5% (Kappa=0.78) and 92.67%(Kappa=0.88), respectively, representing an improvement of 2.68% and 7.43%compared to the image element-based models; (2) the RF algorithm outperformed the SVM algorithm in terms of overall classification accuracy, classification accuracy of each tree species, model stability, and applicability among the four models; (3)Dongzhaigang mangrove forest was classified into 6 categories, and using the object-oriented random forest classification, the highest precision was achieved for Lumnitzeraracemosa and Rhizophora stylosa, followed by Ceriops tagal,Kandeliaobovata, and Sonneratia apetala, and the lowest precision was 86.6% for Bruguierasexangula, while the precision of all 6 categories reached over 85%.In summary, the object-oriented use of the random forest classification algorithm to construct a classification model can accurately identify and classify different tree species in mangroves, providing theoretical and technical support for fine-scale interspecific mangrove classification.
Keywords: mangrove interspecies classification, multispectral, object-oriented,random forest
Mangroves are tidal flat wetland woody biological communities predominantly composed of evergreen shrubs or trees, primarily consisting of mangrove plants.They are distributed in the intertidal zone of tropical and subtropical regions or estuaries,where they are periodically flooded by tidal waters.Mangroves are a special ecological system in transition from land to sea, with both Marine and terrestrial characteristics.They play an irreplaceable role in wind and wave prevention,bank protection,offshore water purification and biodiversity protection[1-3].At the same time, mangroves are also an important part of"blue carbon" and have high carbon sequestration capacity[4], but the carbon sequestration capacity of different tree species is different, so the fine classification of mangroves is the first step in the assessment of their carbon sequestration capacity.
Because of the special living environment of mangroves, it is difficult for people to enter the mangroves for large-scale field survey and sampling.Remote sensing technology has been widely applied in mangrove research[5]due to its characteristics such as fast data collection and wide range, such as mapping distribution map[6], monitoring dynamic changes[7-9],and evaluating biological indicators[10,11].
At present, remote sensing is used to classify units including image element and object[12].Pixel based classification takes a single pixel as the minimum unit, and only takes into account the spectrum,size and location information of ground objects[13]during classification.However, this classification method will produce the phenomenon of “salt and pepper “,which restricting the accuracy of classification.Object-oriented classification takes into account various features such as geometric shape, spatial relationship, and texture of the images, effectively avoiding the "salt and pepper" phenomenon in the classification results,which also improving the classification speed and reducing the loss of equipment.Numerous studies have shown that its classification accuracy is higher than that of traditional pixel classification, and it is widely used in high-resolution images classification and ground object extraction[15,16].However, there are few applications in medium resolution classification and recognition of ground objects.Sentinel-2 data has been widely used in the research of land use classification and surface feature extraction due to its advantages of free and easy access, excellent data, good temporal resolution,and spectral resolution.Therefore, object-oriented mangrove interspecific classification based on Sentinel-2 data has certain research significance.
The selection of object-oriented segmentation scale parameters directly determines the size of homogeneous object patches.In terms of parameter setting,if the segmentation scale is too large, the number of objects obtained by segmentation will be less, and it is easy to divide different types of ground objects into a homogeneous object, reducing the classification accuracy, and the category of ground objects is in the state of "underfitting".Conversely,the smaller the segmentation scale is,the ground objects will be in the state of"overfitting".Therefore, it is worth studying to select the optimal segmentation scale to improve the precision of mangrove interspecific fine classification.
At the same time, a variety of machine learning algorithms have also been widely used in the classification of ground objects, among which support vector machine classification has a high accuracy in vegetation classification.For example, Li et al.[17]adopted SVM classifier to identify tree species in the natural forest area of Wangqing Forestry Bureau in Jilin Province, and the classification accuracy reached 89.58%.The random forest classification method also has high classification accuracy in vegetation classification and has the advantages of fast data processing.For example, Liu et al.[18]used RF algorithm to classify tree species in the Bamian Forest Bureau with the help of Gaofen-No.1 WFV image,and the classification accuracy reached the highest 83.97%.
Therefore, Sentinel-2 medium resolution satellite images were used in this study to conduct fine classification of mangroves in the Dongzhaigang State-level Nature Protection Area based on image element and object-oriented support vector machine and random forest classification algorithm respectively.The main research contents include spectral sensitive factor screening, object-oriented optimal segmentation scale optimization and fine classification model construction.
1 Study area and data source
1.1 Overview of the study area
The Dongzhaigang State-level Nature Protection Area is located in the northeast of Hainan Province, at the junction of Haikou City and Wenchang City.Its geographical coordinate is 110°32 '-110°37' E, 19°51 '-20°1' N, which is a wetland type nature reserve.The region has a tropical monsoon climate,with an average annual temperature of 23.8 ˚C(28.4 ˚C in July and 17.1 ˚C in January), an annual rainfall of 1 700 mm and frequent typhoons in the rainy season.The highest sea temperature is 32.6 ˚C,the lowest is 14.6 ˚C,and the average is 24.5 ˚C.The area of the mangrove reserve in Dongzhaigang is 3 337.3 hm2,among which the area of mangrove is 1 576.24 hm2, which is the mangrove wetland with the most complete ecosystem and the richest biodiversity in China[19].There are 17 species of mangrove plants, among which Bruguierasexangula, Lumnitzera racemose,Ceriops tagal and Rhizophora stylosa are the dominant species.About 80% of the total area of the reserve.Before conducting interspecific classification,this study combined field observation and remote sensing image interpretation to map the mangrove range, as shown in Fig.1.

Fig.1 Sentinel-2 true color images of geographical locations in the study area
1.2 Satellite data acquisition and preprocessing
Sentinel-2A[20],a medium resolution Multi-spectral imaging satellite,was launched by the European Space Agency(ESA) on June 23, 2015.The satellite equipped with the Multi-Spectral Imager(MSI) that includes a total of 13 bands(as shown in Tab.1), covering from visible light to short-wave infrared,and the spatial resolution of Sentinel-2A is up to 10 m.The spatial resolution and band spectral characteristics of Sentinel-2 are shown in Tab.1.The imaging time of the data used was December 3,2021.On the day of data acquisition,there were no(less) clouds, and the vegetation was in the flourishing period.According to the characteristics of remote sensing data, the multi-spectral image is preprocessed on the basis of image quality control,including:cloud removal,clipping,resampling,etc.,to obtain a better quality image, which provides a strong guarantee for sample selection and classification processing in the later period.

Tab.1 Sentinel-2 band characteristics
1.3 Field observation and sample data collection
In this study, 300 mangrove sample points were obtained from field observations,which could be divided into 6 categories,namely,Rhizophora stylosa,Bruguierasexangula,Ceriops tagal, Lumnitzera racemose, Kandeliaobovata and Sonneratia apetala.The selected samples were randomly divided into training samples and verification samples according to a ratio of 7:3,as shown in Tab.2.

Tab.2 Sample points for field observation
In the process of sample collection, handheld GPS was used to record the type and location information of sample points.By matching the spatial position information of each sample point with Sentinel-2 image, spectral information of each sample point was extracted and the average spectral reflectance of each mangrove tree species was drawn,as shown in Fig.2.It can be found that the curves of different mangrove tree species have very similar general shapes with considerable overlap.The big difference is mainly in the red-edge band and near-infrared band,and the red-edge band can identify the fine spectral characteristics of different tree species.

Fig.2 Average spectral reflectance of each mangrove tree species
2 Method
In this study, Sentinel-2 images were used to classify mangrove species based on pixels and object-oriented.The research process mainly includes four steps as shown in Fig.3: (1) spectral sensitive factor screening; (2) Optimization of segmentation scale; (3)Classification model construction and mangrove interspecific classification; (4) Precision verification and comparison.
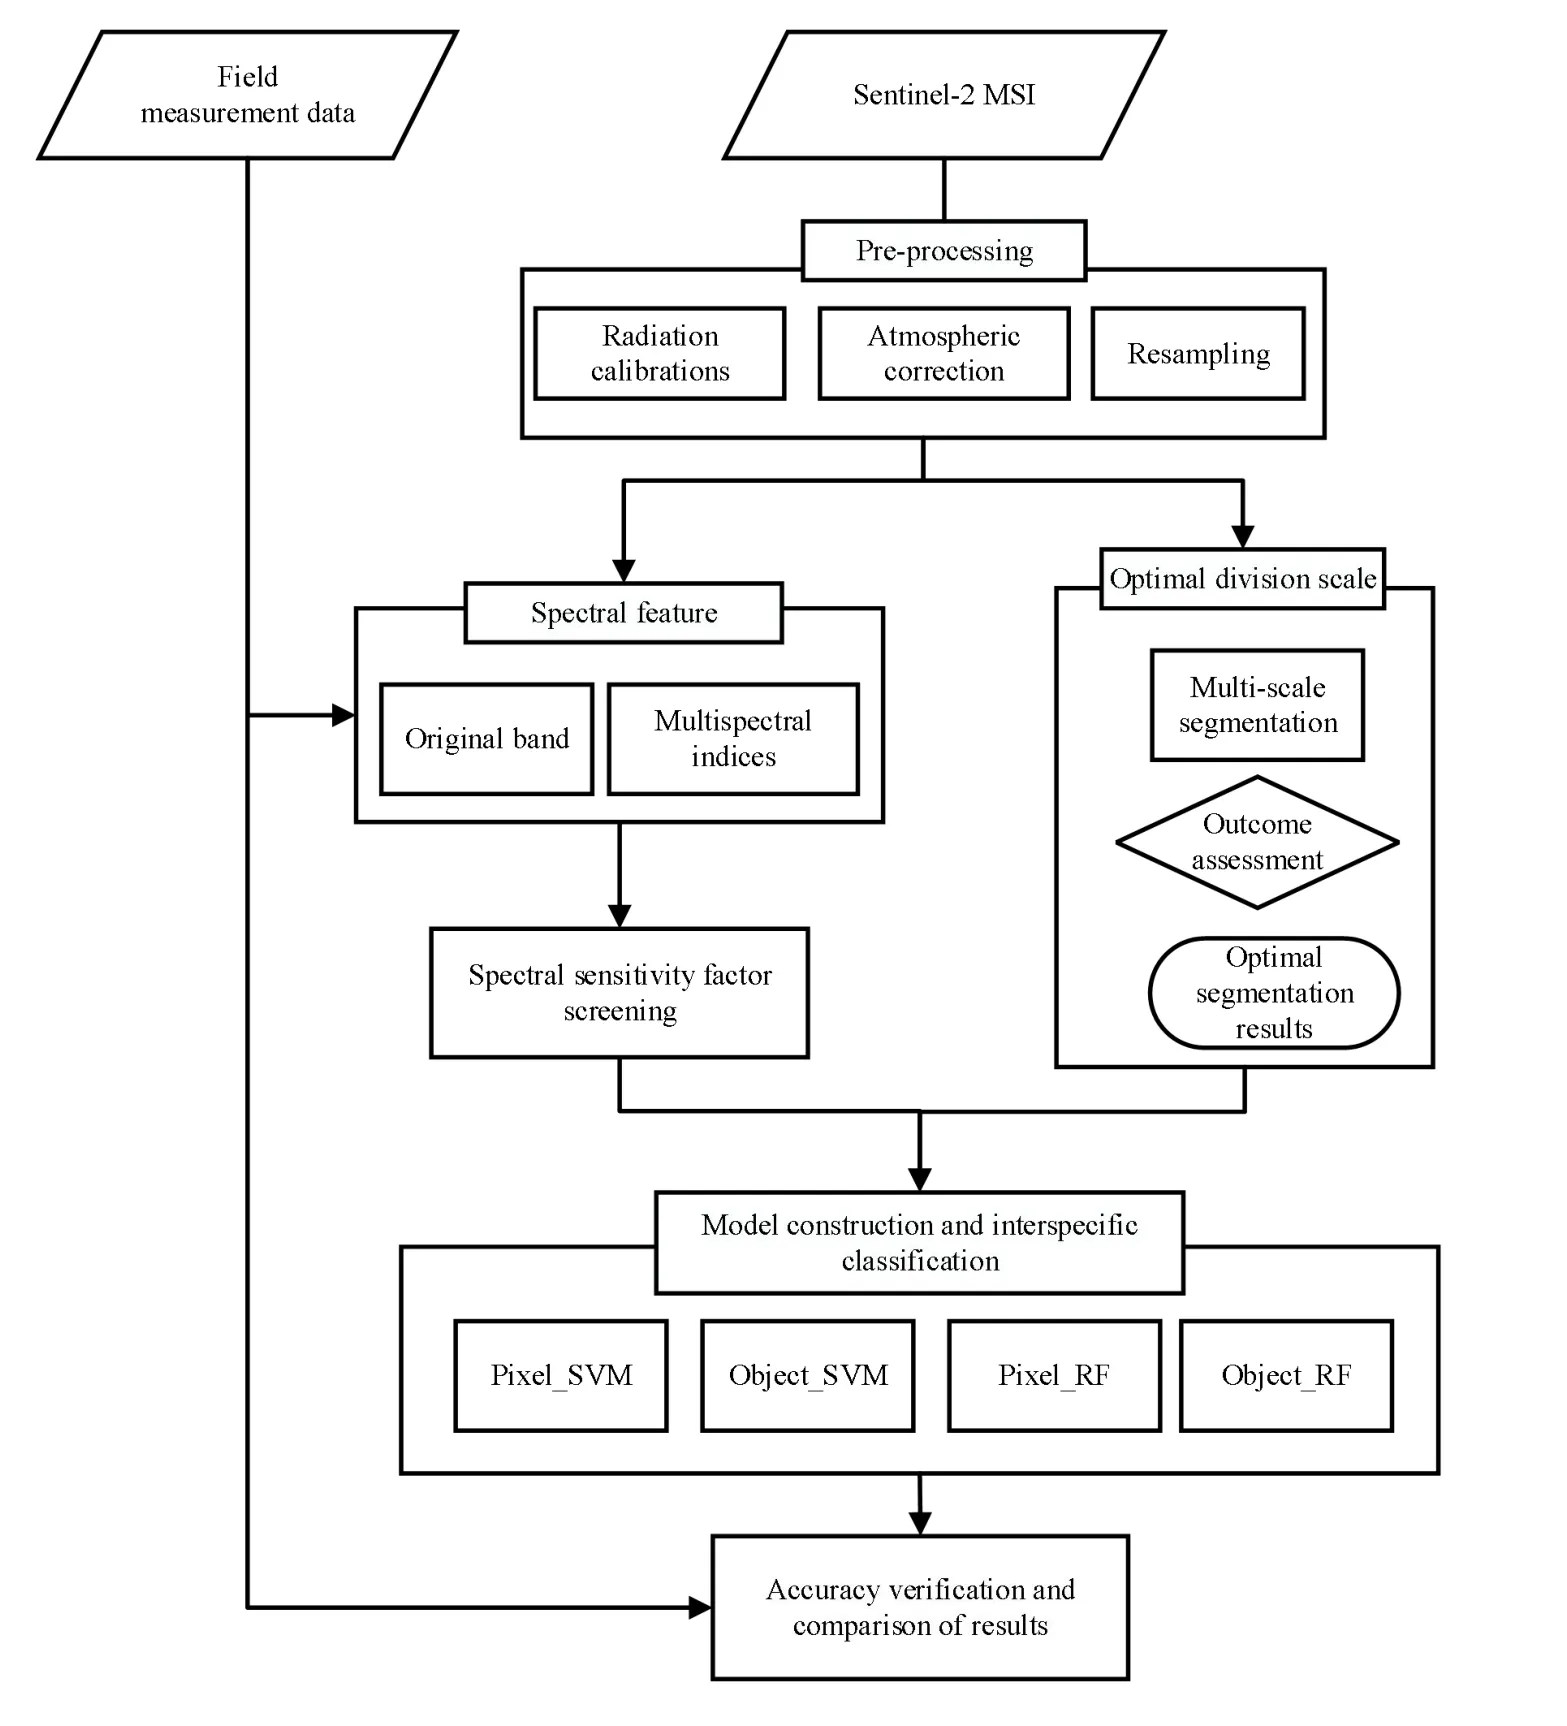
Fig.3 Research technology roadmap
2.1 Spectral sensitive factor screening
Image feature extraction is an important prerequisite for image classification,and the quality of feature extraction determines the effect of image classification.In this study, a variety of spectral characteristic indices were extracted, but not all indices were applicable to mangrove interspecific classification, and redundant information would affect the efficiency and accuracy of classification.Therefore, the stepwise discriminant analysis method is used to screen the extracted spectral characteristic indices.This method quantitatively selects the sensitive features of the mangrove community from the information entropy aspect of the image features, gradually introduces variables,introducing one "most important" variable each time, and also tests the previously introduced variables.If the discriminant ability of the previously introduced variable does not change significantly with the newly introduced variable, it will be removed from the discriminant formula in time[21,22], and the corresponding statistical test will be carried out for each introduced or removed variable.Finally, only a small number of variables with strong discriminant ability will be retained in the discriminant function.Thus, the set of the most significant features can be obtained by discriminant analysis.
2.2 Optimal segmentation scale selection
Image segmentation is the first step of object-oriented analysis, which divides the image into spatially continuous and spectral homogenous units to achieve the purpose of matching the classification objective[23].The multi-scale segmentation method is used in this study.Multi-scale segmentation is a bottom-up segmentation technique,which aims to minimize the internal heterogeneity of image objects after segmentation.
After segmentation, the results should be evaluated to select the optimal segmentation scale.The optimal scale can make the segmentation of the object complete on the condition of ensuring the internal uniformity of the object[24].This study firstly calculates local variance(LV) of the homogeneity of the image object under different segmentation scale parameters, and uses the calculated results as the mean standard deviation of the segmentation object layer to determine whether the segmentation effect is the best.In addition, rates of change of LV(ROCLV) are used to indicate the optimal scale parameter of object segmentation.When the change rate of LV is the highest, that is, the peak value, the corresponding segmentation scale value of this point is the optimal segmentation scale.LV and ROCLVare calculated as follows:
whereCLis the brightness value of a single image in the L-th band;Lfor the brightness of the image all the objects in the L-th band average;mis the total number of image objects;LV(L-1)is the local variance of the next layer using the target layer L as the base.Generally speaking, there is not only one optimal segmentation scale calculated, which is because several optimal segmentation scales are obtained for different mangrove tree species in the image.Therefore,for each local optimal scale,the mean value of coefficient of variation (CV) of all blocks under this scale is calculated again to measure block uniformity.
In the formula,σis the standard deviation of spectral reflectance within the segmented block, andμis the mean spectral reflectance of the band in the segmented block.
2.3 Classification method
Two kinds of classification algorithms are involved in this study, namely Random Forest(RF) classification algorithm and Support Vector Machines(SVM) classification algorithm.Random Forest is a kind of machine learning algorithm with multiple decision trees as its basic learning unit.Bagging method is used to generate independent training sample sets of the same distribution for each decision tree, and the final classification result depends on the voting of all decision trees.The sample set and 30 exponential features are input into the random forest classification model.Theoretically,the higher the number of decision trees N, the higher the classification accuracy,and the higher the time cost.Therefore, the number of decision trees generated is selected as 100, and other parameters are default.
Support Vector Machine(SVM) is a statistics-based, parameterless supervised classification algorithm developed by Vapnik, which is well suited to solving nonlinear,high-dimensional space classification and has been widely used in multi-spectral image classification[25].The learning strategy of SVM algorithm is to find the optimal hyperplane in the feature space to minimize the intra-class interval and maximize the inter-class interval.In principle, Support Vector Machine mainly aims at the problem of two types of training samples.With the continuous upgrading of user requirements, SVM is gradually extended from only applicable to binary classification problems to multi-classification,so as to realize multi-class classification[26].In this study, the convergence decision of parameters that need to be adjusted in the training process of the SVM algorithm is calibrated as 0.000 01,and the maximum number of iterations is positioned as 100.
3 Result and analysis
3.1 Screening results of sensitive factors
In this study, four spectral characteristic indices were extracted based on Sentinel-2 remote sensing images,including 30 original band,red-edge indices,near-infrared indices and short-wavelength infrared indices.The categories and expressions of each spectral indices are shown in Tab.3.
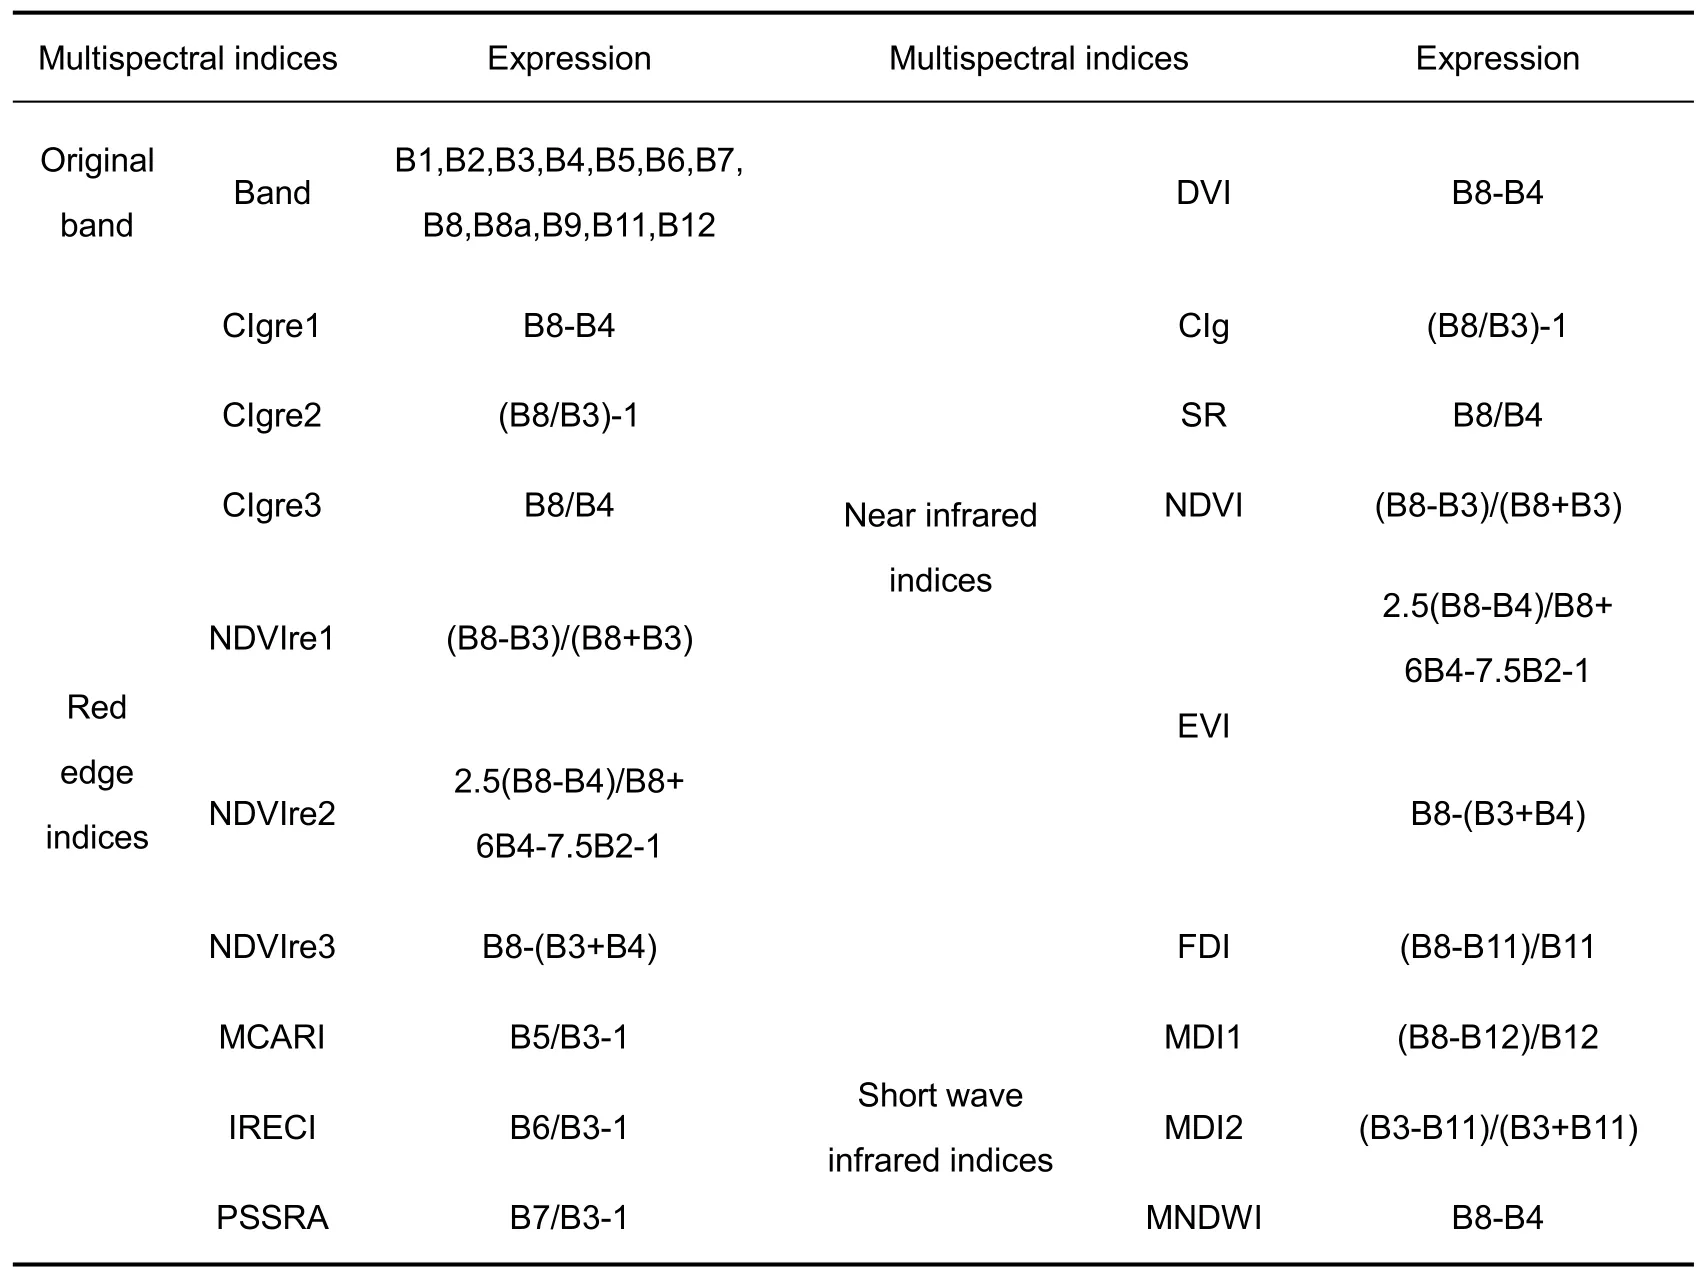
Tab.3 Spectral characteristic indices
Then, stepwise discriminant analysis method was used to screen the extracted spectral features.In the discriminant process, F test was carried out on the variables according to Wilks criterion,and its F value was calculated.The variable with the maximum value of F is introduced in each step in the screening process.In the next screening process,if the value of F introduced in the previous step is still advantageous,the variable is retained.In this study,the value of each spectral factor F is firstly calculated.In the first step,B11 factor value is the largest,and B11 factor value is introduced.In the second step,B11 factor still maintains the largest advantage, followed by MDI1 factor F value, so MDI1 is introduced, and so on.They are B11, B1, B8, MDI1, MDI2, IRECI and NDVIre1 respectively.Other characteristic variables are discarded.The screening process and results are shown in Fig.4.
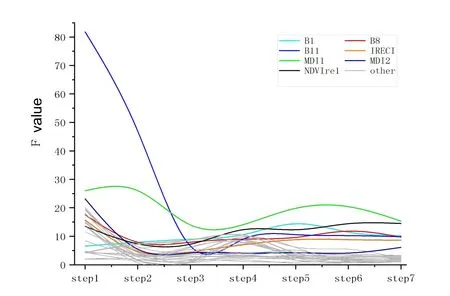
Fig.4 Screening process and results of spectral sensitive factors
3.2 Image segmentation and optimal segmentation scale selection
In this study, Sentinel-2 remote sensing images were segmented.Firstly, a series of interactive "trial and error" tests were applied to determine the appropriate segmentation scale.The results showed that when the segmentation scale was above 70, the segmentation results were too sparse and not suitable for the classification of any ground objects in the study area.Since the spatial resolution of the satellite image is 10 m, the canopy shape cannot be directly divided through the image, and the shape parameter has little influence on its classification.The shape factor and compactness factor are determined to be 0.1 and 0.3, respectively, through experiments.The value range of segmentation scale parameters was set to be 0-70, and the step size was set to be 1 for segmentation.The ROCLVcurve under each segmentation scale was calculated,as shown in Fig.5.
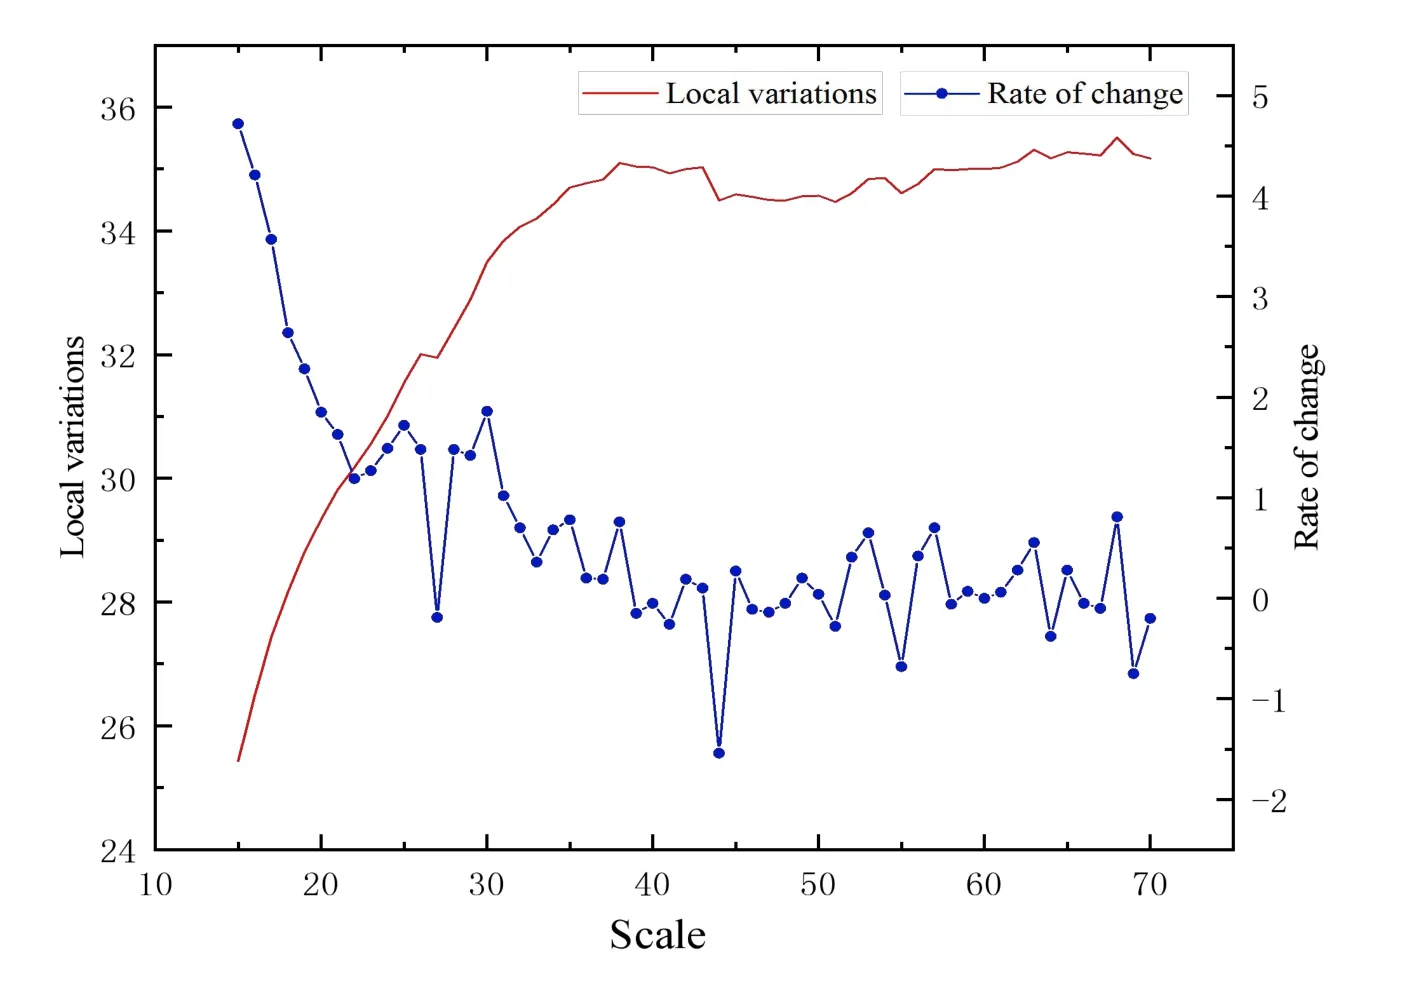
Fig.5 Multi-scale segmentation ROCLV curve(Shape factor 0.1,compactness 0.3)
The calculation results have several local optimal segmentation scales, and it is necessary to select the local optimal scale which is more suitable for interspecies type classification.Then, the coefficient of variation(CV) of all blocks corresponding to each locally optimal scale was calculated to characterize the uniformity within each block.The calculated results are shown in Fig.6.
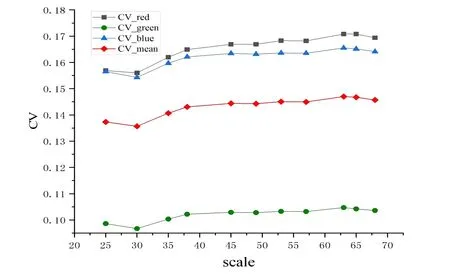
Fig.6 Block variation coefficient
The smaller the coefficient of variation, the better the uniformity within the block and the better the segmentation effect.It can be seen from the calculation results that when the segmentation scale is 30,the uniformity within the block is the best.Therefore,the optimal segmentation scale is set as 30, the shape factor as 0.1, and the compactness factor as 0.3.According to the three parameters determined, the image segmentation results are shown in Fig.7.

Fig.7 Segmentation image and key region segmentation results
3.3 Object-oriented mangrove classification results
In order to further evaluate the accuracy of the newly constructed object-oriented classification model and select the classification method most suitable for mangrove interspecies type recognition, this study constructed four different types of classification models according to different combination methods based on two taxonomic units and classification methods, namely, image element and object-oriented taxonomic units, SVM and RF classification algorithms.The combination forms and abbreviations of each model are shown in Tab.4.

Tab.4 Model building group details
The above four models were used to conduct a classification experiment of mangrove tree species in the study area.The overall classification results are shown in Fig.8.It can be seen from the figure that the results of the four combination methods are basically the same: in the northern part of the study area, the Rhizophora stylosa and Ceriops tagal were the main species, while in the southern part, the Bruguierasexangula was the main species.The overall accuracy and Kappa coefficient results of the four combinations are shown in Fig.9.The differences between the two types of classification methods are as follows: (a) "salt and pepper" phenomenon: Pixel_SVM and Pixel_RF show obvious "salt and pepper" phenomenon, and RF classification algorithm shows more serious "salt and pepper" phenomenon, which requires further classification post-processing; Based on object-oriented classification, Object_SVM and Object_RF have almost no broken spots,that is, no "salt and pepper" phenomenon, as shown in Fig.8.(b) Classification accuracy:the overall accuracy of object-oriented classification is better than that of the same classification method based on pixels.When SVM algorithm is used, the accuracy of classification is 78.82% and 81.5%,an increase of 2.68%; when RF algorithm is used, the accuracy is 84.94%and 92.67%,an increase of 7.73%.
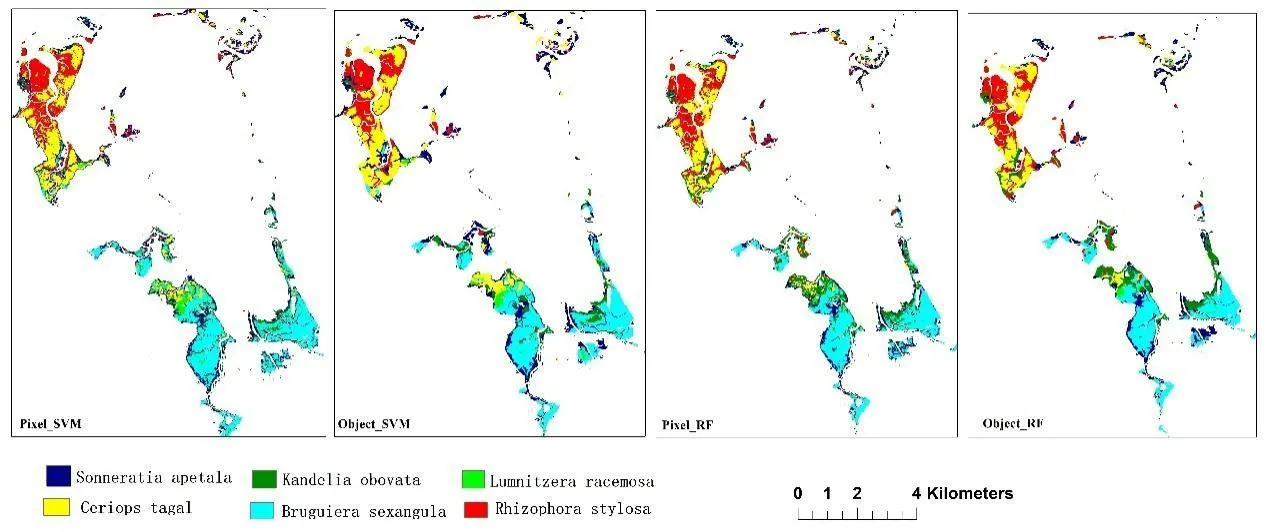
Fig.8 Results of mangrove interspecific classification in Dongzhaigang
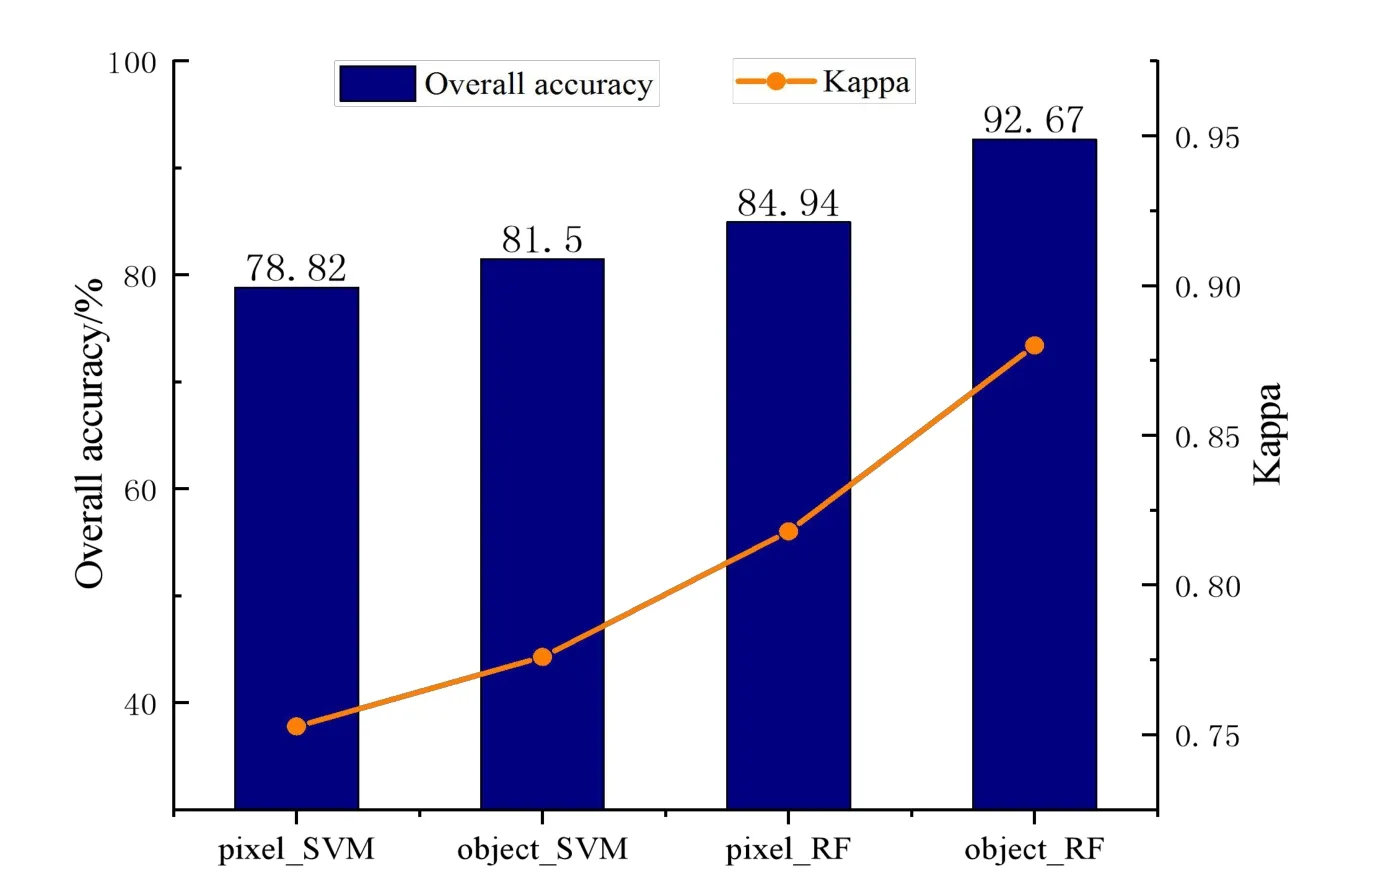
Fig.9 Classification overall accuracy and Kappa coefficient results
In order to more clearly compare the classification results of mangrove species based on different classification models, two key areas with obvious tree species distribution characteristics were selected according to the distribution of mangroves in the Dongzhaigang State-level Nature Protection Area, as shown in Figure 7.The classification results of the two key regions are shown in Fig.10.
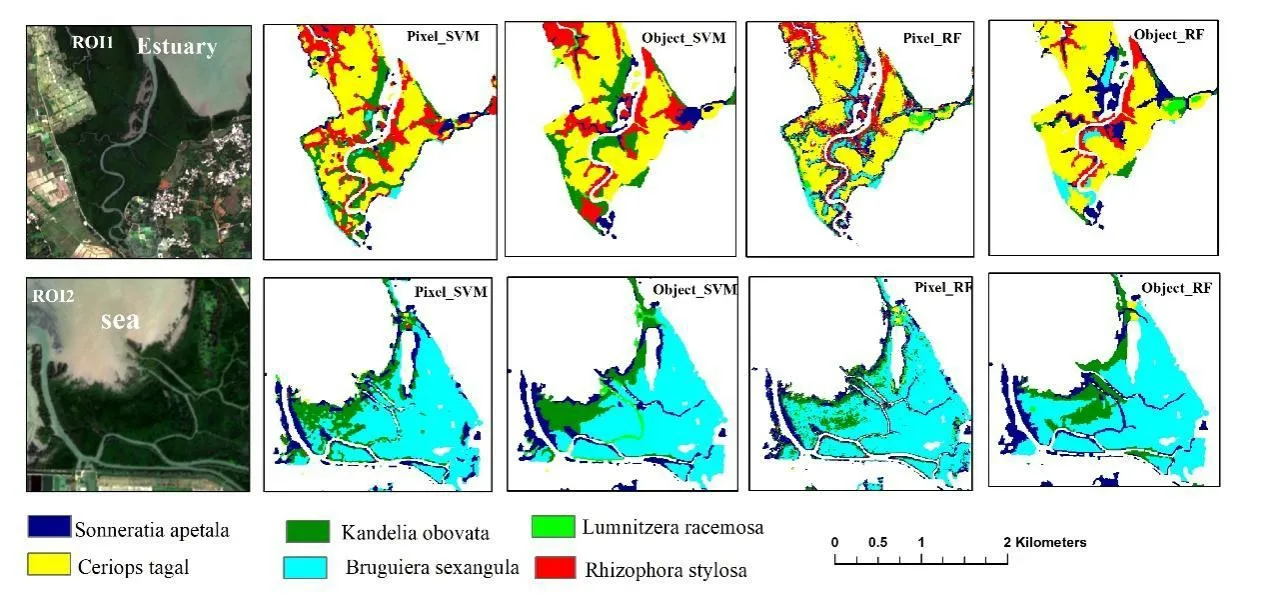
Fig.10 Classification results of each model in key areas
In key area 1(ROI1),by observing the right bank of the estuary,the four classification maps all showed banded Rhizophora stylosa, which was consistent with the field observation results.On the left bank of estuary, Support Vector Machine classification method(Pixel_SVM and Object_SVM) can show that the distribution is mainly Kandeliaobovata, while Random Forest classification method(Pixel_RF and Object_RF)can show that the distribution is mainly Bruguierasexangula and Sonneratia apetala.The results of Pixel_RF and Object_RF classification are consistent with the fact.
In key Region 2(ROI2), the four classification all show that the main tree types areBruguierasexangula, Sonneratia apetala, and Kandeliaobovata.Main advantage tree species for Bruguierasexangula, Sonneratia apetala distribution in the coastal area of the left side of the river, Kandeliaobovata are mainly distributed in the upper left on the direction, combined with the field observation, it was found that Pixel RF model had too little recognition of kandeliaobovata.
The above comparison shows that object-oriented classification is superior to pixel-based classification in both "salt and pepper" phenomenon and classification accuracy.In order to better study the applicability of Support Vector Machine and Random Forest algorithms to the classification of different mangrove tree species, this study calculates the user accuracy and producer accuracy of each tree species under the classification results of Object_SVM and Object_RF, as shown in Tab.5.The user accuracy of each species was used to represent its classification accuracy.As can be seen from the Tab.5, the accuracy of the two classification algorithms is equivalent to that of Sonneratia apetala.In terms of Kandeliaobovata, the RF algorithm was 49.48% higher than the SVM algorithm,which was consistent with the classification results of the left side of the estuary in key region 1 above.In the case of Lumnitzera racemose andRhizophora stylosa, both classification algorithms reached 100%.The RF algorithm was 2.57% higher than the SVM algorithm.As far as Bruguierasexangula is concerned, RF algorithm is 19.41% higher than SVM algorithm.In conclusion, the classification accuracy of Sonneratia apetala, Lumnitzera racemose and Rhizophora stylosa is similar.The RF classification accuracy of Kandeliaobovata, Ceriops tagal and Bruguierasexangula was higher than that of SVM classification,and the RF algorithm was particularly advantageous for Kandeliaobovata.Therefore, RF algorithm is more applicable in mangrove interspecific classification and can identify different mangrove tree species more accurately.

Tab.5 Confusion matrix of classification results
4 Conclusion and prospect
4.1 Conclusion
In this paper, Sentinel-2 MSI image was used as data source, two classification objects based on image element and object-oriented,two classification methods,SVM and RF, were selected respectively,and four classification models were constructed according to different combination methods, and the refined classification method of mangrove tree species was carried out in the Dongzhaigang State-level Nature Protection Area.The research mainly includes three parts:screening of sensitive factors,determination of image segmentation scale,and evaluation of application effect of different classification models in mangrove interspecific classification.Based on the qualitative and quantitative analysis of these experiments, the following conclusions can be drawn: (1) The addition of image segmentation technology can effectively improve the"salt and pepper"phenomenon of the classification results and improve the recognition accuracy of mangrove interspecific types.Compared with the model with pixel as the classification object, the overall classification accuracy of object-oriented SVM and RF model is improved by 2.68% and 7.43%,respectively.(2) RF was more suitable for mangrove interspecific classification than SVM.The classification accuracy of the two object-oriented classification algorithms was 81.5%(Kappa=0.78) and 92.67% (Kappa=0.88), respectively.(3) The results of object-oriented Random Forest classification showed that the user accuracy of the six tree species was the highest in Lumnitzera racemose and Rhizophora stylosa, followed by Ceriops tagal,Kandeliaobovata and Sonneratia apetala, and the user accuracy of Bruguierasexangula was the lowest 86.6%,and the user accuracy of the six tree species was above 85%.
4.2 Prospect
Although this research has made some achievements, limited by time and my knowledge,there are still some shortcomings to be improved:
(1)Due to environmental factors,the sample points selected for field observation are relatively concentrated and the sample number is not large enough,which also leads to the lack of model training and accuracy verification.In the follow-up study, we will further increase the number of ground object samples and optimize the model with the aid of high-resolution images such as UAV.
(2)The only classifiers selected in this paper are RF and SVM.A wide variety of deep learning models have emerged in recent years,and the deep learning classification model will be added in the subsequent research.
(3) In subsequent studies, remote sensing images of different phases will be added,and the established model will be used to analyze mangrove dynamic changes.
Acknowledgement
This paper was supported by the fund of Provincial and Ministerial Key Laboratory(No.G6210QT01).
杂志排行

Marine Science Bulletin的其它文章
- Sea level change and vertical land motion along Ny-Alesund coast in Arctic
- Study on motion characteristics of Nioghalvfjerdsfjorden
- Research and application of environmental risk assessment model for marine mobile risk sources
- Establishment and analysis of GNSS coordinate time series noise model for coastal tide stations in China
- Practice of marine data sharing:a case study of online sharing for marine data in private network environment