Sea level change and vertical land motion along Ny-Alesund coast in Arctic
2023-02-20JINBowenWANGHuiZHANGJianliLIHuanLIUQiulin
JIN Bowen,WANG Hui,ZHANG Jianli,LI Huan,LIU Qiulin
National Marine Data and Information Service,Tianjin 300171,China
Abstract: Objectives: Global warming has become a significant climate change in the past 100 years.And the global mean sea level continues rising caused by the thermal expansion of sea water and the melting of land-based glacier and polar ice.The Ny-Alesund area in Arctic has preserved a typical primitive polar ecosystem.The objective and accurate analysis of sea level change in this area can better provide a basis for monitoring and protection of natural ecological environment, and for the research of climate change.Methods:This paper analyzed the liner trend and seasonal variation of sea level change by using data of satellite altimeter,tide gauge station and global navigation satellite system (GNSS) along Ny-Alesund coast from 1993 to 2018.Results:The observation data at tide gauge station show that the rate of crust rise is(8.09±0.19)mm/a,and the rate of relative sea level decline is(-7.31±0.36)mm/a.So the rate of absolute sea level rise is (0.78±0.41) mm/a, which is similar to the result from observation data of satellite altimeter with the difference of(0.23±0.46)mm/a,and is lower than the rate of global sea level rise conclusions:In the analysis of regional sea level change,we can get the absolute sea level rise with correction of tide gauge station by GNSS.The relative sea level change corrected by GNSS is characterized by significant seasonal features in Ny-Alesund.The period of seasonal high sea level is from October to November, and the period of seasonal low sea level is from March to April.The correlation analysis between sea surface temperature and sea level shows that the sea level changes with sea surface temperature.
Keywords:Arctic, Ny-Alesund, tide gauge station, satellite altimeter, global navigation satellite system(GNSS),sea level change,vertical land motion
The Arctic Ny-Alesund region is located on the northwest coast of the Svalbard Archipelago(10°E - 35°E, 74°N - 81°N), at the northernmost point of the North Atlantic Current, where the atmosphere, oceans, glaciers, sea level, etc., are sensitive indicators and recorders of climate change.In the context of global warming, sea level rise has become a global concern.As a delayed disaster, its cumulative effect will lead to the inundation of low-altitude areas, coastal erosion, salt tide intrusion and soil salinization,then will destroy the natural ecological environment in coastal areas.Since the 20thcentury,the global sea level has shown an accelerated rising trend.Studying the sea level change in Ny-Alesund region and accurately identifying the variation of sea level change in this region can provide a better basis for the monitoring and protection of natural ecological environment and climate change research in this region.
The sea level change is complicated.The relative sea level change is obtained by traditional tide stations, while the absolute sea level change is obtained by satellite altimetry, but the accuracy of satellite altimetry is low in coastal areas.With the development of global navigation satellite system(GNSS) technology, it is possible to analyze the coastal absolute sea level change based on the combined satellite altimetry data of GNSS and long-term tide gauge stations, but the research work in China is relatively late.For example, Wang Hui[1]et al., Yuan Fangchao[2]et al., Shi Xiaojun[3]et al.carried out the study of absolute sea level change in Sansha City, Fujian offshore and Pearl River Estuary by using tide gauge and satellite altimeter data.Internationally,Pfeffer[4]et al.point out that integrated GNSS, multi-satellite altimeter and tide gauge observation are the key to analyzing coastal sea level change.Trisirisatayawong[5]et al.,Fenoglio-Marc[6]et al., Bitharis[7]et al.and Montillet[8]et al.carried out absolute sea level change analysis in the Gulf of Thailand, the southern coast of Indonesia, Greece and the northwestern Pacific.The technical method of obtaining absolute sea level change by GNSS corrected tide gauge data was studied.
This paper analyzes the variation of sea level rise in the Arctic region by using the observation data of the Ny-Alesund tide station and satellite altimeter.At the same time,the vertical ground movement of the tide station is corrected with GNSS data, and the results of the satellite altimeter are compared to comprehensively analyze the vertical ground movement and sea level change variation in the Ny-Alesund region.The correlation between sea surface temperature and sea level change in the region was analyzed by comparing sea level change with sea surface temperature(SST).
1 Data source and preprocessing
1.1 Data sources
The research data in this paper mainly include the measured data of the tidal station,the elevation time series data of the GNSS continuous operation reference station and the monthly mean of the sea level anomaly of the satellite altimeter.The Ny-Alesund tide gauge station (NYATG) is one of the tide gauge stations in the Arctic Svalbard Islands in the Global Sea Level Observing System(GLOSS)network, which is located at 11°56′17′E,78°55′43′N.NYATG has been observing since 1976,accumulating 42 years of data series,and the Norwegian Mapping Agency has revised the sea level data of the station twice[9],forming the relative sea level data series based on the New-Alesund reference(RLR)(RLR below 20.5 m in Svalbard local benchmark TGBM), and the data integrity rate is 87.4%.In order to match the time of satellite altimeter data and GNSS observation data, this paper selects the monthly mean data of relative sea level from 1993 to 2018 for analysis.The monthly mean data is without measurement, and the data is obtained from the official website of the Permanent Bureau of Mean Sea Level(http://www.psmsl.org).
The satellite altimeter data are derived from the monthly mean sea level anomaly data after multi-satellite fusion correction provided by the French Space Agency.The reference framework is the mean sea level(MSL)from 1993 to 2012.The transit of satellite altimeter in the polar region is limited and the accuracy of the coastal area is not as good as that of the wide sea area.Considering that the New-Alesund tide gauge station is located inside the bay, but the harbor is very smooth with the open sea.It can be considered that the tide gauge station is consistent with the variation law of the wide sea surface in the region.Therefore, this paper searches the satellite altimeter grid data within 1.5° radius around NYATG and obtains the average value according to the distance weighting as the absolute sea level data sequence of the satellite altimeter at the station[10],with a time span from 1993 to 2018.
GNSS data are from the GPS and tidal observation base monitoring working group of International GNSS Service(IGS).There are four GNSS observation stations operated and maintained by IGS near NYATG, which are NYA1, NYA2, NYAL and NYAC.In addition,there are also Chinese Arctic Yellow River Station(CNYR) near NYATG.The basic information of each station is shown in Tab.1.Considering that the observation years of CNYR, NYA1 and NYA2 stations are shorter than that of NYATG, NYAC station was no longer collect data after 2014.And considering the consistency of time and space matching between NYAL station and NYATG data,this paper chooses GNSS data of NYAL station to analyze the variation of vertical crustal movement.The data used in this paper are derived from the single-day solution elevation time series provided by Scripps Orbit and Permanent Array Center(SOPAC)which combine the results of GIPSY software and GAMIT/ GLOBK software.
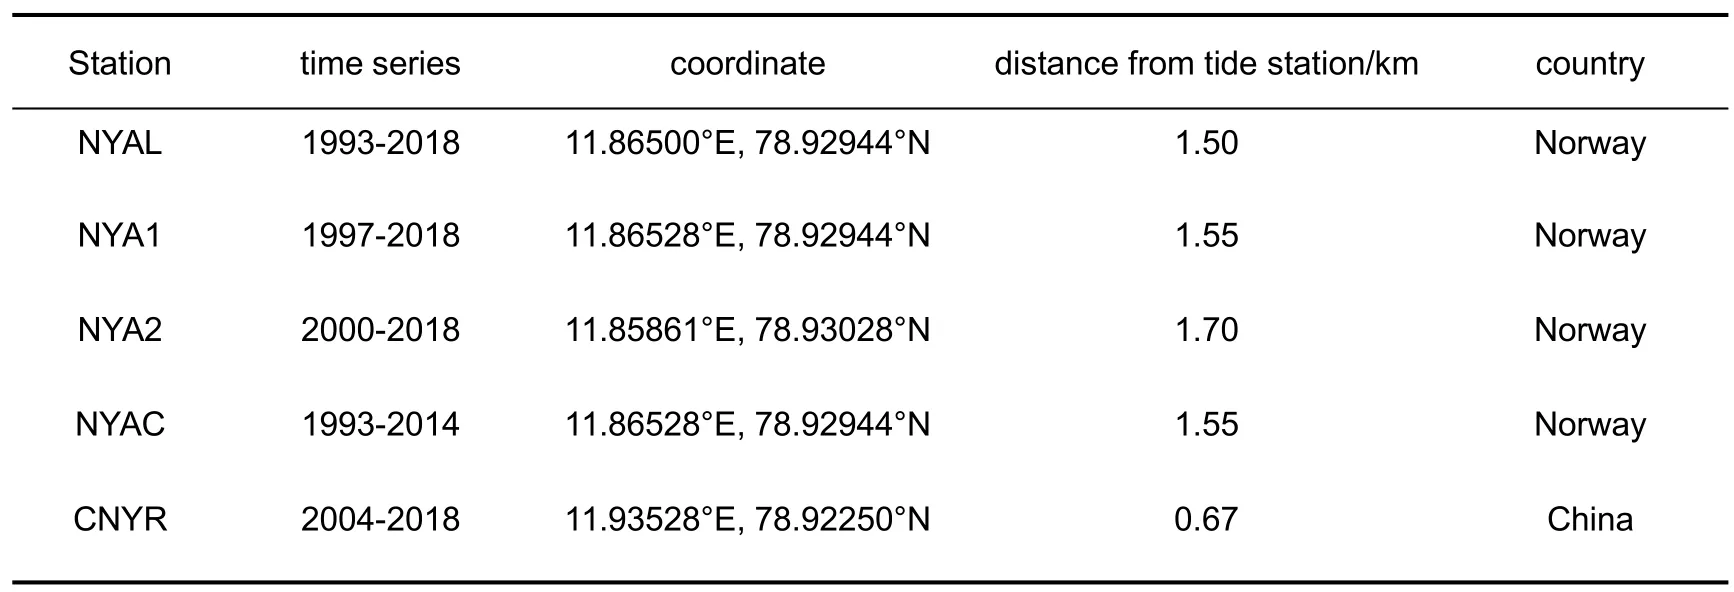
Tab.1 GNSS stations attached to NY-Alesund Tide Gauge Station
1.2 Data preprocessing
1.2.1 Elimination and interpolation of gross errors
Generally,the gross error in the time series can be eliminated by the Laida criterion.However, considering the periodic and linear changes in the GNSS elevation sequence,and the monthly mean sea level sequence of tidal station and satellite altimeter,this paper uses the difference between two adjacent observations to eliminate the gross error[11].The calculation formula of the judgment criterion is as follows:
In the formula,iLis theiobserved value in the time series, and the corresponding error estimate isiδ;Li+1is the next observed value, and the corresponding error is estimated to bei1+δ.When theiobservation value is not a gross error, if the differencebetweeniLandLi1+satisfies Eq.(1),thei+1observation value is considered as a gross error and removed.By analogy, until all gross errors in the sequence are eliminated.
For GNSS elevation time series, the error estimationiδis usually given at the same time in data processing.However, when the observation value in the time series does not give the error estimation of a single observation value, the root mean square value0δof each observation value obtained by the mean square continuous difference method is used to replaceiδ.The detailed introduction and proof can be seen in Reference[12].Then the judgment criterion calculation formula is:
In this paper, the monthly average time series of GNSS sequence is obtained after gross error elimination.From October 1997 to January 1998, there are 4 months of data missing.In this paper,cubic spline interpolation is used to interpolate the sequence, which can be introduced in detail in reference[13].The monthly mean sea level data series of tide gauges and satellite altimeters are not missing and need not be interpolated.
1.2.2 Anomaly processing
Since the time series of GNSS elevation, tide station relative sea level and satellite altimeter sea level data use different benchmarks, in order to facilitate the trend and cycle analysis after data fusion, this paper subtracts the average value of each sequence in the corresponding period from the data to obtain the anomaly value sequence of each sequence.
2 Time series analysis
In this paper,sea level change rate and crustal vertical deformation rate are obtained by using sea level time series and GNSS elevation time series: Firstly, the linear trend of the sequence is calculated by linear regression and the stationary sequence of the trend term is obtained.Then, the periodogram method[14-16]is used to detect the significant period in the stationary sequence.Finally, the linear trend and the significant period are used to fit the observation data at the same time to obtain the accurate linear trend and period,and the time series models of various data are analyzed.
2.1 Analysis of sea level change
When studying the long-term trend of sea level changes, Huang[17,18]et al.believed that for sea level data sequences with periodic changes, direct use of simple linear regression will lead to incorrect results,and periodic changes should be taken into account.The calculation formula for extracting sea level change trend is as follows:
In the formula,Mtis the monthly average sea level observation value of the tidal station;tis the observation time;a0is the average sea level to be determined;obis the linear rate of mean sea level change;aiandibare the undetermined coefficients of the periodic variation corresponding to the periodiciT;tnis the fitting error.
2.2 Analysis GNSS vertical movement
Many scholars have studied the GNSS elevation component, and it is generally believed that the period of the time series of the single-day solution coordinate component of many continuous stations in the world is mainly annual and semi-annual[19-24].In this paper, the same method is used, but the step mutation and post-earthquake relaxation changes are not analyzed.Therefore, the time series expression of GNSS elevation is simplified as:
In the formula,y(ti)is the elevation at the time ofti;ti(i=1,2…N)is the observation time in unit of year; the coefficienty0to be solved is the average value of the sequence;v0is the linear rate;c0,d0and0e,f0are the coefficients of annual and semi-annual periodic terms;viis the observation noise.
2.3 Data fusion analysis
The absolute change of the average sea level is affected by two aspects,namely the vertical movement of the crust in the tidal station area obtained by the GNSS reference station and the change of the sea level relative to the crust obtained by the tidal data[7,8].Therefore,when the results of the sea level analysis of the tide station are merged with the GNSS elevation, the space-time matching of the tide station data and the GNSS data is first carried out, and then the absolute sea level change rate is considered to be equal to the linear sum of the vertical crustal movement rate and the relative sea level change rate,then the GNSS corresponding correction of the sea level data of the tide station is carried out.The calculation formula is as follows:
In the formula,Vis the absolute sea level change rate;Vmslis the relative sea level change rate;hVis the vertical motion rate of GNSS station.
3 Analysis of sea level change in the New-Alesund region
3.1 Period analysis
Since the merged satellite altimeter data has been inverse barometric pressure correction, in order to reduce the impact of inverse barometric pressure correction, this paper first uses the barometric pressure observation data of the World Meteorological Organization(WMO) to perform inverse barometric pressure correction on the sea level observation data of the tide station.The correction method is referred to[25].In order to accurately analyze the periodic variation of relative sea level sequence, satellite altimeter sea level sequence and GNSS elevation sequence of tide gauge station in New-Alesund area.In this paper, the power spectrum analysis of the stationary sequence deducting the trend term is carried out by using the periodogram method, and the significance of the period is tested under the condition of the significance level of 0.05.The results are shown in Tab.2.

Tab.2 Periods of sea level and GNSS elevation
It can be seen from Tab.2,that the significant periods of the same sea level series of the tide gauge and the satellite altimeter are 13.0 a, 6.5 a, 1.0 a and 0.5 a, and the significant periods of the GNSS elevation series of the tide gauge are 10.8 a, 3.6 a, 1.0 a and 0.5 a.Therefore, the GNSS elevation of the tide gauge has the same 1.0 a and 0.5 a periods as the sea level, and the long period of the GNSS elevation is less than the long period of the sea level.
3.2 Long-term trend analysis
According to the periodic terms in equation (3) and Tab.2, the final change trend of the sea level data of the tidal station and the sea level data of the satellite altimeter are extracted respectively, and the GNSS elevation sequence analysis results are fused with the relative sea level analysis results of the tidal station according to equation (5).In order to further evaluate the absolute sea level change trend obtained by combining GNSS elevation and tide gauge(GNSS+Tide), the absolute sea level change trend obtained by GNSS+Tide and satellite altimeter is compared and analyzed.The results are shown in Fig.1.

Fig.1 Anomaly values of MSL and GNSS elevation from 1993 to 2018 in Ny-Alesund
After using GNSS to correct the crustal movement of the tidal station sea level data,the absolute sea level rise rate in the New Orson area from 1993 to 2018 was 0.78±0.41 mm/a, the corresponding GNSS was 8.09±0.19 mm/a,and the tidal station was-7.31±0.36 mm/a, while the absolute sea level rise rate obtained by the satellite altimeter was 1.01 ± 0.21 mm/a, and the difference between the two was 0.23 ± 0.46 mm/a.Therefore, it can be concluded that the sea level in the New-Alesund region shows a slow upward trend,with an upward rate of about 1.0 mm/a,which is lower than the global level in the same period(the global average sea level rise rate was 3.15 ± 0.3 mm/a in 1993 - 2018, and the data were from “2018 Global Climate Statement” of WMO).At the same time, it is verified that the tidal station data corrected by GNSS for vertical crustal movement can effectively analyze the regional sea level change law, and can also be used for the correction reference of satellite altimeter data in local areas.
3.3 Sea level seasonal variation and sea surface temperature
The sea level change in the New-Alesund region is affected by local hydrometeorological elements such as sea surface temperature, ocean current, wind,temperature, air pressure, precipitation and glacier melting.The change of sea surface temperature is one of the main factors causing sea level change.In this paper, the sea surface temperature data set OISST_V2 released by the National Oceanic and Atmospheric Administration of the United States is used to obtain the sea surface temperature data sequence of the tidal station sea area by using the distance weighting method,and then the sea surface temperature change and sea level rise are studied.
Seasonal variation of sea level refers to the change of sea level caused by seasonal climate change,which is roughly the same every year.From Fig.2, it can be seen that the seasonal variation of sea level obtained by GNSS+Tide in the New-Alesund area is in good agreement with the seasonal variation of sea level obtained by satellite altimeter, both of which have obvious characteristics of peak and valley.The sea level was the lowest in March, increased significantly after March, and reached the highest in October, with an annual variation of about 12 cm.October to November is the seasonal high sea level period, and March to April is the seasonal low sea level period.In 1993-2018, the sea surface temperature increased at a rate of 0.13°C per 10 years, and its seasonal changes showed some differences from the seasonal changes of sea level.The sea surface temperature is the lowest in April,and it rises significantly in April-August.At the same time,the sea level is also in the stage of rapid rise, which indicates that the sea level rise driven by thermal expansion of seawater is dominant at this time.The sea surface temperature reached the highest in August, and decreased rapidly in August-October.At this time, the sea level was still in the rising stage,but the trend slowed down, indicating that there were still other dominant factors such as wind and air pressure driving the sea level rise.

Fig.2 Monthly MSL and SST in Ny-Alesund
In order to further analyze the driving effect of sea surface temperature on sea level rise, the OISST_V2 data are compared with GNSS+Tide data after removing the trend term and mean value.The results are shown in Fig.3.The correlation analysis of sea surface temperature and sea level is carried out, and the cross-correlation function diagram of the two is shown in Fig.4.It can be seen from Fig.3 that the phase of sea surface temperature is ahead of the phase of sea level, that is, the change of sea surface temperature is in the front and the change of sea level height is in the back.From Fig.4, it can be seen that the maximum correlation coefficient between sea level and sea surface temperature is 0.56 between 1993 and 2018; the peak value of the curve corresponds to the lag period, so the sea level lags the sea surface temperature by 1 - 2 months.In addition, the sea level change in this area is also affected by wind, precipitation, glacier activity and other factors.The author will continue to discuss in the future work.

Fig.3 Anomaly values of MSL and SST from 1993 to 2018 in Ny-Alesund

Fig.4 Cross-Correlation Function Between MSL and SST in Ny-Alesund
4 Conclusion and discussion
In this paper,the relative sea level change law of tide gauge station,the absolute sea level change law of satellite altimeter and the vertical motion law of GNSS tide gauge station site in the New-Alesund region of the Arctic are systematically analyzed.The sea level data of tide gauge station are corrected by using the analysis results of GNSS crustal movement, and the absolute sea level sequence deducting land subsidence is obtained.The sea level data in this area are comprehensively evaluated, and the sea level change law in this area is objectively analyzed.The following conclusions are drawn:
1)The sea level change monitored by the tide gauge station in the New Olson area is affected by the rising movement of the crust, and the relative sea level shows a downward trend, with a rate of -7.31 ± 0.36 mm/a.The absolute sea level showed a slow upward trend after the correction of crustal movement using GNSS elevation sequence analysis results, and the rising rate was (0.78±0.41) mm/a, which was lower than the global sea level rising rate in the same period.
2)The analysis results of the absolute sea level change data of the satellite altimeter in the New Olson area show that the absolute sea level is slowly rising,and the rising rate is 1.01 ± 0.21 mm/a, which is different from the absolute sea level rising rate obtained by GNSS+Tide(0.23±0.46)mm/a.
3) The sea level change in the New-Alesund region has obvious periodicity and seasonality.The significant periods are 13.0 a, 6.5 a, 1.0 a and 0.5 a.The seasonal high sea level period is October-November, and the seasonal low sea level period is March-April.Through analysis,it is found that with the change of sea surface temperature,sea level also changes accordingly.
4) In the analysis of regional sea level changes, the tidal station sea level data after GNSS correction of crustal vertical movement can be used to analyze the regional absolute sea level changes, and can also be used for the correction reference of satellite altimeter sea level observation data in local areas.
Acknowledgement
The ‘Glacier Movement and Mass Balance' monitoring group of the 2018 scientific expedition of the Chinese Arctic Yellow River Station has provided assistance in data collection and analysis.
杂志排行

Marine Science Bulletin的其它文章
- "Marine Science Bulletin"(《海洋通报》(英文版))征稿简则
- Implementation and application services of national marine scientific data sharing service system
- Practice of marine data sharing:a case study of online sharing for marine data in private network environment
- Establishment and analysis of GNSS coordinate time series noise model for coastal tide stations in China
- Study on the refined classification method of mangrove tree species based on Sentinel-2 MSI images combined with object-oriented
- Research and application of environmental risk assessment model for marine mobile risk sources