Enhanced ultrasonic total focusing imaging of CFRP corner with ray theory-based homogenization technique
2023-02-09ZhongbingLUOJinliKANGHunqingCAOLiLIN
Zhongbing LUO, Jinli KANG, Hunqing CAO,b, Li LIN,*
a NDT & E Laboratory, Dalian University of Technology, Dalian 116024, China
b Shenzhen Key Laboratory of Smart Sensing and Intelligent Systems, Shenzhen Institute of Advanced Technology, Chinese Academy of Sciences, Shenzhen 518055, China
KEYWORDS Carbon fiber reinforced plastic;Complex shape;Homogenization;Imaging;Time of Flight (TOF)
Abstract Ultrasonic testing is effective in defect characterization and quality assurance of Carbon Fiber Reinforced Plastic (CFRP) components in the aerospace industry. Due to the coupling between complex shape and elastic anisotropy, the Phased Array Ultrasonic Testing (PAUT) and time-based Total Focusing Method (TFM) face significant challenges in the calculation of wave propagation.A wave velocity distribution model is established for a multidirectional convex corner of CFRP based on a homogenization theory and the above coupling effects are also incorporated.A ray-tracing method is proposed based on Dijkstra’s shortest path search algorithm. The predicted time of flight ensures that this technique, the homogenized TFM, could synthesize a high-quality focused image by post-processing on the full matrix capture data. Experiments on a laminate with three φ1.5 mm Side-Drilled Holes(SDHs)in different circumferential directions confirm a successful homogenized TFM imaging that all SDHs can be effectively detected. As compared to the isotropic scenario, the maximum positioning error is reduced to 0.12, 0.08, and 0.38 mm, and the Signal-to-Noise Ratios (SNRs) are increased by 2.1, 1.1, and 11.8 dB, respectively. It is suggested that the ray-tracing assisted TFM technique can effectively improve the imaging of corners in CFRP components.
1. Introduction
Composite materials like Carbon Fiber Reinforced Plastics(CFRP)have been widely used in aircraft structures. To fulfill the optimal performance of structural design,corners are commonly seen in large-scale components with complex geometries(e.g., stringers and spars).1For prepreg used in autoclave molding, the high-strength carbon fiber lies in unidirectional with resin, which shows significant elastic anisotropy. When transforming into multidirectional laminates, the wave propagation would be reflected and refracted by the multilayered structure. Unfortunately, during the consolidation process of CFRP, the corners are prone to uneven pressure distribution and multi-dimensional resin flow, causing defects such as delamination, porosity, and fibre waviness. Under lowvelocity impact conditions, damage generally occurs along the interlayer, which might further propagate under external loads and significantly weaken the mechanical properties and structural integrity of the components.2,3Therefore, it is radical to detect internal defects with Non-Destructive Testing(NDT) techniques such as Phased Array Ultrasonic Testing(PAUT), which has aroused much attention from academic and industrial aspects.4For CFRP corners, however, this is seriously challenging because of the complicated wave propagation behavior resulting from the coupling of multilayered structure, complex shape, and elastic anisotropy. The unexpected wave paths and severe ultrasonic energy scattering make the defect information in the signal difficult to extract.
A post-processing algorithm based on the PAUT, termed the Total Focusing Method (TFM), could achieve a fully focused image with a high Signal-to-Noise Ratio (SNR) and has been regarded as the ‘‘gold standard” for array processing.5It is of higher demand for the Time of Flight (TOF)between the transmitter-receiver elements than the normal incidence method commonly used in ultrasonic testing.6Otherwise,post-processing focused imaging via the superposition of in-phase waves is difficult to achieve.So the TOF between elements and image points in CFRP corners would be essential for the operation of TFM imaging.
As reported by the literature,two methods have been developed for accurate TOF calculation, i.e., forward and inverse problems.(A)Forward problem:to predict the ray path when the initial propagation direction is given, such as the Finite Element Method(FEM)and Snell’s law.In work by Ito et al.,7the FEM model is established for ultrasonic wave propagation behavior in the corner of CFRP laminate structure, and Luo et al.8,9achieved a quantitative description of the material elasticity over the laminated structure by simulations. For that with a simple geometry where the surface could be expressed by a basic function, Snell’s law has been used directly to predict the situation. (B) Inverse problem: to inversely calculate the ray path between two specific points, with the iterative method and the shortest path searching algorithm as representatives.The difference with the forward model based on Snell’s law is that to accurately make the ray path through the target point, the iterative method needs to continuously correct the initial direction.10It is not suitable for complicated media like CFRP.Moreover,this conventional way is time-consuming in computation when constructing a large number of ray paths for an ultrasonic array imaging purpose. Fermat’s principle states that the ray path corresponds to the minimum TOF,and this is in accordance with the shortest path searching algorithm utilized in graph theory. In this way, Nowers et al.11developed an A* algorithm, where two adjacent grid points in the same homogeneous sub-region were directly connected with a straight-line ray path, and then the global ray path through the whole Region of Interest (ROI) could be determined by finding the one formed by these connections with globally minimal TOF. Dijkstra’s path-finding algorithm was also applied to ray-tracing of CFRP laminates12and austenitic stainless steel welds.13
The above scenarios to the inverse problem depend on the forward problem, generally solved by numerical simulation.The acoustic modeling of CFRP could be divided into three categories. (A) The early developed isotropic model, in which the laminate is directly simplified as an isotropic and homogeneous media. (B) The fully heterogeneous model, considering the multilayered structure and elastic anisotropy. One singleply was regarded as the smallest unit,14and the mismatch of acoustic properties between adjacent plies with different fiber orientations could be incorporated.15Ishii16and Ito7et al.implemented this idea to FEM of CFRP laminate, and the influence of porosity on ultrasonic wave velocity, attenuation,and interlaminar interface echoes was analyzed. Previously,TOF calculations based on the FEM model8,9and Dijkstra’s algorithm12were developed for CFRP laminates, and the imaging of defects was enhanced with a high resolution and SNR. Although the second model considers various factors in CFRP corner,the real-time capability needs to be improved,focusing on the urgent demands for on-site inspection of the oversize structure. Considering the efficiency and accuracy of defect detection, the homogenized model is more valuable for developing industrialized defect detection strategies.(C) The homogenization model through the whole thickness.Gengembre17and Deydier18,19et al.extended the homogenization theory20to the multidirectional CFRP laminate,and proposed the Ray-Based Homogenization(RBH)theory.It points out that the whole plies in a layup sequence with a scale equivalent to the wavelength can be used as a transverse isotropy unit. Therefore, CFRP components through the whole plies can be regarded as a homogeneously anisotropic medium. In summary, the ray-tracing method based on the shortest path searching algorithm is versatile to reach a balance between accuracy and efficiency of calculation, and thus is appropriate for calculating the TOF in large-scale CFRP components with complex shapes.
In this study, a wave velocity distribution model is established for a multidirectional CFRP corner based on the homogenization theory, where the coupling between complex shape and elastic anisotropy of material is incorporated simultaneously. A novel ray-tracing method based on Dijkstra’s shortest path search algorithm is also proposed to predict the ray path and calculate the TOF for the wave from the convex side of the corner with high calculation accuracy, input as homogenized TFM technique to synthesize a high-quality focused image of the defects with high efficiency. Finally, the homogenized TFM imaging is compared with that based on isotropic hypothesis,and the detection accuracy and efficiency are discussed comprehensively.
2. Methodology
2.1. Homogenization of multilayered corner
To simplify the influence of multilayered structure in the corner of CFRP laminate, only the effects of complex shape and elastic anisotropy on the wave propagation are considered.The multidirectional laminate is equivalent to a homogeneously anisotropic medium through the whole thickness based on the RBH theory. As shown in Fig. 1, the curvature center of the corner is defined as the Cartesian coordinate origin o, and the horizontal and vertical directions are defined as the x-axis and the y-axis, respectively. The L-shaped multidirectional laminate could be homogenized into an L-shaped unidirectional one. The detailed principles are explained as follows:

Fig. 1 Schematic of homogenization technique for L-shaped multidirectional CFRP laminate.
(1) According to the variation of fiber orientations,the L-shaped multidirectional laminate can be divided into three parts, as shown in Fig. 1(a), i.e., the middle corner where the fiber orientations change continuously with the curved surface,and the plates with constant fiber orientations on both sides.
(2) The middle corner is discretized into fan-shaped units along the circumferential direction at an interval angle of Δα(as shown in Figs. 1(b) and (e)). When Δα approaches 0, the fiber orientations of each ply in the fan-shaped unit could be regarded as constant, and the unit is further approximated to a multidirectional plate with a width of RΔα (as shown in Fig. 1(f)).
(3) According to the RBH theory, the fan-shaped unit (as shown in Figs. 1(b) and (e)) is equivalent to a homogeneously anisotropic plate unit (as shown in Fig. 1(g)). The side plates are homogenized in the same way (as shown in Fig. 1(c)),and a piecewise description is realized.
(4) Consequently, the L-shaped CFRP multidirectional laminate is discretized in the circumferential direction (as shown in Fig.1(c)),stacked by the plate and fan-shaped units.The ultrasonic properties of each unit are the same, whereas the difference is that the stiffness matrix of each unit changes with the fiber orientation in the current global coordinate system o-xyz. For example, the radial symmetry axis of the fanshaped unit in Fig.1(h)forms angle β with the x-axis.The fiber orientations contained in each ply are rotated clockwise by π/2-β around the z-axis,and the corresponding stiffness is calculated through Bond transformation21from 0° stiffness matrix. When lim Δα → 0, this discretization achieves a quantitative description of the continuous stiffness change of the L-shaped CFRP multidirectional laminate (as shown in Fig. 1(d)).
For the L-shaped unidirectional laminate, the elastic stiffness matrix after homogenization is still the same as a single ply. For the multidirectional condition, the quasilongitudinal wave (qP wave) group velocity distribution can be directly measured by the Back-Wall Reflection Method(BRM) described in Section 3.1. Thus, another homogenization technique is proposed for the L-shaped CFRP multidirectional laminate upon previous work.
2.2. Dijkstra’s algorithm-based ray-tracing method for homogenized corner
As discussed in Section 2.1,the L-shaped multidirectional laminate is homogenized into an L-shaped unidirectional through the whole thickness. Between the ultrasonic emission source point s and the target point e as shown in Fig. 2, the ray path could be divided into two segments,respectively located in the coupling layer and the laminate. The former case follows the rule of linear propagation in an isotropic medium,and the latter has the nature of ray-tracing between two points in an elastically anisotropic medium with a curved shape.The schematic is shown in Fig. 2, where a linear array is used. The plythickness is d,the radius of the corner is R,the length of plates on the sides is l,the vertical distance between the array and the upper surface of the corner is D, and the pitch of array elements is P. The acoustic coupling layer is also indicated in Fig.2,and the ultrasonic velocity is vc.According to the positional relationship between the source point s and the target point e, the ray paths can be classified into four categories:
Type I: The target point e1is located on the upper surface of the corner. The ray is emitted from point s1and straightly passes through the acoustic coupling layer. The TOF is the ratio of the linear distance s1e1to the wave velocity of the coupling layer.
Type II:The target point e2is also located on the upper surface of the corner. The ray emitted from point s2would be blocked by the convex surface of the corner, and could not be transmitted straightly to e2.Firstly,it is incident to a certain point on the surface at a large angle, and after refraction, the ray continues to propagate along the contour of the surface until it reaches e2. The first path is a straight line connecting s2and the surface incident point e'2 inside the coupling layer,and the TOF is the same as that in Type I. The second path is along the upper surface between e'2and e2, and the TOF is the ratio of the curved distance of e'2 e2to the circumferential velocity of the first ply.
Type III:The target point e3is located inside the corner and in the same radial direction as point s3.Since the wave velocity of the plies is the same along the thickness direction, the ray does not change its direction from s3to e3, which is similar to Type I. The difference is that the second part is a straight line along the radial direction, and the wave velocity in the thickness direction would be used.

Fig. 2 Schematic of ray-tracing through L-shaped multidirectional CFRP laminate.
Type IV:The target point e4is located inside the corner and beyond the radial distribution of point s4. The ray will firstly obliquely enter the upper surface of the corner. After that,the influences of elastic anisotropy and curved shape should be carefully considered. A ‘‘discrete-integrated” strategy is proposed based on Dijkstra’s path-finding algorithm to solve this most difficult situation.
The accurate determination of TOF of phased array ultrasonic is the prerequisite of TFM imaging reconstruction in CFRP corner.In this study,a novel ray-tracing method based on homogenization is proposed, the grid discretization of the ROI, the connection relationship between grid nodes, and the calculation of TOF are designed by the principle of wave propagation, so that the ray path between two fixed points of CFRP corner can be calculated quickly. Dijkstra’s algorithm is a typical single-source searching strategy, which is used to calculate the shortest path between two arbitrary nodes in a directed graph. The starting point is regarded as the center,and expands to the outer ply until it reaches the endpoint.This inverse method for ray-tracing obeys Fermat’s principle,i.e., the ultrasonic wave always travels along the path with the shortest time between two fixed points. The only required is the TOF between adjacent nodes.Given two adjacent nodes niand nj, the corresponding TOF tijis dependent on the distance between the nodes dijand velocity at the current incident angle vij, where i and j represent two adjacent grid nodes. To illustrate this method, the L-shaped CFRP laminate with 4 plies shown in Fig. 2 is taken as an example. The process is shown in Fig. 3. The steps are as follows:
(1) Calculation of the wave group velocity distribution in the ROI: the coupling layer and the laminate are included simultaneously. According to the BRM method proposed by Li et al.,22the change of the group velocity V(x, y, θ) with the position and the propagation direction angle θ is calculated.
(2) Discretization of the ROI: according to the homogenization technique mentioned in Section 2.1, the L-shaped CFRP multidirectional laminate is simplified to a unidirectional case,which is discretized in the circumferential direction with plate and fan-shaped units.Each unit is homogeneous but elastically anisotropic. Along with these circumferential grids,the radial direction is further discretized with an interval of d in virtue of the existing circumferential boundaries, and the CFRP corner part was discretized at 0.5° and 0.06 mm intervals in the circumferential and radial directions respectively,generating a total of 145 × 181 image points in the actual experiment.
(3)Determination of the type of ray path:based on the relative position relationship between the source point s and the circumferential point e, the possible paths could be determined. According to the homogenization theory, a single unit can be regarded as a homogeneous one, and thus ultrasonic waves can propagate in a straight manner. So the relationship herein between the grid nodes p and q could be directly connected and calculated for the TOF. The coordinates of points s, e, p, and q are denoted as (xs, ys), (xe, ye), (xp, yp), and (xq,yq), respectively.
(4) Calculation of the whole path and TOF: according to the above-discussed ray-tracing method based on Dijkstra’s algorithm, the TOF and paths of Type II and IV could be calculated.
2.3. Total focusing method imaging with ray-tracing method
Full Matrix Capture (FMC) acquires ultrasonic data with all the array elements transmitting sequentially and receiving echo signals independently at the same time.For a probe with N elements,the obtained N2A-scan signals are denoted as Aij.Postprocessing with the TFM algorithm could be further carried out to achieve a fully-focused B-scan image of the crosssectional corner, for any image point (x,y), its image intensity I(x,y) is given by

where hijindicates the Hilbert transform; time delays ti(x,y)and tj(x,y) are the time of flight from element i and j to image point (x,y), respectively. The imaging relies on the amplitude of each receiving signal,whereas the basis of‘‘delay and sum”is the difference in the TOF. Accordingly, it could be divided into two categories, i.e., isotropic TFM and homogenized TFM:
(1) Isotropic TFM (as shown in Fig. 4(a)): The L-shaped multidirectional laminate is simplified as an L-shaped isotropic medium with a constant velocity of 2922.0 m/s which was measured in the thickness direction. Hereby, the ray-tracing method from the convex side is used to calculate the TOF between each element and all imaging points.
(2) Homogenized TFM (as shown in Fig. 4(b)): The specimen is equivalent to the L-shaped unidirectional laminate following the method described in Section 2.1, and the qP-wave group velocity as a function of wave propagation angle will be discussed later.

Fig. 3 Flowchart of ray tracing assisted by Dijkstra’s algorithm in CFRP corner.
3. Experimental configurations
The CFRP corner with 8.64 mm thickness shown in Fig. 5 is selected, made of CYCOM X850/T800 (Cytec) carbon fiber/epoxy prepreg layered by the hot-pressing technique.As shown in Fig. 4(b), the specimen contains 48 unidirectional plies stacked in a sequence of [-45/45/0/45/90/0/90/-45/90/90/-45/45/0/45/90/0/90/-45/90/90/45/90/-45/90]s. The center angle is 90°, and the curvature radius of the concave surface is 8.8 mm. The mass density is measured as 1590 kg/m3. 0° plies are assumed to contain horizontally fibers whose elastic stiffness matrix C is measured by the immersed ultrasonic backreflection method in Refs. 23 and 24, as given by

where Cijis the component of elastic stiffness matrix, GPa.
To evaluate the imaging resolution in circumference, three Side-Drilled Holes (SDHs) with 1.5 mm diameter were made from the cross-section of the corner in Fig. 5(a). The distances from the center of the corner are 14.3, 14.8,15.1 mm, respectively, of which the circumferential angles with the horizontal are in the range of 69.2°-99.8°. As shown in Fig. 6, BRM method22was used to obtain the relationship between the qP-wave group velocity and the wave propagation direction angle. The linear array is directly contacted on the planar surface of a defect-free part. Since the qPwave group velocity distribution of each ply is symmetrical to the normal of the surface, the reflection point Rijof a transmitting-receiving pair (Ti-Rj), i.e., the i th transmitting and j th receiving elements, is located at ((xi+ xj)/2, d). Correspondingly, the time required for the qP-wave from the element i to Rijis half of the time tijrequired from the element i to the receiving element j, and the latter can be directly measured from the TOF difference between the initial pulse and the first bottom echo received by Ti-Rj. The wave propagation angle θijis defined as the angle between the x-axis and the straight line that connects the transmitting array element i and Rij. The corresponding homogenized qP-wave group velocity equals to the ratio of the straight-line distance between the transmitting array element i and Rijto half of the time tij.

Fig. 4 Schematic of isotropic and homogenized TFM imaging of CFRP corner.

Fig. 5 Geometric dimension of CFRP specimen and layout of linear array.
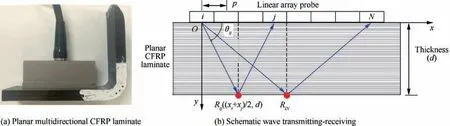
Fig. 6 BRM measurement of planar multidirectional CFRP laminate and schematic wave transmitting-receiving.
A MultiX++ phased array controller system (manufactured by M2M, Les Ulis, France) is used as a pulser and data acquisition unit. The sampling frequency is 100 MHz. The transducer is a 64-element linear array probe with 1 mm pitch and 5 MHz center frequency (manufactured by Olympus Canada Inc., Marham, ON, Canada), where only the first 32 elements are utilized. The probe is immersed in water (the velocity in water vw= 1483.4 m/s) from the convex side of the corner to perform the FMC acquisition, as shown in Fig. 5(b). The 32 × 32 dataset of A-scan signals is then exported to MATLAB (The MathWorks, Inc., Natick, MA)for post-processing.
4. Results and discussion
4.1. BRM measured wave group velocity profile
The qP-wave group velocity v of the homogenized multidirectional laminate is obtained with the BRM in Fig.7,as a function of the wave propagation angle θ. A curve is fitted in the range of 33.6°to 146.4°based on 75 data points in total,given by a fourth-degree polynomial function

where the distribution in the range of θ ∈[0,π] is symmetrical with respect to the θ = 0.5π line. This function is then incorporated into the following ray-tracing and TFM imaging algorithms.

Fig. 7 BRM measured qP-wave group velocity versus wave propagation angle.
4.2. Comparison of ray-tracing predicted paths and travel time
Two ray-tracing models are utilized to reconstruct the ray paths between array elements and three target points(0,15.28), (0,10.96), (0,8.80), respectively. The results for elements 1 to 32 are all shown in Fig. 8. Only the path between element 16, denoted as E16, and the target point travels in a straight line. While for the others, the ray path deflects at the water/CFRP interface, and the degree aggravates with the increasing deviation from E16 and the decreasing target point depth.For the isotropic model(as shown in Figs.8(a)-(c)),the ray path is straight under all conditions. Nevertheless, it is of difference with that in the homogenized L-shaped laminate(as shown in Figs. 8(d)-(f)), and a curve with a continuously increasing curvature is observed with the decreasing depth of the target points, making the ray path gradually approach a straight line in Fig. 8(d). In summary, the relative position of the array element to point e determines the ultrasonic incident angle,which further affects the dependence of the ray path on the elasticity of CFRP. That is, the closer the array element is to the radius of the corner corresponding to the target point,or the deeper the target point is, the smaller the ultrasonic incident angle and the closer to isotropy of the ray path.
TFM imaging quality depends on the accuracy of the delay time. For example, the representative original A-scan signals are extracted and shown in Fig. 9. The amplitudes and delay times of surface echo and SDH echo are different. The TOFs corresponding to the middle SDH at point (1.36,15.58) are 16.51, 16.5, 16.53 μs for element pairs T15-R15, T15-R16,and T15-R17, respectively. Here the ray-tracing method discussed in Section 2.2 is used to calculate the accurate TOFs for two typical conditions inversely, i.e., E1 on the left (as shown in Figs. 10(a) and (b)) and E16 in the center (as shown in Figs. 10(c) and (d)). The defect-free models of the homogenized and the isotropic with a velocity of 2922.0 m/s are compared. Under the isotropic situation (as shown in Figs. 10(a)and (c)), the TOF is approximately circularly distributed,and the center is based on the position of the array element.In contrast, the homogenized model considers the influences of complex shape and elastic anisotropy. In Fig. 10(b), the TOF distribution of E1 shows conformal bending in the circumferential corner, and the ‘‘sharp tip” feature reported earlier25does not appear at the 0° ply. It is because the homogenization technique keeps the globally anisotropic character but ignores the effects between plies, that the detailed TOF related to plies is not accurate enough. For E16 in Fig. 10(d), the wave is incident on a slightly oblique angle to cover the entire corner, so the influence of the multilayered structure is weakened and the TOF distribution is more consistent with the actual wave propagation behavior.
4.3. TFM imaging of CFRP corner
The cross-sectional area of the entire corner is selected as the imaging region, and is meshed at an angular interval of 0.9°in the circumferential direction and a length of 0.06 mm in the radial direction. A total of 145 × 101 imaging grid points are generated. FMC data acquisition is performed and postprocessed separately to reconstruct B-scan images of the corner with ∅1.5 mm SDHs.Those of isotropic and homogenized TFM are shown in Fig.11,respectively,in an amplitude range of-16-0 dB.The SNRs and the positions of SDHs are used to evaluate the detection ability. Since the circular contour of SDH has no orientation,it can be irradiated by and also reflect waves in all directions, and the imaging of SDHs could be located at any position on the circular contour. In order to evaluate the localization ability, the actual positions of the SDHs contour are marked with gray circles in B-scan images.The minimum distance between the imaging position and the contour of SDHs, ΔR, is utilized to evaluate the localization performance.

Fig. 9 A-scan signals of middle SDH captured by element pairs T15-R15, T15-R16, and T15-R17, respectively.

Fig. 8 Ray paths between array elements and target points at coordinates of (0,15.28), (0,10.96), (0,8.80) within isotropic and homogenized corner.
As shown in Fig.11(a),only the middle SDH in the isotropic TFM image is accurately displayed with image amplitude of -1.06 dB and ΔR = 0.11 mm. The two-side SDHs cannot be seen clearly, and weak noise is observed alongside the surface. In contrast, all the three SDHs are effectively detected and the positions are also consistent with the actual conditions in the homogenized TFM image (as shown in Fig. 11(b)). The ΔR of the SDHs are 0.12, 0.08, 0.38 mm from left to right,respectively. Accordingly, the SNRs are increased from 3.0,13.5, 0.7 dB in the isotropic TFM image to 5.1, 14.6,12.5 dB in the homogenized TFM image, respectively. The near surface noises from ply interfaces are also increased.The noise indication near the left side surface has a maximum amplitude of -9.8 dB and thus could be mistaken as a defect.Since the SNRs of each SDH with respect to their respective neighboring regions are high enough(≥5 dB),the near surface noises will not affect SDHs detection.
It is worth noting that the relative position between SDHs and transmitters causes differences in imaging quality at different positions.In Fig.5,the radial direction of the middle SDH is nearly parallel to the normal direction of the linear array,so adjacent elements can effectively irradiate the middle SDH with a high-quality reflected echo. For the SDHs on the sides,no waves irradiated in the vertical direction for all elements.Affected by the acoustic field directivity and the omnidirectional scattering fact of SDH, the acoustic energy with effective irradiation and reflection of the side SDHs is weaker than that of the middle. From the above discussion, it is confirmed that the isotropic TFM only considers the influence of complex shape,while the influence of the coupling between the complex shape and elastic anisotropy is further considered in the homogenized TFM. Therefore, the obvious difference between isotropic and anisotropic TOF on the side SDHs indicates that the anisotropic velocity distribution in CFRP poses much stronger effects on the wave propagation than that of the middle SDH.
Under the combination of the TOF and acoustic energy factors, the middle SDH has a superior image quality in both TFM images,but the side SDHs cannot be detected by the isotropic TFM. While the accuracy of the TOF for SDHs on the sides is improved by ray-tracing method, the detection ability could be strengthened by the homogenized TFM.In summary,the ray-tracing method based on homogenization theory successfully deals with the coupling effects of complex shape and elastic anisotropy in CFRP corner, and the ray path and TOF information of an L-shaped multidirectional plate can be predicted better in a more efficient manner by virtue of the fast-computation nature of Dijkstra’s algorithm.
5. Conclusions
A wave velocity distribution model that homogenizes the multidirectional CFRP corner as a whole to simplify the raytracing calculation was proposed. The coupling between complex shape and elastic anisotropy is also incorporated.On this basis,the ray-tracing problem from the convex side of the corner is transformed into a shortest path search problem via combining Fermat’s principle with Dijkstra’s algorithm,which realizes the accurate and fast inversion of the TOF required for TFM imaging. The main conclusions are as follows:
(1) In contrast to the isotropic condition, the homogenized ray path is continuously curved, with the degree of curvature increasing with the circumferential distance between the source and target. Correspondingly, the isotropic TOF distribution is approximately circular, while the homogenized TOF distribution bends against the direction of wave propagation,showing a significant anisotropy of wave velocity in CFRP corner.

Fig. 10 2D ultrasonic TOF distributions between array element and isotropic/homogenized corner.

Fig. 11 B-scan images of corner using isotropic and homogenized TFM.
(2) Experiments on the L-shaped multidirectional CFRP laminate (corner thickness of 8.64 mm, angle of 90°, and concave radius of 8.8 mm), indicate that only the central SDH is clearly detected in the isotropic hypothesis commonly used in engineering. While for the homogenized TFM image, a successful homogenized TFM imaging shows that all three SDHs in different circumferential directions could be detected with high-quality and accurate localization ability. The maximum positioning error is reduced to 0.12, 0.08, and 0.38 mm, and the SNRs are increased by 2.1, 1.1, and 11.8 dB, respectively.
(3) The homogenization model achieves a combination of efficiency and accuracy with engineering significance by simplifying the influence of the interlayer refraction on wave propagation in CFRP. Future work would continue investigating new ray-tracing methods considering the coupling effect of the three factors of complex geometry, multilayered structure,and elastic anisotropy,and analyzing their effects on the TFM imaging quality.
(4) The proposed ray-tracing method based on homogenization theory only considers the ray path and TOF information,where the energy is ignored.Therefore,the TFM imaging results for those with weak acoustic energy, e.g., large deviations between the group and phase velocities, would not be acceptable even under an accurate delay and sum. Moreover,the possible ray paths for irregular surfaces would be hard to be categorized, and the TOF calculation would be complicated.
Declaration of Competing Interest
The authors declare that they have no known competing financial interests or personal relationships that could have appeared to influence the work reported in this paper.
Acknowledgements
This work was supported by the Fundamental Research Funds for the Central Universities, China (No. DUT22GF304), the Dalian Support Plan for Innovation of High-Level Talents(Youth Science & Technology Stars), China (No.2018RQ40), the Liaoning Revitalization Talents Program,China (No. XLYC1902082), and the National Basic Research Program of China (No. 2014CB046505).
杂志排行

CHINESE JOURNAL OF AERONAUTICS的其它文章
- Recent developments in thermal characteristics of surface dielectric barrier discharge plasma actuators driven by sinusoidal high-voltage power
- A review of bird-like flapping wing with high aspect ratio
- Rotating machinery fault detection and diagnosis based on deep domain adaptation: A survey
- Stall flutter prediction based on multi-layer GRU neural network
- Supervised learning with probability interpretation in airfoil transition judgment
- Effects of input method and display mode of situation map on early warning aircraft reconnaissance task performance with different information complexities