Experimental study on flow excursion instability of supercritical hydrocarbon fuel in scramjet regenerative cooling parallel channels
2023-02-09XioyongLIUZhuqingYANGRuipuMIAOFengLIUShujunZHAOQinchengBI
Xioyong LIU, Zhuqing YANG, Ruipu MIAO, Feng LIU, Shujun ZHAO,Qincheng BI
a Beijing Power Machinery Research Institute, Beijing 100074, China
b Liaoning Key Laboratory of Complex Energy Conversion and Utilization, School of Energy and Power Engineering, Dalian University of Technology, Dalian 116024, China
c State Key Laboratory of Multiphase Flow in Power Engineering, Xi’an Jiaotong University, Xi’an 710049, China
KEYWORDS Flow distribution;Ledinegg instability;Onset of flow excursion;Parallel channels;Regenerative cooling;Scramjet;Supercritical flow
Abstract Flow instability of supercritical hydrocarbon fuel is a crucial issue in scramjet regenerative cooling structure.In this study,flow excursion instability and flow distribution in parallel tubes were experimentally studied for supercritical fluids. Two types of flow excursion occur in a single tube.Type I and Type II excursions,and they are corresponding to decreasing and increasing flow rate respectively. They can trigger flow maldistribution between parallel tubes and the hysteresis phenomenon of flow distribution. The effects of system parameters, including inlet temperature,system pressure, and heat flux, on flow distribution were analyzed. In addition, the relationship between flow excursion and the pseudo-critical interval proposed in the literature was established according to the heated tube outlet temperature at the onset of flow instability. Finally, the flow excursion instability boundary was obtained using two dimensionless parameters.These experimental results can provide helpful insight on the mechanism of Scramjet regenerative cooling.
1. Introduction
Hypersonic aircrafts have attracted global attentions because they are developed by utilizing the advanced propulsion technology. The high speed of the aircraft subjects the engine surface to intense aerodynamic heating as well as combustion thermal load.1Researchers found that the scramjet combustion chamber temperature is up to 3000 K when the Mach number is 6.2While the latest thermal protection composite material can bear a maximum temperature of 2200 K, which means only using the heat resistant material is not feasible to ensure the operation safety of the scramjet.3A method of effectively cooling scramjet engines has become a key technology for flight safety.4-6Regenerative active cooling technology can not only alleviate the scramjet chamber thermal load, but also preheat the fuel and enhance the combustion efficiency.7,8Scholars regard it as one of the most promising thermal protection technologies because of its practicability and superiority.9-11Hydrocarbon fuel was used as coolant of scramjet regenerative cooling structure in the X-51A flight test.12The results indicated that the regenerative cooling technology is feasible to scramjet combustion chamber thermal protection.As a trans-critical process exist in regenerative cooling channels,the flow and heat transfer process of the coolant is extremely complicated.13,14Supercritical hydrocarbon fuel flow instability and heat deterioration have a profound influence on the scramjet regenerative cooling technology.A multichannel structure design has been used in the heated surface of regenerative active cooling systems. The size and design of the structure are closely related to heat distribution and the hydrocarbon fuel cooling process.15Hydrocarbon fuel flows in channels under adverse conditions,such as high temperature and pressure,high heat flux,and high superheat.Hydrocarbon fuel cracks and becomes small molecules also brings a large heat sink. The fluid gas-liquid interface disappeared at a supercritical state. Thus, the fluid thermophysical properties have a drastic variation near the pseudo-critical point. The scramjet cooling system’s supercritical pressure is less prone to uneven flow distribution and heat transfer deterioration near the pseudo-critical temperature.16,17These characteristics of hydrocarbon fuel induce complex hydrodynamic characteristics and flow instability in parallel tubes. The pipe structure,thermal load distribution, and fuel status parameters are crucial factors that influence the flow process.
There are many serious safety problems caused by the flow instability and uniform flow distribution of hydrocarbon fuel,such as a negative influence on the thermal capacity of the heat exchange structure and thermal stress imbalance.In our previous research, the reliability of large plate’s active regenerative cooling structure at rather high heat flux condition was studied. Superheated ablation phenomenon was observed because mass flow rate deviation was found in parallel channels, as showed in Figs. 1(a) and 1(b), where m1and m2are mass flow rate in Tube 1 and Tube 2, respectively, and mallrespresents mass flow rate in summational tube. In addition, the overheated area moved from the end to the middle of the channels suggested a seriously uneven flow maldistribution in the test.Insufficient cooling in scramjet engine will pose a desperate threat to the safety. Fundamental and mechanism research on supercritical fluid flow instability characteristics in parallel tubes is significantly needed to solve this engineering problem.
Flow instability can be classified into two representative types:static instability and dynamic instability;it occurs when the fluid encounters a small disturbance, and the fluid flow shows a state of flow excursion or flow oscillation.Static instability was first proposed by Ledinegg,18which is defined by the cubic curve relation between the pressure drop and mass flow rate relation of a two-phase flow. It is also called the ‘‘hydrodynamic multivalued characteristic curve.” For the multivalued characteristics, scholars had chosen the minimum point as the feature point to study.19-21Many researchers have proposed experimental fitting correlation formulas and theoretical prediction formulas.20,22-25They considered that the minimum point in the hydrodynamic multivalued characteristic curve was approximately equal to the Onset of Flow Instability(OFI). Swapnalee et al.26and Mahmoudi27believed that a drastic change in density is the main factor that causes hydrodynamic multivalued characteristics.According to the effect of system parameters on the hydrodynamic multivalued characteristic curve,various measures have been proposed to restrain multivalued characteristics.28-31Through these measures,increasing the system pressure, increasing the inlet temperature, and decreasing the heat flux were found to cause an increase in the fluid stability. Most researchers have studied supercritical fluid flow instability based on ultra-supercritical boiler and supercritical water-cooled reactor. Supercritical hydrocarbon flow in the scramjet regenerative cooling channels process is similar to the boiler and water-cooled reactor.Many scholars have investigated flow excursion,flow distribution, and flow oscillation characteristics to study the flow instability of supercritical hydrocarbon fuel in regenerative cooling parallel channels both experimentally and numerically.Liu et al.32has defined Static Flow Instability(SFI)to describe hydrodynamic characteristics for supercritical fluid.SFI is similar to the Ledinegg instability caused by some disturbance and trigger to flow excursion.Yang et al.25,33experimentally investigated the flow characteristics of supercritical cyclohexane and concluded that OFI is the minimum point of the hydrodynamic multivalued characteristic curve. They also found that the fluid outlet temperature reached its pseudo-critical temperature at this point. A one-dimensional transient model has been developed in Jin et al.’s investigation.34Their calculation results showed that the negative slope area of the multi-value curve is unstable.Many researchers believe that flow excursion occurs as the system enters the negative slope area of hydrodynamic multi-value characteristic curve29,30,35.

Fig. 1 Abnormal phenomena found in authors’ former regenerative cooling experiments.
Flow instability investigations have been carried out for parallel tubes based on the features of a single tube. In previous flow instability analyses,some scholars used the simulation software to study flow instability. They established a flow instability relationship between single and parallel tubes and obtained a criterion.36-38Wang et al.39conducted an experimental study on boiling fluids in parallel heated tubes. It was concluded that the hydrodynamic characteristic curve could be used to describe the Ledinegg instability in parallel tubes.Pressure drop oscillation occurs when the system is in the negative slope area of the curve, and density drop oscillation occurs in the other area. From their perspective, this phenomenon is attributed to the coupling of static and dynamic instabilities. Chatoorgoon40first used the state equation to predict the flow characteristics. Experimental and simulation studies were conducted by Xiong et al.41,42.Their results show that Ledinegg instability is difficult to observe in parallel tubes.Chen et al.43used a simulation method to analyze supercritical water flow in parallel tubes,and their results show that the factors that impact parallel tubes are similar to those of a single tube. As the flow direction decreases, flow excursion occurs.The results have not been verified experimentally. The threshold of heat flux has also attracted attention.44-47When the heat flux threshold is increased, the flow system becomes more stable.The instability boundary is obtained using the heat flux threshold. By controlling the system parameters, the relationship between the system parameters and flow instability can be established.48-50Approaches to verify if tubes are uniformly heated have also been widely investigated51-54.
The static (Ledinegg) flow instability is described that the flow excursion occurrs as a result of some disturbance, and the flow condition will not go back to the original state. Flow excursion is commonly considered to exist in two-phase flow,and it can be related to the hydrodynamic multivalued characteristic curve. As summarized in Table 1,32,41,42,44-46,48-50,54-58recently study of supercritical flow in parallel channels mostly use SCWR as background. Supercritical water was usually used as the working fluid in parallel and vertical channels.Previous researchers focused on the flow distribution caused by pressure and density oscillations. For supercritical fluid flow in parallel tubes, seldom researchers combine the hydrodynamic multi-value curve with flow distribution to investigate Ledinegg instability. There is no definitive conclusion about flow in parallel tubes—specifically, whether Ledinegg instability exists under supercritical conditions.In addition,compared with the flow in a single tube,there are more factors that affect the flow characteristics in parallel tubes. Further research on the deterioration mechanisms of heat transfer and flow instability is required.6Thus,the exploration of flow characteristics is becoming one of the major directions toward the feasibility and safety design of supercritical hydrocarbon fuel systems.
In this study, the flow excursion was considered to be the phenomenon that Ledinegg instability in parallel channels.Based on the classification of the flow excursion phenomenon by Liu et al.,59-61the hydrodynamic and heat transfer characteristics of supercritical cyclohexane flow in two heated parallel channels were investigated experimentally. Type I and Type II excursions correspond to a decrease and increase in the mass flow rate as showed in Fig. 259respectively, where m is mass flow rate and Δp represent the pressure drop through the pipe.Using the hydrodynamic multivalued characteristic curve, the flow process of two tubes under decreasing and increasing mass flow rates is described.Two types of instability boundary are proposed based on the experimental results.The predictive correlation of the unstable boundary is also presented. These conclusions can provide theoretical guidance for the regenerative active cooling technology of scramjet engines.
2. Experimental system and data reduction
2.1. Experimental system
The experimental system is shown in Fig. 3 and illustrated in Fig. 4. The working fluid through the piston pump (Elite P500+, 0-500 mL/min) flows into the preheated section and is heated to the desired temperature. The flow is divided into two parallel heat tubes through a distribution header. After the test section, the fluid flows back to the main road through the collection header and through the water cooler.Finally,the cooled fluid flows back into the fuel tank for the next circulation.
The temperatures of the inlet and outlet fluids were measured using an armored K-type thermocouple (Omega, 0-590 ℃).Volumetric flowmeters (CX-M5.1-SS, 0-800 mL/min) were used to measure the mass flow rate in parallel tubes. The test section was made of a horizontal stainless-steel tube with an inner diameter of 2.0 mm. Eight K-type thermocouples were equally spaced on the test section of each channel to measure the outside wall temperature.The pressure drop in the test section was measured using a differential pressure sensor (Rosemount 3051CD4, 0-1000 kPa). The data acquisition system consisted of NI 9209,NI 9205,NI 9212,and Keithley 2700.
Cyclohexane with a purity of 99.5wt% was used for the working fluid in this study.The flow excursion and flow distribution phenomena observed under multiple conditions and the operating conditions for all experiments are listed in Table 2.The outlet temperature of the bulk fluid was controlled within 420 °C, and the wall temperature was lower than 540 °C to avoid thermal cracking of the fuel.
2.2. Data reduction
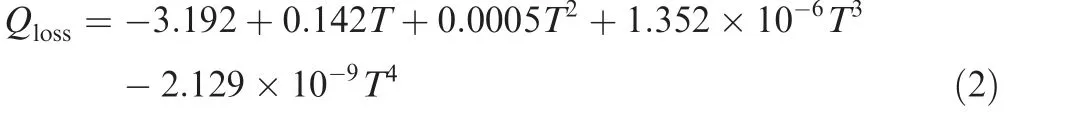
Taking the incompressible potential flow round a cylinder for example, the stream function is to obtain an accurate expression of the heat flux, a preliminary experiment was conducted to calculate the heat loss. The heat flux transformed through the outside surface of the heated test section is obtained using Eq. (1).

where IU is the total input heat,I is the heating electricity current, U represent the heating voltage, q is heat flux of tube, D and L represent the outer diameter and heating length of the tube in the test section, respectively, and Qlossis the heat loss of the test section.

Table 1 Reported supercritical fluid flow in parallel tubes.
Fig.2 Type I and Type II flow excursion defined by Liu et al.59.
The heat loss from the test section was less than 10%of the total power input and was calculated using Eq.(2),and the calculate step is as follows. Firstly, the test section was heated without fluid and the wall temperature and the power applied(the heat loss at this time) was measured and recorded. Secondly, the wall temperature was corresponded to its corresponding heat loss one by one and the Qloss-Twallcurve can be obtained. Finally, Eq. (2) could be obtained from the formula fitting of this heat loss curve:
To verify the reliability of the experiment, a heat balance test was conducted. When the difference in inlet and outlet enthalpy with the heat flux was examined to calculate the heat efficiency, the results indicated that the efficiency of the test section was ~90 %. Then, the experimental data were used to obtain Nuexp(Nusselt number calculated from experimental data), and the experimental results were compared with the classical empirical heat transfer formula.

Fig. 3 Photos of experimental system and parallel test sections.
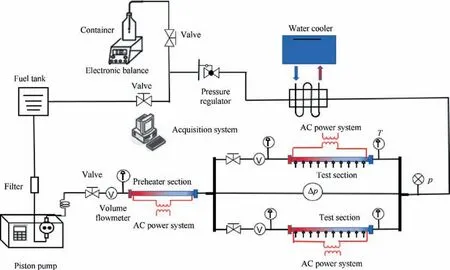
Fig. 4 Schematic diagram of experimental system.
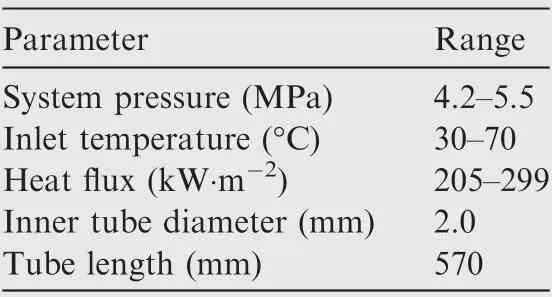
Table 2 Experimental conditions.
The average temperature of the inner wall of the tube can be calculated using the measured heat,tube outer wall temperature,and physical properties of the fluid.The arithmetic average temperature can be considered as the temperature of the fluid,62the heat transfer coefficient of the fluid can be calculated, and then Nuexpcan be obtained.

where Q(x)is internal heat source;d calculated the inner diameter of the tube in the test section;Twi,Tworepresent the inner and outer surface temperatures,respectively;and λ is heat conductivity coefficient.
The heat transfer coefficient can be calculated using the diameter of the inner wall of the tube and the fluid temperature, and then Nuexpcan be calculated using Eq. (5).

where Re is Reynolds number; Prbrepresent the fluid bulk of Prandtl number;and Prwicalculated the Prandtl number of the fluid near the inner wall.
Five groups of data were used for checking; the detailed working condition parameters and calculation results are listed in Table 3, where p is pressure, Qeffrepresent effective heat flux.The error between the experiment and the Gnielinski classical empirical heat transfer formula calculation was within 5 %.
An experimental data deviation analysis was performed.The uncertainty of the directly measured parameters is the equipment precision. The indirect parameter R is calculated from the many directly measured data,Ri.The calculation process produces a transfer error.In this case,the R uncertainty is calculated using Eq. (9):

The heat flux is calculated by the measured power voltage(U) and current (I):

Table 3 Error between experimental data and Gnielinski classical formula.

The uncertainties of all test parameters are shown in Table 4.
2.3. Experimental procedure
Two extremely similar tubes were chosen for the preliminary experiment, and the heat flux of the parallel tubes was almost the same during the experiment.First,the total mass flow rate was decreased (Steps 1-6) to observe Type I excursion, and then the total mass flow rate was increased(Step 7)to observe Type II excursion.Because the total mass flow rate is constant when flow excursion occurs,Type I excursion occurring in one tube results in a sudden mass increase in the other tube. Similarly,Type II excursion occurring in one tube results in a sudden mass decrease in the other tube; thus, the onset of flow excursion can be captured. The detailed experimental process is as follows:
Step 1.Start the pump and ensure that the volume flow rate of the pump is steady.
Step 2. Set the back-pressure valve to the target value.
Step 3.Adjust the preheater AC power to set inlet fuel temperature at the target value.

Table 4 Uncertainty of experimental parameters.
Step 4. Adjust the test AC powers to make heat flux to the target value.
Step 5. When the outlet fuel bulk temperature becomes steady,collect the experimental data,including mass flow rate,heating power, inlet and outlet bulk temperatures, working pressure, pressure drop, and wall temperature. The entire collection period is maintained at ~40 s.
Step 6.Decrease the total mass flow rate and repeat Step 5.As the outlet bulk temperature becomes close to the pseudocritical temperature, minimize the change step of total mass flow rate and observe Type I excursion occurring in every tube.
Step 7. Increase the total mass flow rate and repeat Step 5.As the outlet bulk temperature becomes close to the pseudocritical temperature,minimize the change step of the total mass flow rate and observe Type II excursion occurring in every tube.
Step 8. Change the heat flux, inlet temperature, or system pressure, and repeat Steps 1-7.
3. Results and discussion
3.1. Flow process analysis
To investigate the flow characteristics of flow excursion and uneven flow distribution in parallel tubes, the hydrodynamic multivalue characteristic curve was used to analyze the experimental phenomena. A 4.5 MPa system pressure, 30 °C inlet temperature, and 245 kW/m2heat flux were chosen. Dimensionless time t*is plotted on the X-axis on account of different operating times under every working condition,and t*=tnow/tall(tnowis the real-time corresponding to the experiment and tallis the total experiment time).
There was a small difference between the parallel tubes in the experiment; thus, the internal flow resistances of the two tubes were not exactly the same.In this study,the small difference between the two tubes was ignored to analyze the flow process based on the hydrodynamic characteristic curves. As the total mass flow rate increases or decreases, the fluid in the tube undergoes the following process. Type I excursions are shown in Fig.5,where the number without‘‘'”represents the data points in Tube 1,and the number with‘‘'”represents the data points in Tube 2. Under the same pressure drop constraint between parallel tubes, for the process from 1(1') to 3(3'), the fluid flow was stable in two tubes, and the mass flow rate in both tubes decreased simultaneously within the right positive slope area of the hydrodynamic curves. As the flow reached the minimum point 3(3'),the mass flow rate in parallel started to exhibit a different trend.The mass flow rate in Tube 1 decreased slightly, whereas it increased slightly in Tube 2.When the flow reached 4(4'), Type I excursion occurred in Tube 1,and a sudden mass flow rate increase occurred in Tube 2. From 4(4') to 5(5'), the mass flow rate in Tube 1 continued to increase, and that in Tube 2 continued to decrease, indicating that the flow distribution became more uneven as the total mass flow rate decreased because Tube 1 was located on the negative slope area and Tube 2 on the right positive slope area.For the process from 5(5') to 6(6'), both mass flow rates decreased as the total flow decreased. When the flow in Tube 2 reached the minimum point 6', the mass flow rate in Tube 2 decreased slightly, while that in Tube 1 increased slightly.Type I excursion occurred in Tube 2 when it came to 7',which led to a sudden flow increase in Tube 1. After this excursion,from 8(8')to 9(9'),the mass flow rate in both tubes maintained the same decreasing trend within the left positive slope area.
Following the previous step, the total mass flow rate was increased gradually, as shown in Fig. 6. For the process from 1'(1)to 3'(3),the mass flow rate in both tubes increased simultaneously. As the flow reached the maximum point 3'(3), the mass flow rate in both tubes started to exhibit the opposite trend. The mass flow in Tube 1 decreased slightly, while that in Tube 2 increased slightly, which made the flow distribution slightly uneven. When the flow reached 4'(4), Type II flow excursion occurred in Tube 2, and the flow rate decrease occurred in Tube 1. The uneven flow distribution started to increase after point 4'(4).From 4'(4)to 5'(5),the mass flow rate in Tube 2 continued to increase,while that in Tube 1 showed a slight decreasing trend.For the process from 5'(5)to 6'(6),the mass flow rate in both tubes increased simultaneously because of the positive slope area.When the flow in Tube 1 reached the maximum point 6,Type II excursion occurring in Tube 1 led to a sudden flow rate decrease in Tube 2.From 6(6')to 7(7'), the mass flow rate in Tube 1 kept increasing and that in Tube 2 kept decreasing. The degree of uneven flow distribution decreased distinctly. From 7(7') to 8(8'), the mass flow rate in both tubes increased simultaneously, and the flow distribution was quite uniform because of the right positive slope.
The above-mentioned results of the flow process analysis reveal that the flow path between the decrease and increase in the total mass flow rate is discrepant, which results from the hysteresis phenomenon. The hysteresis phenomenon of flow distribution in this study can be interpreted on the basis of Liu et al.’s research.59Because the hysteresis phenomenon exists in Type I and Type II flow excursions,the flow distribution caused by flow excursion also induces the same phenomenon.Thus,different flow evolutionary processes have different flow distribution results in parallel tubes.

Fig. 5 Flow analysis with hydrodynamic multivalued characteristic curve in decreasing flow rate process.

Fig. 6 Flow analysis with hydrodynamic multivalued characteristic curve in increasing flow rate process.
3.2. Flow characteristic in parallel tubes
3.2.1. Onset of flow excursion
According to the classification by Liu et al.,59OFIIcorresponds to the onset of Type I excursion, and OFIIIcorresponds to the onset of Type II excursion. In this section, the characteristics of Type I and Type II flow excursions are analyzed.
Fig.7 shows the experimental results of different inlet fluid temperatures(Tin)at 4.5 MPa system pressure and 245 kW/m2heat flux. As the flow rate decreased, the fluid outlet temperature was Tout1=281°C at OFII.With the increasing flow rate,the fluid outlet temperature was Tout2=296°C at OFIII.The data imply that at supercritical pressure, flow instability exists when the outlet fluid temperature is approaching the pseudocritical temperature. The drastic property change near the pseudo-critical temperature is one of the elements that causes these phenomena. Density is considered the major parameter of flow instability. The considerable inlet and outlet density difference resulted in the two types of flow excursion and eventually led to flow instability in parallel tubes.
Fig. 8 shows the experimental results of different system pressures at 30°C inlet fluid temperature and 245 kW/m2heat flux. With the increase in the system pressure, both OFIIand OFIIIincreased. As the pressures increased to supercritical pressures, the variation of the thermal property decreased and the pseudo-critical temperature increased. Thus, OFIIand OFIIImoved to a larger temperature according to a higher system pressure. Increasing the system pressure can improve the flow stability of the fluid at supercritical pressure.
There is a drastic property change in the two-phase boiling process. Some scholars have defined the pseudo-critical interval to describe the process from a gaseous to a liquid-like state.Drastic property changes occur in the pseudo-critical interval.64-66Banuti64proposed a method for calculating the pseudo-critical interval. It uses the relationship between enthalpy(h) and temperature. Based on this method and the principle shown in Fig. 9, the following parameters were calculated.


Fig. 7 Effect of inlet fluid temperature on fluid outlet temperature.

In Fig.9,hiG(T )and hL(T )are the tangent lines of the fluid property curve, which are extremely far from the pseudocritical temperature. Therefore, kiGand h0,iGin Eq. (12) were calculated based on the two points chosen extremely far from the pseudo-critical temperature on the fluid property curve obtained from REFPROP 9.0. Furthermore, kLand h0,Lin Eq. (13) was calculated in the same way. Similarly, kpband h0,pbin Eq. (14) were calculated by choosing two extremely close points near the pseudo-critical temperature on the fluid property curve. Tpbin Eq. (14) is the fluid temperature in the quasi-boiling range.
Combining Eqs. (12) - (14), the formula for T+and T-is obtained.

The pseudo-critical interval of cyclohexane under different working conditions was calculated in this study based on the method described above.T-was considered as the outlet fluid temperature of OFIIand T+as the outlet fluid temperature of OFIII.Fig.10 shows the experimental T-and T+.The results of the experimental and computational comparisons are summarized in Table 5. Thus, it can be verified that, as the outlet fluid temperature reaches the onset of the pseudo-critical interval in the total mass flow rate decrease process, Type I excursion occurs.As the outlet fluid temperature reaches the end of the pseudo-critical interval during the process of total mass flow rate increase, Type II excursion occurs.
3.2.2. Flow distribution ratio
The flow distribution in the parallel channels had a sharp jump after flow excursion. The flow distribution ratio (Mi) was defined to understand the flow distribution phenomenon more clearly.
In Eq. (17),the numerator part is the mass flow rate of the two tubes,and the denominator part is the value if the fluid in the two tubes is evenly distributed.Moreover,i=1 and 2 corresponding to the flow deviations of the two tubes.When Miis closer to 1, the system becomes more stable.

Fig. 8 Effect of system pressure on fluid outlet temperature.

Fig. 9 Pseudo-critical interval calculation for cyclohexane at 4.2 MPa based on Banuti’s method.
Fig.11 displays the flow distribution ratio at different inlet fluid temperatures. The system pressure was 4.5 MPa,and the heat flux was 245 kW/m2. The results of the decreased total mass flow rate are shown in Fig. 11(a). The system was stable before the flow excursion, and the flow distribution ratio was almost the same, which suggested that the inlet fluid temperature had negligible influence at this stage. When Type I excursion occurred in Tube 1, there was a sharp change in the flow distribution ratio in the two channels, and the maximum flow distribution difference was reached at the end of the flow excursion. As the Type I excursion appeared in Tube 2, the flow distribution difference between the two channels was reduced. Fig. 11(b) illustrates the flow distribution ratio with increased mass flow rate.In the initial stage,the flow distribution ratio of the two tubes was in a certain range.Similar to the previous process, the flow distribution difference of the two tubes was larger when the Type II excursion occurred in Tube 2. The difference in flow distribution reached its maximum as the flow excursion faded away.The maximum value was different under every inlet fluid condition. When the Type II excursion occurred in Tube 1,there was another sharp change in the flow distribution ratio; in this case, the flow distribution in both tubes was close to 1.

Fig.10 Outlet fluid temperature of OFII and OFIII corresponding to density under all conditions.

Table 5 Deviations of pseudo-critical interval between experiment and theoretical calculations.

Fig. 11 Effect of inlet fluid temperature on flow distribution ratio.
Overall, with increasing inlet temperature, the range of the flow excursion narrowed, and the maximum flow distribution difference decreased.The temperature gradient along the cross section of the tube became flatter at a higher inlet temperature,and the density variation weakened.The increase in the incompressible high-density fluid decreased the flow excursion intensity and increased the system stability.
The outcomes for heat fluxes of 205,245,and 299 kW/m2at a supercritical pressure of 4.5 MPa with an inlet temperature of 30 °C are displayed in Fig. 12. The amplitude of the flow distribution ratio increased as the heat flux increased.The flow distribution ratio changed non-monotonically with heat flux.Under the higher and lower heat flux conditions,the difference between M1and M2was ~0.4. In contrast, under the middle heat flux condition, the difference reached 0.8. The nonmonotonic relationship between flow distribution and heat flux suggests that heat flux not only contributes to changing fluid thermal properties but also influences the flow process, which requires further investigation.
Experiments were conducted at 4.2, 4.8, and 5.5 MPa,30 °C inlet fluid, and 245 kW/m2, and the results are shown in Fig. 13. The values at the different pressures were almost the same. Compared with the fluid inlet temperature and heat flux, the system pressure had a weaker relationship with the flow distribution ratio at supercritical pressure.
3.3. Boundaries of two types of flow excursion
For the two-phase fluid, two dimensionless parameters, subcooling number Nsuband phase change number Npch, were defined to obtain the flow instability boundary. The dimensionless sub-pseudo-critical number, NSPC, and trans-pseudocritical number, NTPC, have similarly been defined for supercritical fluids.

where βpc,cp,pc,hpcrepresent the volumetric expansion coefficient, specific heat capacity at constant pressure, enthalpy at critical pressure, respectively; hinand minrepresent the enthalpy and volume flow rate at the entrance of tube,respectively; NTPCand NSPCare used to obtain the boundaries of OFIIand OFIII. Fig. 14 shows the flow excursion boundary based on the experimental data. The OFIIboundary in the two tubes almost coincided, as for OFIII. This indicates that the instability boundary in a single tube can be used to predict flow excursion occurring in parallel tubes.Based on the experimental data, flow excursion instability boundaries were developed:

The application ranges of the two formulas are as follows:4.2 MPa<p <5.5 MPa,30°C <Tin<70°C,and 205 kW/m2<q <299 kW/m2.
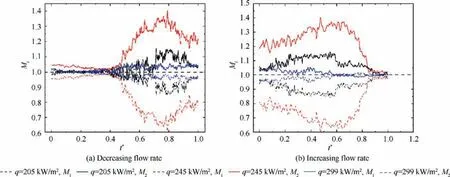
Fig. 12 Effect of heat flux on flow distribution ratio.

Fig. 13 Effect of system pressure on flow distribution ratio.
In addition, the section between the boundary lines constitutes the entire flow instability area,which means a strong uniform flow distribution may appear in this section.When NSPCis a constant,the variation of NTPCon the two boundary lines can qualitatively determine the flow excursion interval. The flow excursion interval decreases with an increase in the system pressure and inlet temperature, which is consistent with the analysis results in Section 3.2.2. Set the scramjet regenerative cooling system’s design point out of the unstable area can enhanced the system flow stability and safety.
The discussion shows that supercritical hydrocarbon fuel flow in regenerative cooling parallel channels comes to a severe uneven flow distribution result. Flow distribution uneven degree enhanced as flow excursion occurs inside the instability boundary.The hydrodynamic characteristics should be considered seriously as well as the fuel heat transfer pattern in the scramjet regenerative cooling system design. It’s a crucial factor to system stability and safety.Channels structure optimization can recede the negative slope area of the multi-value curve. Flow uneven distribution triggered by flow excursion restrained with enhanced system pressure and reduced inlet fluid subcooled degree.The improvement measures mentioned above were got relatively optimized results in our follow-up large active regenerative plate cooling design project. As shown in Fig. 15, the channels’ wall temperature was uniform in the experimental research,which indicated an even flow distribution in parallel channels.In addition, mass flow rate coupling with thermal load between parallel tubes is also a promising way to improve system stability.

Fig. 14 Flow instability boundary based on OFII and OFIII.

Fig.15 Experimental results of optimized cooling structure with our theoretical analysis.
4. Conclusions
Supercritical fluid flow instability is a crucial issue for regenerative active cooling technology. Based on our previous large plate structure design of regenerative cooling system, fundamental investigations on supercritical flow instability in parallel heated tubes were conducted experimentally. New characteristics concerning flow excursion, flow distribution,and OFI were observed. The findings are summarized as follows,and these conclusions have provided theoretical guidance and technical support for the regenerative active cooling design.
(1)Flow excursion occurring in a single tube can trigger the flow maldistribution between parallel tubes. The system has different distribution results during the process of decreasing and increasing the total mass flow rate, indicating that a hysteresis phenomenon occurs during the flow distribution process because of the different paths of Type I and Type II excursions.
(2) A higher inlet fluid temperature is favorable for a uniform flow distribution. The effect of system pressure on the flow distribution is limited.The results above mean that higher inlet fluid temperature and system pressure is favorable to a stable flow in the regenerative cooling system of scramjet.The relationship between the heat flux and flow distribution is nonmonotonic in the current heat flux range.
(3) In view of the pseudo-critical interval proposed in previous research, the outlet fluid temperature at OFIIis close to the left boundary of the interval,and the outlet fluid temperature at OFIIIis close to the right boundary of the interval.Thus, the pseudo-boiling theory is proved to be applicable for interpreting the flow excursion instability of supercritical fluids. Through the calculation of pseudo-boiling temperature interval,the two types excursion boundary can be roughly estimated.The non-uniform flow distribution in parallel tubes can be prevented in the regenerative cooling technology of scramjet.
(4) The flow excursion instability boundary was predicted based on OFIIand OFIIIusing two dimensionless parameters.The same instability boundary can be approximately used for two parallel tubes, which indicates that the instability boundary obtained using a single tube can be used as a prediction criterion for flow excursion in a parallel-tube system. The flow excursion boundaries via two dimensionless number can be used in reliable working conditions design of scramjet.
Declaration of Competing Interest
The authors declare that they have no known competing financial interests or personal relationships that could have appeared to influence the work reported in this paper.
Acknowledgements
This study was co-supported by the Open Fund of Key Laboratory of Power Research of China (No. 2017-III-0005-0029)and the National Natural Science Foundation of China (No.51776167).
杂志排行

CHINESE JOURNAL OF AERONAUTICS的其它文章
- Recent developments in thermal characteristics of surface dielectric barrier discharge plasma actuators driven by sinusoidal high-voltage power
- A review of bird-like flapping wing with high aspect ratio
- Rotating machinery fault detection and diagnosis based on deep domain adaptation: A survey
- Stall flutter prediction based on multi-layer GRU neural network
- Supervised learning with probability interpretation in airfoil transition judgment
- Effects of input method and display mode of situation map on early warning aircraft reconnaissance task performance with different information complexities