Optimum insulation thickness of external walls by integrating indoor moisture buffering effect: a case study in the hot-summer-cold-winter zone of China
2023-01-16YanhaoFENGZitaoYUJiangLUXuXU
Yan-hao FENG, Zi-tao YU,2, Jiang LU, Xu XU
Research Article
Optimum insulation thickness of external walls by integrating indoor moisture buffering effect: a case study in the hot-summer-cold-winter zone of China

1Institute of Thermal Science and Power Systems, Zhejiang University, Hangzhou 310027, China2State Key Laboratory of Clean Energy Utilization, Zhejiang University, Hangzhou 310027, China3School of Civil Engineering and Architecture, Zhejiang University of Science and Technology, Hangzhou 310023, China4Institute of Energy Engineering, China Jiliang University, Hangzhou 310018, China
In the high-humidity, hot-summer-cold-winter (HSCW) zone of China, the moisture buffering effect in the envelope is found to be significant in optimum insulation thickness. However, few studies have considered the effects of indoor moisture buffering on the optimum insulation thickness and energy consumption. In this study, we considered the energy load of an exterior wall under moisture transfer from the outdoor to the indoor environment. An optimum insulation thickness was obtained by integrating the1‒2model. A residential building was selected for the case study to verify the proposed method. Finally, a comparison was made with two other widely used methods, namely the transient heat transfer model (TH) and the coupled heat and moisture transfer model (CHM). The results indicated that the indoor moisture buffering effect on the optimum insulation thickness is 2.54 times greater than the moisture buffering effect in the envelope, and the two moisture buffering effects make opposing contributions to the optimum insulation thickness. Therefore, when TH or CHM was used without considering the indoor moisture buffering effect, the optimum insulation thickness of the southern wall under one air change per hour (1 ACH) and 100% normal heat source may be overestimated by 2.13% to 3. 59%, and the annual energy load on a single wall may be underestimated by 10.10% to 11.44%. The decrease of airtightness and the increase of indoor heat sources may result in a slight reduction of optimum insulation thickness. This study will enable professionals to consider the effects of moisture buffering on the design of insulation thickness.
Insulation thickness optimization; Coupled heat and moisture transfer; Indoor moisture buffering effect; Exterior wall; Lifecycle cost
1 Introduction
The total energy consumption of buildings takes up to 30% of primary energy usage and a suitable insulation thickness of external walls can save about 30% of the total building energy consumption (Fang et al., 2014; Chen et al., 2020). The optimum insulation thickness is often determined by a techno-economic analysis. There are two groups of methods for that analysis: static methods and dynamic methods (Kaynakli, 2012). Static ones, such as the concept of degree day (Ali Kallioğlu et al., 2021), are classic and easy to use. Dynamic methods, such as analytical solutions based on periodic atmospheric temperatures (Zhang et al., 2022) and numerical solutions under more general meteorological conditions (Dlimi et al., 2019; Wang et al., 2019; Geng et al., 2021), can take into account transient changes in outdoor air temperature. However, the role of moisture in the air is often neglected.
The average relative humidity of air in the hot-summer-cold-winter (HSCW) zone is close to 75%–80%. For residential buildings, the high-humidity environment can cause moisture-related health problems such as mould-growth (Woods and Winkler, 2016). In addition, the material in the exterior wall of a residential building can absorb a large amount of moisture. This adsorbed moisture can produce a significant moisture buffering effect in the envelope, thereby increasing the average heat capacity and thermal conductivity of its materials. By calculating the heat, air, and moisture transfer (HAM) equations, it was shown that the moisture transfer can have a significant impact on the assessment of building energy consumption (Tariku et al., 2010; Hens, 2015; Xu et al., 2019; Chung et al., 2020). Moon et al. (2014) investigated the effect of moisture migration on the building performance of a residential apartment by WUFI Plus and showed that the energy consumption was 4.4% higher when moisture buffering effects were considered. Chbani Idrissi et al. (2022) performed an HAM simulation of a residential building in the climate of Tangier by using COMSOL Multiphysics and showed that the annual energy consumption was 15.1% greater than that calculated using the heat transfer model. Recently, a study integrating the HAM and the techno-economic analysis using COMSOL Multiphysics was carried out (Liu et al., 2015). It showed that if the moisture buffering effect in the envelope is not considered, the optimal insulation thickness and energy consumption of a typical residential building in the HSCW zone in China could be underestimated by 3.7%–7.8% and 2.8%–8.4%, respectively.
However, the moisture buffering effect is combined with various other factors, such as temperature and humidity distribution in the indoor and outdoor atmosphere, airtightness, and heating, ventilating, and air conditioning (HVAC) systems (Fang et al., 2022). Specifically, the indoor environmental performance of a residential building in the HSCW zone is shown to be the least satisfactory in China (Li et al., 2018), and the indoor moisture buffering effect can cause high indoor energy consumption and indoor humidity fluctuations (Qin et al., 2009; Woloszyn et al., 2009; Qin and Yang, 2016). Therefore, a comprehensive evaluation of the moisture buffer effect not only needs to consider the moisture buffer inside the envelope, but also needs to consider the indoor moisture buffer effect. Recently, based on the cases of the building energy simulation test (BESTEST), experiments by Zhang et al. (2017) on porous bricks have shown that hygroscopic materials can reduce fluctuations in indoor relative humidity, and thereby reduce dehumidification energy consumption by 25%–30%. Ferroukhi et al. (2015) compared the energy consumption of a residential building in La Rochelle by two types of software: TRNSYS and COMSOL Multiphysics. The results showed the consequences of TRNSYS ignoring the inclusion of indoor moisture effects can cause an underestimation of energy consumption by 51%. Therefore, keeping the indoor temperature and relative humidity constant in the insulation thickness optimization may ignore the indoor moisture buffering effect and have a bias in the optimum insulation thickness, especially in some special buildings with high indoor moisture generation, such as gymnasiums and swimming pools.
Based on the integration of the HAM and the indoor environment model (IEM), Zhou et al. (2020) analyzed the influence of the indoor moisture buffering effect on the average indoor temperature of a typical residential building by using COMSOL Multiphysics. The results indicated that the desorption cooling from hygroscopic materials can reduce the temperature by 1.31 K in the summer. Under the coupled analysis of HAM and IEM, the total energy consumption, as well as the optimum insulation thickness, can be different from that found in the original studies done by traditional static or dynamic methods. However, few studies have been done in the field. Furthermore, it is not certain how the moisture buffering effect in the envelope and indoor moisture buffering effect have a quantitative effect on the optimal insulation thickness of the exterior wall. Therefore, it is necessary to further study the optimization of the insulation thickness by integrating the HAM, the control of HVAC systems, as well as the IEM into the optimization of the insulation thickness. Further consideration can eliminate the performance difference between the design stage and the actual use stage brought about by the constant value of simplified indoor temperature and humidity, and thus obtain a more reasonable optimal insulation layer thickness (Martínez-Mariño et al., 2021).
In this study, a method called HAM-IEM was used, and the1‒2method was used for economic analysis to obtain the optimal insulation thickness. The1‒2method is an economical calculation method that includes lifecycle costs and investment costs. The proposed optimization method can take into account the indoor moisture buffering effect and the moisture buffering effect in the envelope. The optimum insulation thickness in the high-humidity environment in the HSCW zone can be obtained by the proposed method. A comparison was made of different existing optimization methods in the same building and different climate conditions. In addition, the effects of the magnitude of heat sources and airtightness on the optimum insulation thickness were studied.
2 Methodology
The flow diagram of the optimization process by the HAM-IEM is shown in Fig. 1. The HAM model (in light blue) and IEM (in orange) were combined and co-calculated to obtain the energy loadscandh. The control of the HVAC system was integrated into the IEM. The combination of HAM and IEM was implemented by the heat and moisture exchange at the inner surface of the exterior wall. Specifically, the heat convection coefficientiwas determined by

whereiambandiare the temperatures of the indoor environment and interior surface of the wall, respectively. The water vapour transfer coefficientv,iwas demonstrated by the Lewis analogy.
Then, the1‒2method was chosen for the economic analysis and determination of the optimum insulation thickness. The HAM is described in Section 2.1, the IEM is described in Section 2.2, the combination strategy is described in Section 2.3, and the economic method is described in Section 2.4.
2.1 HAM model
An HAM model was developed to reflect the effect of the outdoor environment and, especially, that of humid air on choosing the optimum insulation thickness. The HAM model consists of a moisture transfer equation, an air transfer equation, and a thermal transfer equation. These equations are derived under the assumptions (Xu et al., 2019): (1) that the materials are homogenous, continuous, and isotropic; (2) that hysteresis and chemical reactions are neglected; (3) that the wall can be simplified as a 1D segment.
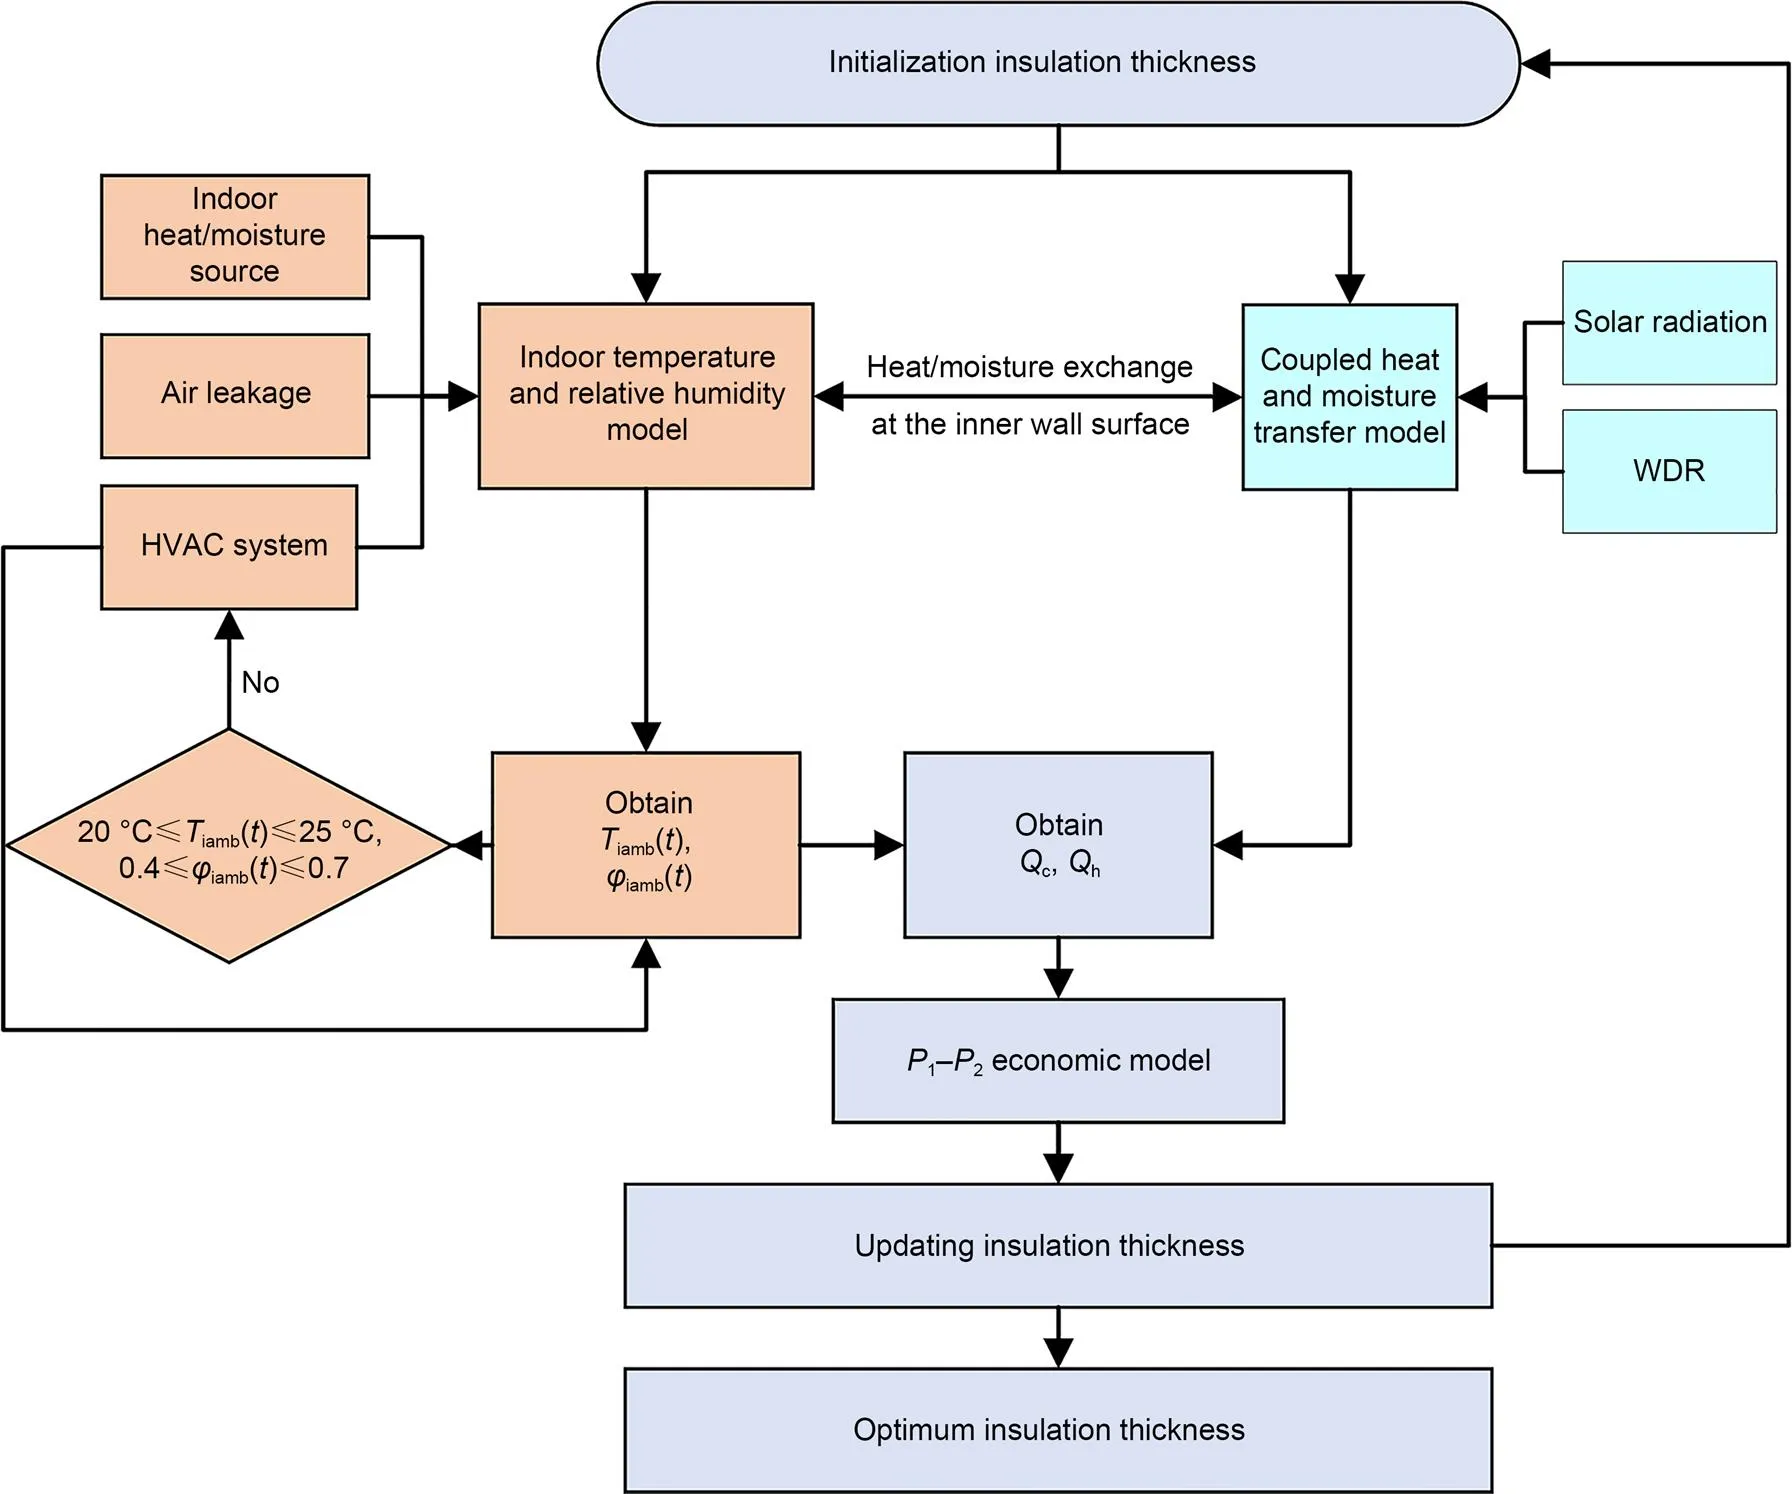
Fig. 1 Flow chart of the optimization integrated with the indoor environment. WDR refers to the wind-driven rain, φiamb is the relative humidity, t is the time, and Qc and Qh are the annual energy loads of a wall in the cooling season and heating season, respectively. References to color refer to the online version of this figure
2.1.1Governing equations


2.1.2Boundary conditions
Fig. 2 is a schematic diagram of the boundary conditions in the study. The boundary conditions consist of outdoor and indoor parts.
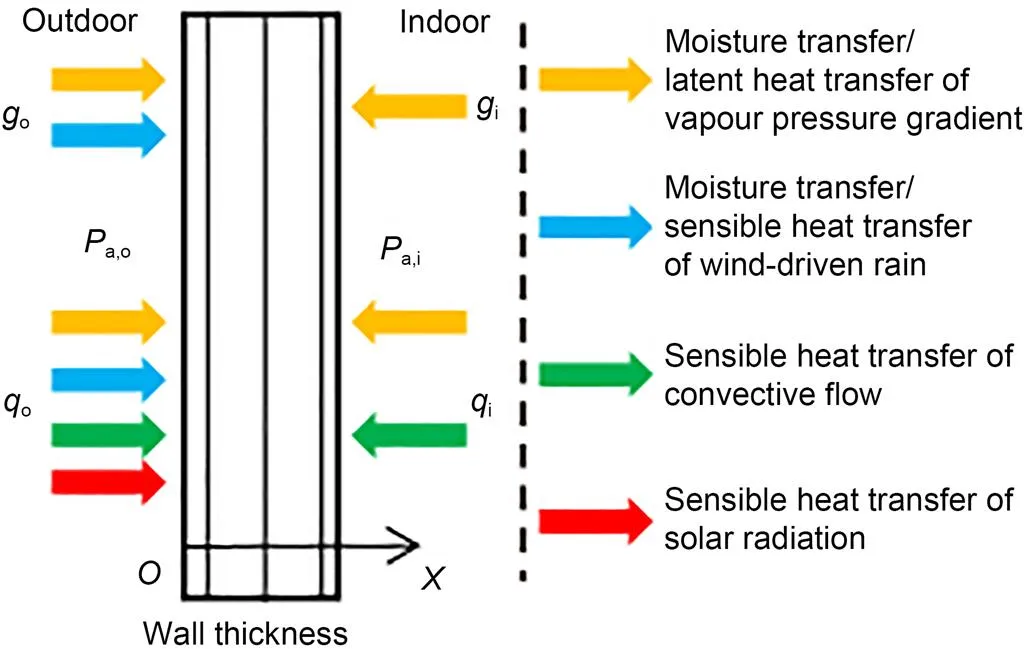
Fig. 2 Schematic diagram of the numerical domain and boundary conditions of HAM. q is the heat flow, and the subscripts o and i refer to the exterior surface and the interior surface of the wall, respectively
2.1.2.1Outdoor boundary conditions
The outdoor boundary conditions, which include the moisture, air, and heat exchanges on the exterior surface of the wall, are expressed as:

whereandvare the heat convection coefficient and water vapour transfer coefficient, respectively;=0.6 is the solar absorptivity;radiis the received solar radiation on the wall; the subscript amb refers to the outside environment. In this study,o23.26 W/(m2·K),v,o=1.79×10-7s/m,=2500-2.4kJ/kg, the saturated vapour pressurebvis a function of the temperature.=0.01 is the infiltration coefficient of WDR according to ASHRAE 160;WDRis the WDR intensity calculated by Trindade et al. (2021):

whereavg=0.44,R=0.83,T=1,=0.7, and=0.4 are coefficients;10is the wind velocity at 10 m;his the rainfall intensity andis the included angle between the normal of surface and wind direction. All the meteorological parameters (amb,amb,amb,radi,h,and the wind direction) were obtained from the National Oceanic and Atmospheric Administration (NOAA) database (NOAA, 2001).
2.1.2.2Indoor boundary conditions
The indoor boundary conditions, which include the moisture, air, and heat exchanges on the interior surface of the wall, are expressed as:

where Δis the pressure difference between indoor and outdoor atmosphere; the subscript iamb refers to the indoor environment. It is noted that the indoor temperatureiamband relative humidityiambremain to be determined in the IEM.
2.1.3Validation of HAM
The HAM model proposed in this study is validated with heat, air, and moisture standardization (HAMSTAD) benchmarks #4 and #5. The detailed information about HAMSTAD benchmarks #4 and #5 can be referred to elsewhere (Hagentoft et al., 2004). Figures related to the comparisons can be seen in Section S2 of the ESM. The mean absolute errors (MAEs) between the results of the HAM model and the results in the HAMSTAD project #4 are 3.41 kg/m3(exterior) and 15.26 kg/m3(interior). The MAE between the results of the HAM model and the results in the HAMSTAD project #5 is 3.02 kg/m3. Therefore, the proposed model has a good agreement with the benchmarks.
2.2 IEM model
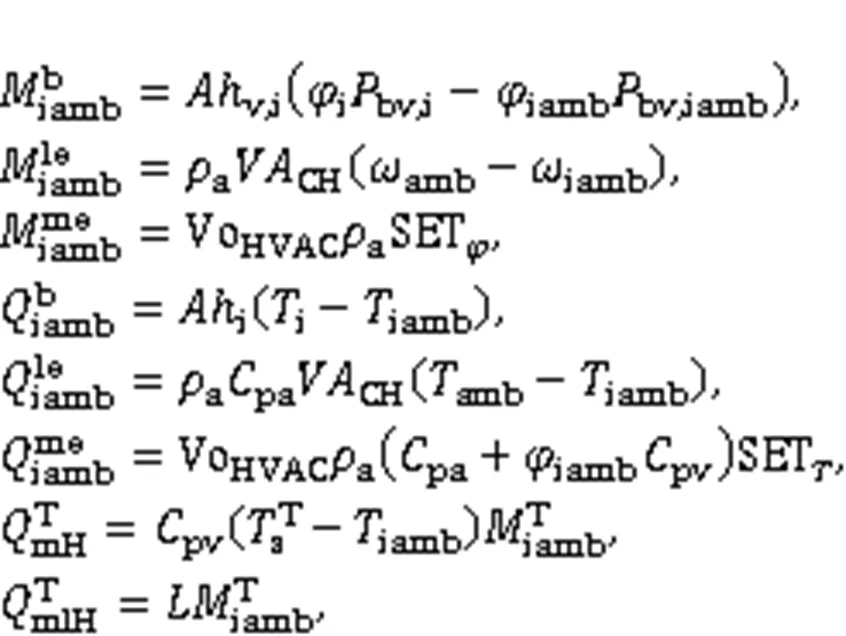
To reflect the influence of the indoor environment (e.g., indoor temperature and relative humidity) on the optimization of insulation thickness, an IEM model is presented in this section. The HVAC systems, indoor heat and moisture sources, and air leakage (airtightness) are considered in the IEM. To increase the efficiency of optimization, the IEM in this study is a reduced-order model that neglects the influence of airflow and buoyancy. As shown in Eq. (8), the IEM model can be written in the form of indoor temperature and relative humidity based on the heat and moisture balance equations, whereis the total volume of the room,is the humidity ratio,iambandiambare indoor moisture source and heat source, respectively,mHandmlHare respectively the sensible and latent heat caused by moisture sources, and the superscript T refers to source types, in which b, le, me, oc, and r are the exchanges between the indoor air and hygroscopic wall, outside atmosphere (air leakage), HVAC systems, occupants/other types of mechanical systems, and direct radiation through windows, respectively.

iamb,iamb,mH, andmlHin Eq. (8) can be further presented as:
and


The opening of doors and windows is impractical in an air-conditioned room, and the heat and moisture sources such as the water reservoir, wet surfaces, and airflow through the windows are small. Therefore, compared to the indoor model proposed by Tariku et al. (2010), the terms of moisture and heat sources were simplified in the IEM model in this study. Besides, the validation of the IEM model can be found in (Rode et al., 2006; Tariku et al., 2010).
2.3 Calculation strategy
2.3.1Energy loads of a single wallcandh
The annual energy loads of a wall in the cooling seasoncand in heating seasonhwere calculated by:

wherecandhare the instantaneous transmission loads of cooling and heating, respectively; Nchand Nhh are the total hours in the cooling season and heating season, respectively; the superscript + represents that only the positive values are added.iandiambare time-dependent variables. The cooling season is from June 15 to Aug. 31, and the heating season is from Dec. 1 to Feb. 28(MOHURD, 2010).
2.3.2Calculation settings
The HAM-IEM was calculated by the commercial software COMSOL Multiphysics. The transient module and the incident module were used in the numerical calculation and control of the HVAC system, respectively. Since the dimension of the IEM model is zero-dimension, the boundary ordinary differential equation module was used to calculate the lumped indoor temperature and relative humidity. The time step for calculation was set as 10 min.
It should be noted that although the indoor environment is controlled by HVAC systems, the fluctuations and deviations of indoor temperature/relative humidity to the set points can still exist in reality. The HVAC system was set as activated during the cooling or heating season and closed during the non-cooling-or-heating seasons. The humidification/dehumidification system in HVAC was set as open when the relative humidity was beyond the range of 0.4–0.7, and the delay time for the switch on/off was set as 30 min. The control system of HVAC was implemented within the incident module of COMSOL Multiphysics, and the tolerance of the incident is set as 0.001. In the incident module, the implicit event interface is used to control the switch on/off, and the indicator state interface is used to define the set-points in Eq. (10).
2.4 P1‒P2 method
The1‒2method was used for the economic analysis (Duffie and Beckman, 1991). The ratio of life cycle energy cost (1), the ratio of life cycle expenditure (2), the total lifecycle cost which contains operation costs and investment costs (LCT), and the annual energy saving per unit area by the insulation material (AES) can be solved by:

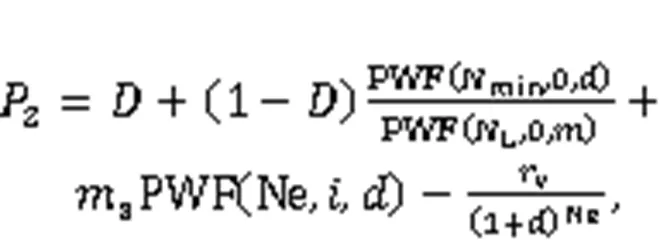


where PWF is the function of present worth factor;andare the fuel price inflation rate and market discount rate, respectively; Ne is the total time of economic analysis;is the percent of down payment;is the mortgage interest rate;sandvare the ratio of annual maintenance cost to initial investment and the ratio of resale price to initial investment, respectively;Eandinsare the electrovalence and insulation costs, respectively;insis the insulation thickness;Landminare the period of mortgage payments and the period of maturity, respectively; EER andare the energy efficiency ratios of the cooling system and the heating system, respectively.
To simplify the optimization, and to highlight the boundary effects, taxation in the1‒2model was ignored in this study. Table 1 lists the values in the1‒2model (Liu et al., 2015).

Table 1 Values of parameters in the economic model (Liu et al., 2015)
NA represents that the parameter is not needed in the calculation when=1
3 Case study
3.1 Description

3.2 Results


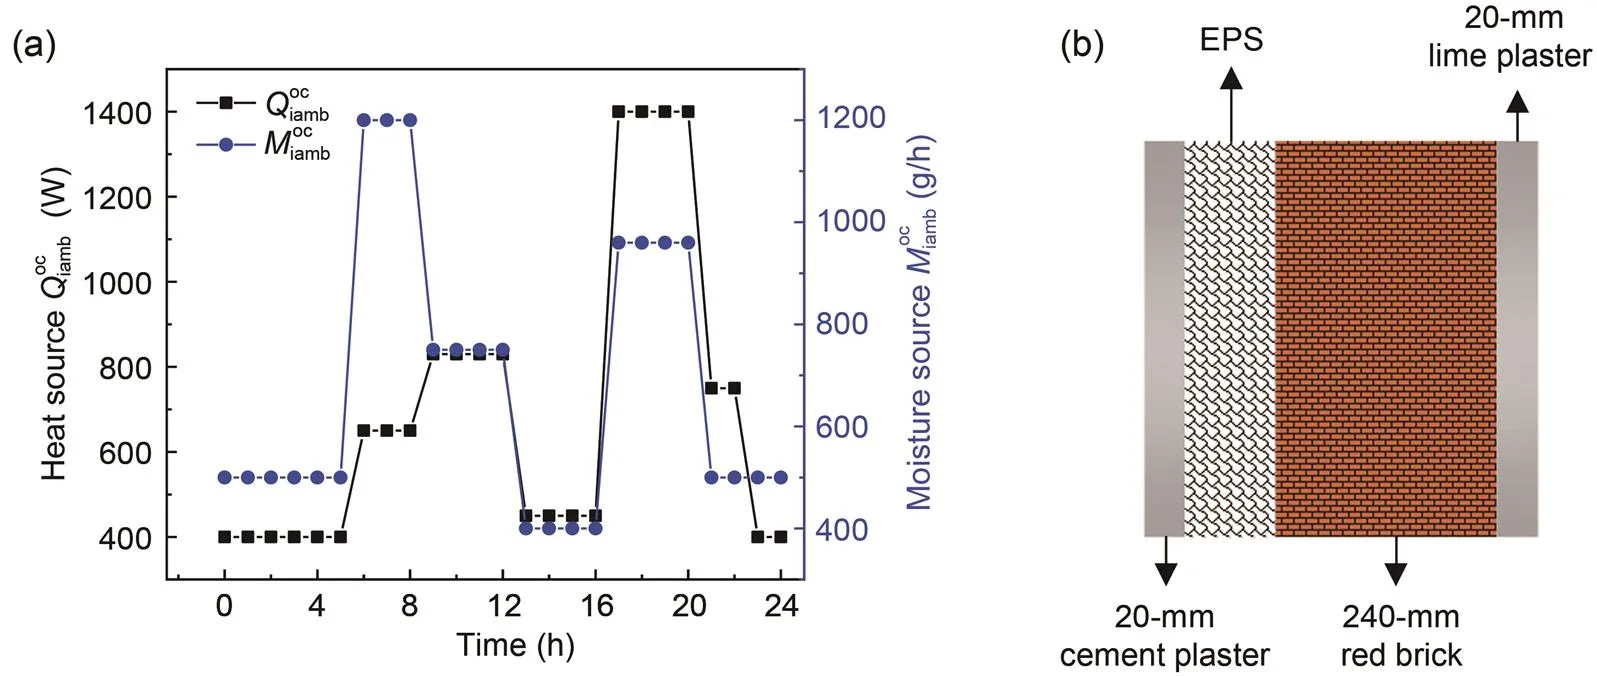
Fig. 3 Schematic diagrams of the case: (a) indoor heat and moisture sources (Tariku et al., 2011); (b) schematic diagram of the wall envelope. EPS represents the expanded polystyrene insulation
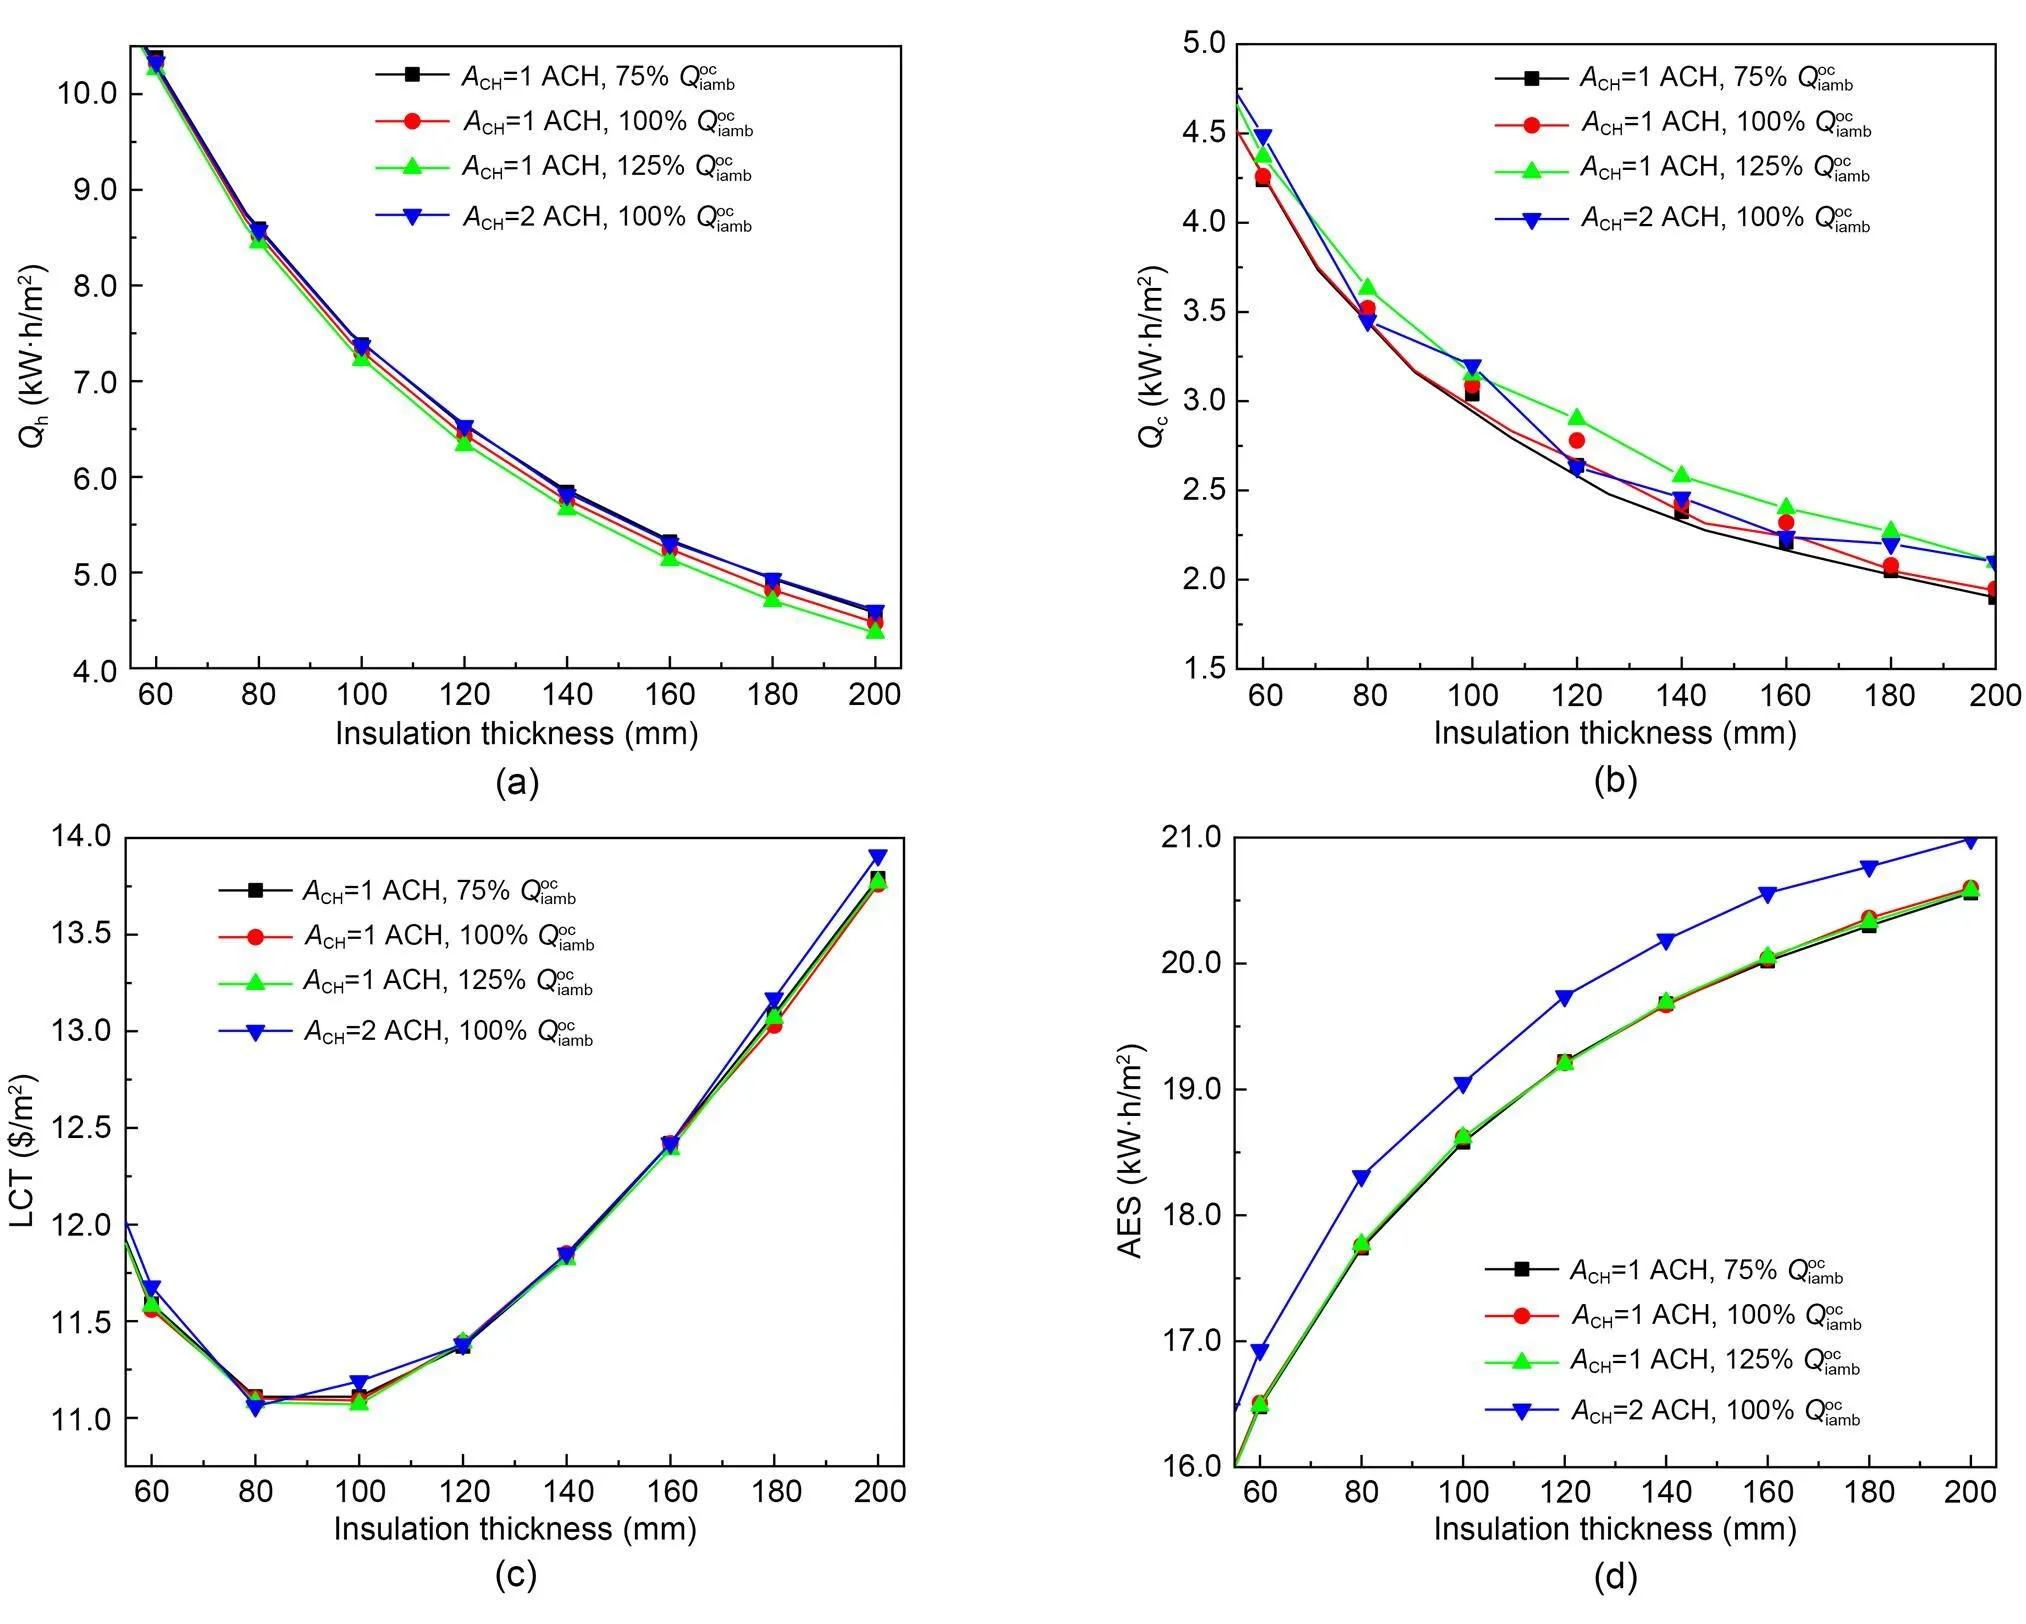
Fig. 4 Calculation results for different levels of airtightness and indoor heat sources of occupants: (a) annual energy loads of a wall in heating season; (b) annual energy loads of a wall in cooling season; (c) LCT; (d) AES

Table 2 Comparison of calculation results with different levels of indoor heat sources of occupants and airtightness in Fig. 3a


Fig. 5 Calculation results for ACH=1 ACH and 100% in Fig. 3a by using different indicators
3.3 Comparison with other transient optimization methods
There are several widely-used transient optimization methods for the insulation thickness of the exterior wall, such as the transient heat transfer model (TH) and the coupled heat and moisture transfer model (CHM).
The TH only takes account of the heat transfer process of a single wall by calculating the heat transfer equations. The outdoor boundary conditions of the TH consist only of the convection flow and solar radiation, while the indoor boundary condition is the constant temperature (Dlimi et al., 2019; Wang et al., 2019; Geng et al., 2021). The CHM takes account of the heat and moisture transfer of a single wall (Liu et al., 2015). The outdoor boundary conditions further consist of the moisture convection and WDR, while the indoor boundary conditions (indoor temperature and relative humidity) are set as constant (Tunçbilek et al., 2022).
Fig. 6 shows the results of the TH and CHM. The results of CHM indicate the similarcand slightly higherhwhen compared with the results of CHM. Meanwhile, the LCT and AES curves obtained by the CHM can be higher than the ones obtained by the TH. However, it is clearly shown in Fig. 6a that thecandhcalculated by the HAM-IEM are higher than the results of the two other methods as the insulation thickness increases. In Fig. 6b, it can be seen that the LCT and AES calculated by the HAM-IEM deviate from the results of two other methods.
Table 3 and Fig. 7 are the comparison of the optimum insulation thicknesses calculated by three methods. The three enlarged points in Fig. 7 refer to the LCTs with optimum insulation thicknesses by different methods. It can be seen from Fig. 7 and Table 3 that the optimum insulation thicknesses obtained from the TH and the CHM are overestimated by 2.13% and 3.59% compared with those from the HAM-IEM in this study; the annual energy loads on a single wall (c+h) are underestimated by 11.44% and 10.10% compared to those from using the HAM-IEM; the values of the minimum LCT at the optimum insulation thickness are underestimated by 6.24% and 4.71% compared to those from the HAM-IEM; the values of AES at optimum insulation thickness are overestimated by 8.91% and 10.83% compared to those from using the HAM-IEM. Liu et al. (2015) found that the optimum insulation thickness can be underestimated by 3.7%–7.8% if no moisture transfer in the wall is considered. However, in this study, the underestimation is only 1.3 mm (about 1.41%), which may be because of the different climate of the chosen cities.
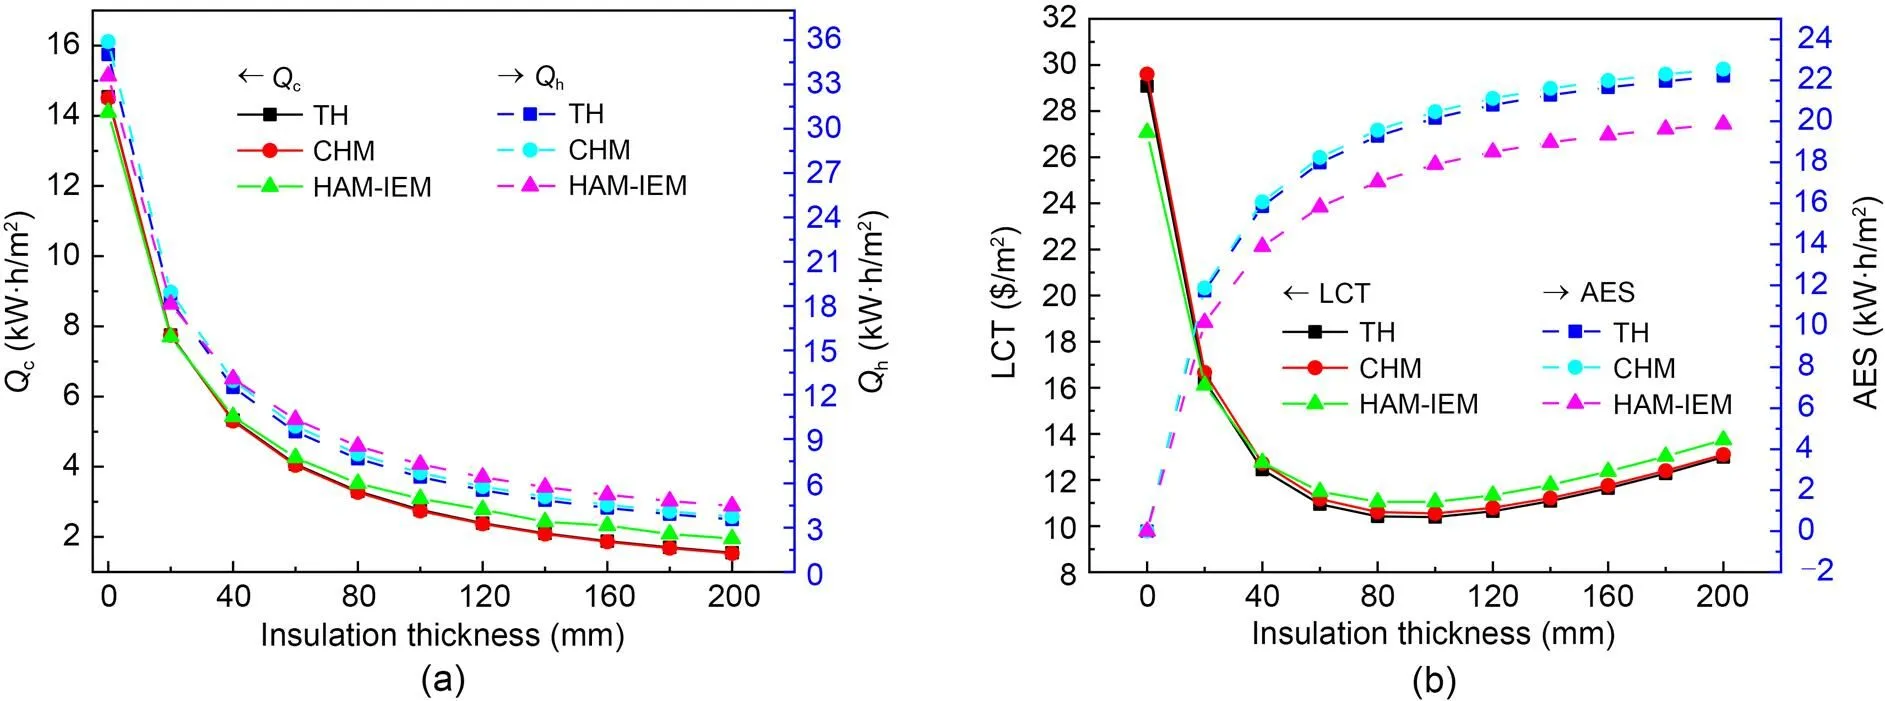
Fig. 6 Results of different transient optimization methods: (a) annual energy loads of a wall in the cooling and heating seasons; (b) LCT and AES
Therefore, although all the cities in the literature (Liu et al., 2015) and this study are in the HSCW zone of China, the influence on the optimum insulation thickness caused by moisture transfer in the wall can still vary greatly. Moreover, Table 3 indicates that the indoor moisture buffering effect on the optimum insulation thickness is 3.59% ((92.40‒89.20) mm/89.20 mm), while the effect caused by the moisture buffering in the wall is 1.41% ((92.40‒91.10) mm/92.40 mm). The indoor moisture buffering effect is about 2.54 times larger than the moisture buffering effect in the exterior envelope. It is suggested that the indoor environment, such as the indoor temperature and relative humidity, should be considered when optimizing the insulation thickness of the exterior wall.
3.4 Discussion
The new HAM-IEM methodology proposed in this study can be applied to different combinations of occupants, airtightness, and configurations of the HVAC system. It can be used in different micro-climate buildings with different controlled systems. The proposed methodology can help with the personalised thermal design of a building within a specific city. The combination of HAM and IEM is easy to calculate numerically.
3.4.1Average indoor temperature and relative humidity
The average indoor temperature and relative humidity are not constants in HAM-IEM (Fig. 8), and they can affect the calculation of energy consumption in Eq. (11).
It can be observed in Fig. 8a that the average indoor temperature under different insulation thicknesses is always higher than 298.15 K (constant) in the cooling season and lower than 293.15 K (constant) in the heating season. From Fig. 8b, the average indoor relative humidity under different insulation thicknesses is always lower than 0.7 (constant) in the cooling season and higher than 0.4 (constant) in the heating season. Besides, the variation becomes steady as the insulation gets thicker. Therefore, it is inappropriate to set the indoor temperature and relative humidity as constants in the optimization of insulation thickness.
3.4.2Moisture buffering effect in the envelope
It is known that the moisture transfer in the wall can lead to an extra latent heat flow. The total heat capacity, as well as the buffering effect, is increased due to the moisture transfer (Liu et al., 2015). This latent heat flow is more pronounced during the heating season when the indoor temperature is lower (Table 4). Therefore, the energy consumption optimized by the CHM is higher than that optimized by the TH for all insulation thicknesses. In addition, the thinner the insulation, the greater the increase of energy consumption, which indicates that the moisture buffering effect is strong when the insulation thickness is small.
The LCT curve in Fig. 7 shows the same variation pattern as the energy consumption with the same investment cost. Therefore, the minimal value of the LCT curve is shifted to the side with larger insulation thickness. The optimum insulation thickness optimized by the CHM is shifted to the side of high insulation thickness and is higher than that optimized by the TH.

Table 3 Comparison of results with different transient optimization methods

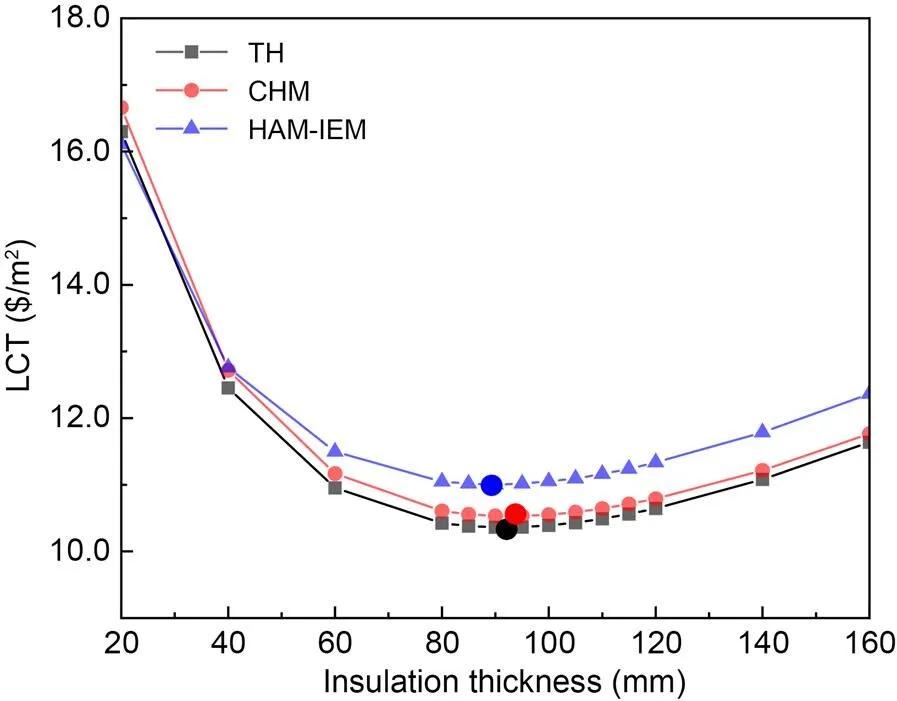
Fig. 7 Comparison of LCT and optimum insulation thickness with different transient optimization methods
3.4.3Indoor moisture buffering effect
In the HAM-IEM, the indoor humidity buffer effect is considered based on the CHM.
As can be seen from Table 4, the energy consumption is smaller than that calculated by the CHM when the insulation thickness is less than 20 mm (cooling season) and 40 mm (heating season). The reduction in energy consumption is due to these factors: (1) the temperatures at the interior surface of walls calculated by the CHM and the HAM-IEM are almost equal during the cooling season, while the temperatures at the interior surface of walls calculated by the HAM-IEM are higher during the heating season (Fig. 9); (2) the average indoor temperatures calculated by the HAM-IEM are higher or lower than those calculated by the CHM during the cooling or heating season (Fig. 8). Therefore, according to the definition ofcandhin Eq. (11), the energy consumption of HAM-IEM is lower. By contrast, when the insulation is thicker, the energy consumption is greater than that calculated by the CHM, which also can be explained according to Figs. 8 and 9.
It is demonstrated that the energy consumption calculated by HAM-IEM does not increase for every thickness. Contrary to the moisture buffering effect in the envelope (Section 3.4.2), the thicker the insulation, the greater the increase of energy consumption as well as the indoor moisture buffering effect and the LCT curve. As a result, the minimal value of LCT curve is shifted to the side with the smaller insulation thickness, and that shift leads to a decrease in the optimal thickness. When the insulation is thicker, the relative percentage increase in energy consumption caused by the indoor moisture buffering effect is larger. Besides, when the insulation thickness is low, the indoor temperature and humidity cannot be considered as constant values, and the energy consumption will be lower than that obtained by the TH and CHM (Fig. 8).
The results in Fig. 8 and Table 4 also show that large deviations from the optimum insulation thickness come from small differences in the average indoor temperature, and that small differences in indoor temperature should not be ignored in the optimization. Thus, just like the heat transfer from the external atmosphere and the indoor heat source, the buffering effect of moisture can be viewed as a "two-sided" process. On the one hand, the moisture transfer from the outside atmosphere can increase the optimal insulation thickness due to the buffering effect. On the other hand, the moisture transfer from the indoor atmosphere can have an adverse buffering effect on the optimum insulation thickness. The two buffering effects are in opposite directions. Therefore, as the thickness of insulation increases, it is more difficult for moisture from the indoor atmosphere to escape, requiring more energy load with the larger overall heat capacity.
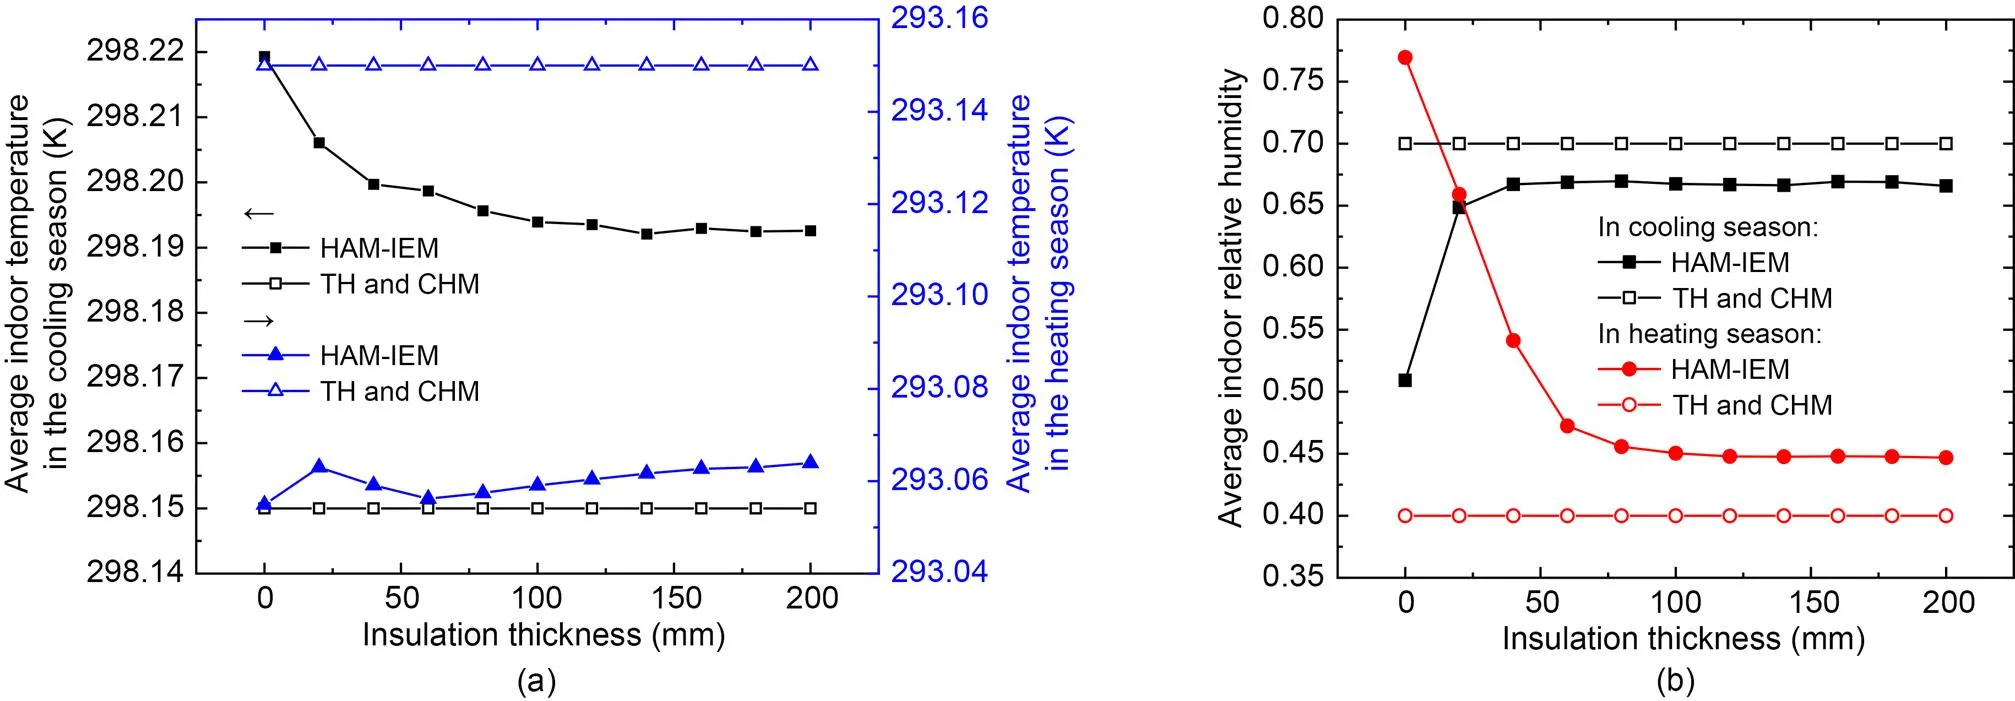
Fig. 8 Average indoor parameters in HAM-IEM: (a) indoor temperature; (b) indoor relative humidity
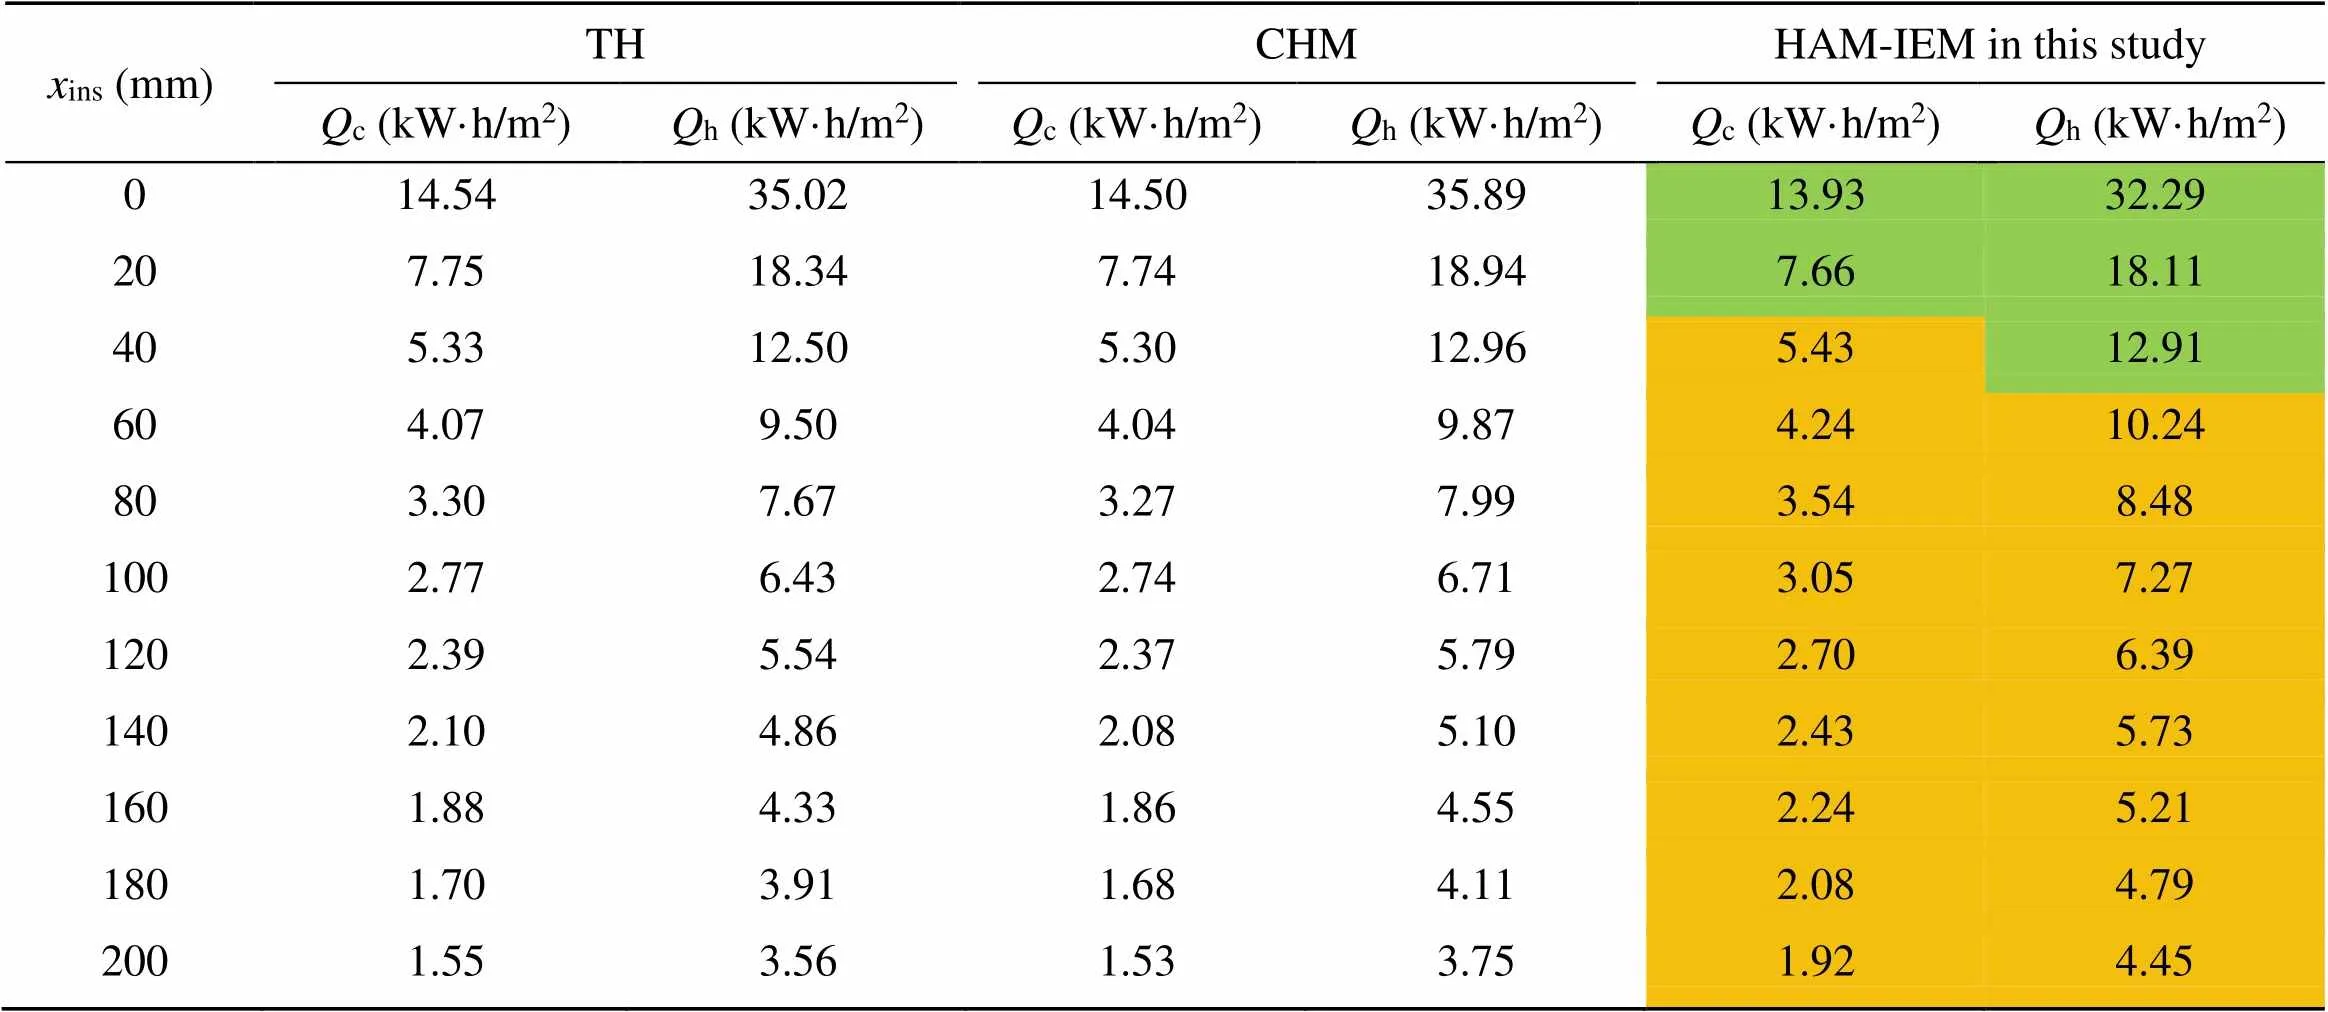
Table 4 Comparison of Qc and Qh in different cases and optimization methods*

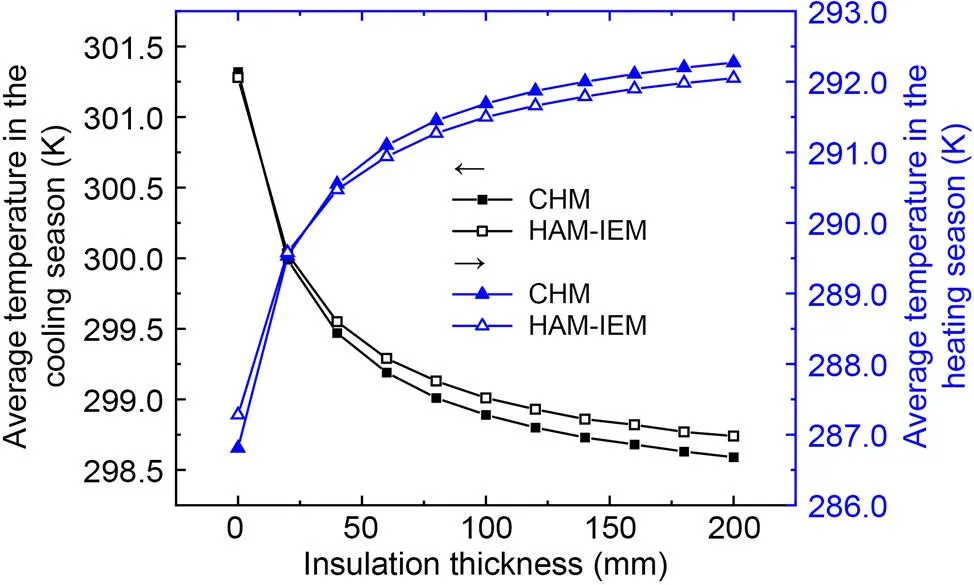
Fig. 9 Average temperature on the interior surface of the wall in the cooling and heating seasons
The results indicate that the outward movement of the indoor heat and moisture can be hindered as the insulation layer is over-thickened, which can worsen the indoor environment and reduce thermal comfort (Olivieri et al., 2017; D'Agostino et al., 2019). It is suggested that HAM-IEM should be used to further investigate the optimum insulation thickness in various climate and building cases. Furthermore, it should be noted that since the moisture buffering effects of the indoor environment and the wall are opposite, the role of the moisture buffering effect in the envelope should not be over-emphasized in the optimization of insulation thickness (Fang et al., 2022).
Due to the counteraction of the moisture buffering effects that take place in the exterior wall and the indoor environment, excessive consideration of the insulation thickness can result from neglecting the indoor heat sources as well as the indoor moisture sources. Meanwhile, the study also suggests that the effect of moisture transfer in the optimization of insulation thickness is smaller than that has been previously thought. It should be noted that the effect of the moisture buffering effect in the envelope on the optimum insulation thickness (1.41%) is much lower than that in the previous study (3.7%–7.8%) (Liu et al., 2015), which indicates a different intensity of buffering occurs in the same climate zone. This should be further studied.
4 Conclusions
In this study, with consideration of the indoor moisture buffering effect, a new methodology, the HAM-IEM, is proposed to obtain the optimum insulation thickness of exterior walls in the HSCW zone in China. The airtightness, HVAC systems, and activities of the occupants were considered for the time-dependent indoor environment to represent reality. Some conclusions can be drawn from this study:
(1) The optimum insulation thickness obtained by TH or CHM may be overestimated by 2.13%–3.59%; the annual energy loads on a single wall (c+h) may be underestimated by 11.44% and 10.10%; the minimum values of LCT at the optimum insulation thickness may be underestimated by 6.24% and 4.71%; the values of AES at the optimum insulation thickness may be overestimated by 8.91% and 10.83%.
(2) The two moisture buffering effects, the moisture buffering effect in the envelope, and the indoor moisture buffering effect, have the opposite effect on the optimum insulation thickness. The indoor moisture buffering effect is about 2.54 times greater than the moisture buffering effect in the envelope.
(3) The airtightness and indoor heat sources have a slight influence on the optimum insulation thickness, while the AES is higher for a largerCH.
(4) Two indicators of energy loads (the energy loads of a wallc/hand the heat source of the HVAC system) behave similarly in the optimization of insulation thickness.
In the future, the new methodology can be optimized for different climate zones and personalized indoor environments (Meng et al., 2015). As the personalized energy management system becomes popular, the users' behaviour and thermal comfort indices should be taken into consideration more carefully. As a result, the variance of indoor temperature and relative humidity becomes an unsteady process (Elmaz et al., 2021), and the optimum insulation thickness may be different from what has hitherto been believed.
Acknowledgments
This work is supported by the National Natural Science Foundation of China (Nos. 51978623 and 52076189).
Author contributions
Yan-hao FENG: investigation, conceptualization, data curation, methodology, software, validation, and writing–original draft. Zi-tao YU: project administration, supervision, and writing–review & editing. Jiang LU: project administration, supervision, and writing–review & editing. Xu XU: supervision.
Conflict of interest
Yan-hao FENG, Zi-tao YU, Jiang LU, and Xu XU declare that they have no conflict of interest.
Electronic supplementary materials
Sections S1–S5
Ali Kallioğlu M, Sharma A, Chinnasamy V, et al., 2021. Optimum insulation thickness assessment of different insulation materials for mid-latitude steppe and desert climate (BSH) region of India. Materials Today: Proceedings, 44:4421-4424. https://doi.org/10.1016/j.matpr.2020.10.590
ASHRAE (American Society of Heating, Refrigerating and Air Conditioning Engineers), 2016. Criteria for Moisture Control Design Analysis in Buildings, ASHRAE Standard 160:2016. ASHRAE, Atlanta, USA.
BSI (British Standards Institution) , 2012. Hygrothermal Performance of Building Components and Building Elements. Internal Surface Temperature to Avoid Critical Surface Humidity and Interstitial Condensation. Calculation Methods, BS EN ISO 13788:2012. BSI Standards Limited, London, UK.
Chbani Idrissi Y, Belarbi R, Ferroukhi MY, et al., 2022. Development of a numerical approach to assess the effect of coupled heat and moisture transfer on energy consumption of residential buildings in Moroccan context. Journal of Building Physics, 45(6):774-808. https://doi.org/10.1177/17442591211056068
Chen S, Zhang GM, Xia XB, et al., 2020. A review of internal and external influencing factors on energy efficiency design of buildings. Energy and Buildings, 216:109944. https://doi.org/10.1016/j.enbuild.2020.109944
Chung D, Wen J, Lo LJ, 2020. Development and verification of the open source platform, HAM-tools, for hygrothermal performance simulation of buildings using a stochastic approach. Building Simulation, 13(3):497-514. https://doi.org/10.1007/s12273-019-0594-5
D’Agostino D, De’Rossi F, Marigliano M, et al., 2019. Evaluation of the optimal thermal insulation thickness for an office building in different climates by means of the basic and modified “cost-optimal” methodology. Journal of Building Engineering, 24:100743. https://doi.org/10.1016/j.jobe.2019.100743
Dlimi M, Iken O, Agounoun R, et al., 2019. Energy performance and thickness optimization of hemp wool insulation and air cavity layers integrated in Moroccan building walls’. Sustainable Production and Consumption, 20:273-288. https://doi.org/10.1016/j.spc.2019.07.008
Duffie JA, Beckman WA, 1991. Solar Engineering of Thermal Processes. Wiley, Hoboken, USA, p.475-478.
Elmaz F, Eyckerman R, Casteels W, et al., 2021. CNN-LSTM architecture for predictive indoor temperature modeling. Building and Environment, 206:108327. https://doi.org/10.1016/j.buildenv.2021.108327
Fang JZ, Zhang HB, Ren P, et al., 2022. Influence of climates and materials on the moisture buffering in office buildings: a comprehensive numerical study in China. Environmental Science and Pollution Research, 29(10):14158-14175. https://doi.org/10.1007/s11356-021-16684-3
Fang ZS, Li N, Li BZ, et al., 2014. The effect of building envelope insulation on cooling energy consumption in summer. Energy and Buildings, 77:197-205. https://doi.org/10.1016/j.enbuild.2014.03.030
Ferroukhi MY, Djedjig R, Belarbi R, et al., 2015. Effect of coupled heat, air and moisture transfers modeling in the wall on the hygrothermal behavior of buildings. Energy Procedia, 78:2584-2589. https://doi.org/10.1016/j.egypro.2015.11.293
Geng YC, Han X, Zhang H, et al., 2021. Optimization and cost analysis of thickness of vacuum insulation panel for structural insulating panel buildings in cold climates. Journal of Building Engineering, 33:101853. https://doi.org/10.1016/j.jobe.2020.101853
Hagentoft CE, Kalagasidis AS, Adl-Zarrabi B, et al., 2004. Assessment method of numerical prediction models for combined heat, air and moisture transfer in building components: benchmarks for one-dimensional cases. Journal of Thermal Envelope and Building Science, 27(4):327-352. https://doi.org/10.1177/1097196304042436
Hens HLSC, 2015. Combined heat, air, moisture modelling: a look back, how, of help? Building and Environment, 91:138-151. https://doi.org/10.1016/j.buildenv.2015.03.009
Kaynakli O, 2012. A review of the economical and optimum thermal insulation thickness for building applications. Renewable and Sustainable Energy Reviews, 16(1):415-425. https://doi.org/10.1016/j.rser.2011.08.006
Landuyt L, de Turck S, Laverge J, et al., 2021. Balancing environmental impact, energy use and thermal comfort: optimizing insulation levels for the mobble with standard HVAC and personal comfort systems. Building and Environment, 206:108307. https://doi.org/10.1016/j.buildenv.2021.108307
Li BZ, Du CQ, Yao RM, et al., 2018. Indoor thermal environments in Chinese residential buildings responding to the diversity of climates. Applied Thermal Engineering, 129:693-708. https://doi.org/10.1016/j.applthermaleng.2017.10.072
Liu XW, Chen YM, Ge H, et al., 2015. Determination of optimum insulation thickness for building walls with moisture transfer in hot summer and cold winter zone of China. Energy and Buildings, 109:361-368. https://doi.org/10.1016/j.enbuild.2015.10.021
Martínez-Mariño S, Eguía-Oller P, Granada-Álvarez E, et al., 2021. Simulation and validation of indoor temperatures and relative humidity in multi-zone buildings under occupancy conditions using multi-objective calibration. Building and Environment, 200:107973. https://doi.org/10.1016/j.buildenv.2021.107973
Meng QL, Yan XY, Ren QC, 2015. Global optimal control of variable air volume air-conditioning system with iterative learning: an experimental case study. Journal of Zhejiang University-SCIENCE A (Applied Physics & Engineering), 16(4):302-315. https://doi.org/10.1631/jzus.A1400137
MOHURD (Ministry of Housing and Urban-Rural Development of the People’s Republic of China), 2010. Design Standard for Energy Efficiency of Residential Buildings in Hot Summer and Cold Winter Zone, JGJ 134-2010. National Standards of the People’s Republic of China (in Chinese).
MOHURD (Ministry of Housing and Urban-Rural Development of the People’s Republic of China), 2012. Design Code for Heating Ventilation and Air Conditioning of Civil Buildings, GB 50736-2012. National Standards of the People’s Republic of China (in Chinese).
Moon HJ, Ryu SH, Kim JT, 2014. The effect of moisture transportation on energy efficiency and IAQ in residential buildings. Energy and Buildings, 75:439-446. https://doi.org/10.1016/j.enbuild.2014.02.039
NOAA (National Oceanic and Atmospheric Administration), 2001. Global Hourly-Integrated Surface Database (ISD). https://www.ncei.noaa.gov/products/land-based-station/integrated-surface-database
Olivieri F, Grifoni RC, Redondas D, et al., 2017. An experimental method to quantitatively analyse the effect of thermal insulation thickness on the summer performance of a vertical green wall. Energy and Buildings, 150:132-148. https://doi.org/10.1016/j.enbuild.2017.05.068
Qin MH, Yang J, 2016. Evaluation of different thermal models in energyplus for calculating moisture effects on building energy consumption in different climate conditions. Building Simulation, 9(1):15-25. https://doi.org/10.1007/s12273-015-0263-2
Qin MH, Belarbi R, Aït-Mokhtar A, et al., 2009. Simulation of coupled heat and moisture transfer in air-conditioned buildings. Automation in Construction, 18(5):624-631. https://doi.org/10.1016/j.autcon.2008.12.006
Rode C, Peuhkuri R, Woloszyn M, 2006. Simulation tests in whole building heat and moisture transfer. Proceedings of the 3rd International Building Physics Conference, p.527-534.
Tariku F, Kumaran K, Fazio P, 2010. Integrated analysis of whole building heat, air and moisture transfer. International Journal of Heat and Mass Transfer, 53(15-16):3111-3120. https://doi.org/10.1016/j.ijheatmasstransfer.2010.03.016
Tariku F, Kumaran K, Fazio P, 2011. Determination of indoor humidity profile using a whole-building hygrothermal model. Building Simulation, 4(1):61-78. https://doi.org/10.1007/s12273-011-0031-x
Trindade AD, Coelho GBA, Henriques FMA, 2021. Influence of the climatic conditions on the hygrothermal performance of autoclaved aerated concrete masonry walls. Journal of Building Engineering, 33:101578. https://doi.org/10.1016/j.jobe.2020.101578
Tunçbilek E, Komerska A, Arıcı M, 2022. Optimisation of wall insulation thickness using energy management strategies: intermittent versus continuous operation schedule. Sustainable Energy Technologies and Assessments, 49:101778. https://doi.org/10.1016/j.seta.2021.101778
Wang SH, Kang YM, Yang ZL, et al., 2019. Numerical study on dynamic thermal characteristics and optimum configuration of internal walls for intermittently heated rooms with different heating durations. Applied Thermal Engineering, 155:437-448. https://doi.org/10.1016/j.applthermaleng.2019.04.005
Wang YY, Ma C, Liu YF, et al., 2018. A model for the effective thermal conductivity of moist porous building materials based on fractal theory. International Journal of Heat and Mass Transfer, 125:387-399. https://doi.org/10.1016/j.ijheatmasstransfer.2018.04.063
Woloszyn M, Kalamees T, Olivier Abadie M, et al., 2009. The effect of combining a relative-humidity-sensitive ventilation system with the moisture-buffering capacity of materials on indoor climate and energy efficiency of buildings. Building and Environment, 44(3):515-524. https://doi.org/10.1016/j.buildenv.2008.04.017
Woods J, Winkler J, 2016. Field measurement of moisture-buffering model inputs for residential buildings. Energy and Buildings, 117:91-98. https://doi.org/10.1016/j.enbuild.2016.02.008
Xu CC, Li SH, Zou KK, 2019. Study of heat and moisture transfer in internal and external wall insulation configurations. Journal of Building Engineering, 24:100724. https://doi.org/10.1016/j.jobe.2019.02.016
Zhang MJ, Qin MH, Chen Z, 2017. Moisture buffer effect and its impact on indoor environment. Procedia Engineering, 205:1123-1129. https://doi.org/10.1016/j.proeng.2017.10.417
Zhang YM, Jie PF, Liu CH, et al., 2022. Optimizing environmental insulation thickness of buildings with CHP-based district heating system based on amount of energy and energy grade. Frontiers in Energy, 16:613-628. https://doi.org/10.1007/s11708-020-0700-5
Zhou XH, Carmeliet J, Sulzer M, et al., 2020. Energy-efficient mitigation measures for improving indoor thermal comfort during heat waves. Applied Energy, 278:115620. https://doi.org/10.1016/j.apenergy.2020.115620
https://doi.org/10.1631/jzus.A2200158
Mar. 26, 2022; Revision accepted July 4, 2022;
Crosschecked Nov. 4, 2022
© Zhejiang University Press 2022
杂志排行
Journal of Zhejiang University-Science A(Applied Physics & Engineering)的其它文章
- Inkjet 3D bioprinting for tissue engineering and pharmaceutics
- Investigations on lubrication characteristics of high-speed electric multiple unit gearbox by oil volume adjusting device
- Hole-growth phenomenon during pyrolysis of a cation-exchange resin particle
- A novel stacking-based ensemble learning model for drilling efficiency prediction in earth-rock excavation
- Enhanced photocatalytic performance of S-doped covalent triazine framework for organic pollutant degradation
- Total contents
