Visual learning graph convolution for multi-grained orange quality grading
2023-01-06GUANZhibinZHANGYanqiCHAIXiujuanCHAIXinZHANGNingZHANGJianhuaSUNTan
GUAN Zhi-bin ,ZHANG Yan-qi ,CHAI Xiu-juan ,CHAI Xin ,ZHANG Ning, ,ZHANG Jian-hua,,SUN Tan,
1 Agricultural Information Institute,Chinese Academy of Agricultural Sciences,Beijing 100081,P.R.China
2 Key Laboratory of Agricultural Big Data,Ministry of Agriculture and Rural Affairs,Beijing 100081,P.R.China
3 National Nanfan Research Institute (Sanya),Chinese Academy of Agricultural Sciences,Sanya 572024,P.R.China
Abstract The quality of oranges is grounded on their appearance and diameter.Appearance refers to the skin’s smoothness and surface cleanliness;diameter refers to the transverse diameter size.They are visual attributes that visual perception technologies can automatically identify.Nonetheless,the current orange quality assessment needs to address two issues: 1) There are no image datasets for orange quality grading;2) It is challenging to effectively learn the finegrained and distinct visual semantics of oranges from diverse angles.This study collected 12 522 images from 2 087 oranges for multi-grained grading tasks.In addition,it presented a visual learning graph convolution approach for multigrained orange quality grading,including a backbone network and a graph convolutional network (GCN).The backbone network’s object detection,data augmentation,and feature extraction can remove extraneous visual information.GCN was utilized to learn the topological semantics of orange feature maps.Finally,evaluation results proved that the recognition accuracy of diameter size,appearance,and fine-grained orange quality were 99.50,97.27,and 97.99%,respectively,indicating that the proposed approach is superior to others.
Keywords: GCN,multi-view,fine-grained,visual feature,appearance,diameter size
1.Introduction
Orange quality is mostly identified according to their appearance grade,diameter size,and internal quality.Regarding appearance,oranges with smooth skin,clean surface,and no evident deformities are considered to be of greater quality than oranges with a drab hue,scratches,reticulation,and attachments on the skin.Regarding diameter,oranges are primarily evaluated based on the smallest diameter.The larger the diameter size,the higher the quality.The internal quality of an orange pertains to its soluble solids,total acid content,and solid-acid ratio.The diameter size and appearance quality,unlike the internal quality,are visual attribute traits that can be automatically identified by visual perception technology.
The automatic quality grading of oranges,apples,mangoes,and other fruit has been mostly based on visual perception technology,thanks to the rapid advancement of computer vision technology.Gurubelliet al.(2019) used the support vector machine (SVM) to grade the quality of pomegranate fruit.Tanget al.(2020) also utilized SVM to grade apple bruises based on hyperspectral images.
Fruit maturity is classified as unripe,ripe,or overripe,which can be determined through fruit appearance or fruit size analysis.Hamza and Chtourou (2020) estimated apple ripeness using the color features of RGB images.SVM and artificial neural networks (ANN) were used by Azarmdelet al.(2020) to identify strawberry ripeness using color and texture feature analysis.Mon and ZarAung (2020) attempted to estimate the volume of mangoes by extracting the width,length,and intensity of light from RGB images.The majority of the RGB images depict the top view of mangos.The convolutional neural network (CNN) was applied for mango categorization(Tripathi and Maktedar 2021) and fruit ripeness classification (Rodriguezet al.2021).The fruit ripeness classification system devised by Rodriguezet al.(2021)was applicable for analyzing the ripeness of oranges,bananas,and strawberries.
Zhang and Liu (2021) used the deep dense network(DenseNet) and attention mechanism to identify navel orange pests and diseases with a 96.9% accuracy rate.Tianet al.(2022) designed a spectrum-based approach for detecting orange freezing damage,while the CNN increased accuracy to 91.96%.Kumariet al.(2022)combined K-nearest neighbors (KNN) with CNN for appearance grading and maturity identification.Ortega-Sánchezet al.(2022) subdivided the apple visual features by optimizing the cross-entropy loss function.Luet al.(2022) developed the You Only Look Once version 4(YOLOv4)-based canopy attention (CA-YOLOv4)approach for apple ripening identification,whereas block attention was added to the YOLOv4 model.Fanet al.(2022) employed channel and layer pruning to boost the efficiency and accuracy of the YOLOv4 apple grading model.
Although visual perception technology can be used to automatically identify the diameter size or appearance grade of oranges,two issues need to be resolved in the current orange quality grading task.First,there are no multi-view image datasets available for orange quality grading,though differences exist in the diameter and appearance of oranges under different viewing angles(e.g.,the top and bottom views).Second,the quality of orange is determined by the combination of its diameter size and appearance grade,and it is an arduous task to accurately identify the fine-grained and differentiated characteristics of oranges when viewed from different angles.
Therefore,we first collected multi-view images from 2 087 individual oranges,encompassing six transverse diameters and four appearance grades,in order to provide multi-grained visual semantics of oranges.Second,we put forward a visual learning graph convolution method for multi-grained orange quality grading,including a sample consistency network (SCNet) (Dinget al.2021),data augmentation,the re-parameterization visual geometry group (RepVGG) (Vuet al.2021),and a graph convolutional network (GCN),dubbed visual learning GCN (VLGCN).
The VL network was applied for bounding box detection,data augmentation,and feature extraction of each orange;the GCN was utilized to further learn the fine-grained visual features (Fig.1).VLGCN can eliminate extraneous visual information by detecting orange bounding boxes and cropping them from the original images.Moreover,GCN can learn the topological semantics of feature maps to extract the fine-grained visual semantics of oranges.

Fig.1 The overview of the proposed method.G,RPN,FPN,Bb represent the global context branch,region proposal network,feature pyramid network,and bounding box branch of sample consistency network (SCNet),respectively.B is the basic block of the re-parameterization visual geometry group (RepVGG),and GAP is the global average pool layer.GCN is the graph convolutional network.Different-sized grey cubes represent various feature maps.The dimension of different grey cubes are denoted as (3,224,224),(64,112,112),etc.
On the one hand,the collected 12 522 multi-view images can be employed for multi-grained orange grading tasks,such as diameter grading,appearance grading,and fine-grained orange quality grading.On the other hand,the proposed VLGCN method consists of two major components: the VL network and the adaptive GCN,which are developed for global feature extraction and finegrained visual semantic learning of oranges,respectively.
Concretely,SCNet was used to extract the bounding boxes of oranges from the original image since its precision and robustness are superior to those of YOLOX for low-quality oranges.Following that,bounding box(Bbox) cut,resize,and random flip were successively applied as data augmentation.In addition,RepVGG was utilized to extract the global visual features of oranges,as its ability to do so is superior to that of other methods,such as visual geometry group 19 (VGG19) (Simonyan and Zisserman 2015),Residual Network (ResNet) (Heet al.2016),ResNeXt (Xieet al.2017),SEResNet (Huet al.2018),efficient net (EfficientNet) (Tan and Le 2019),high-resolution Net (HRNet) (Wanget al.2021),Conformer (Penget al.2021),and twins-spatial vision transformer (Twins-SVT) (Yuanet al.2021).
The following is a summary of this paper’s primary contributions.(1) A visual learning graph convolution method referred to as VLGCN is described for the multi-grained quality grading of oranges.(2) Object detection,data augmentation,and visual extraction of the VL network can remove unnecessary visual information from original images.The GCN is capable of learning the topological semantics of orange feature maps.(3) A total of 12 522 images of 2 087 oranges are gathered in order to provide multi-grained visual semantics of oranges.(4) The performance of VLGCN with various modules and configurations is investigated,and evaluation findings demonstrate that it is superior to other approaches.
2.Materials and methods
2.1.Samples
Image acquisitionAs depicted in Table 1,a total of 2 087 oranges with varying diameter sizes and appearance grades were collected for multi-view image acquisition.The six diameters of the oranges were 0.060,0.065,0.070,0.075,0.080,and 0.085 m.The oranges were classified into four grades according to their appearances,such as whether the orange skin is smooth,whether the fruit surface is clean,and whether there are scars,webs,or attachments.It should be noted that oranges with a diameter smaller than or equal to 0.060 m are classed as a separate category that is no longer subdivided by their appearances.
As illustrated in Fig.2,multi-view RGB images were collected from six viewpoints for each orange.Table 2 displays the number of orange images with differentdiameter sizes and appearance grades.
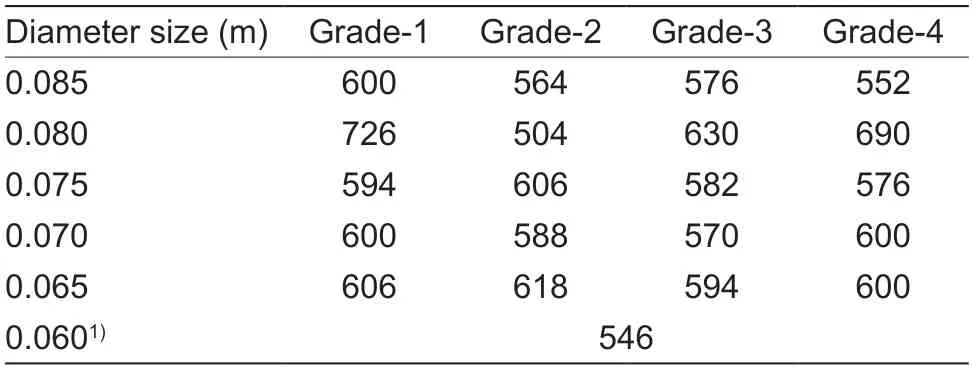
Table 2 The number of orange images
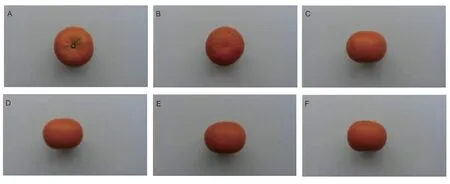
Fig.2 Multi-view RGB images of an orange with a diameter of 0.085 m and appearance grade of 2.Images are top view (A),bottom view (B),side view 1 (C),side view 2 (D),side view 3 (E),and side view 4 (F).
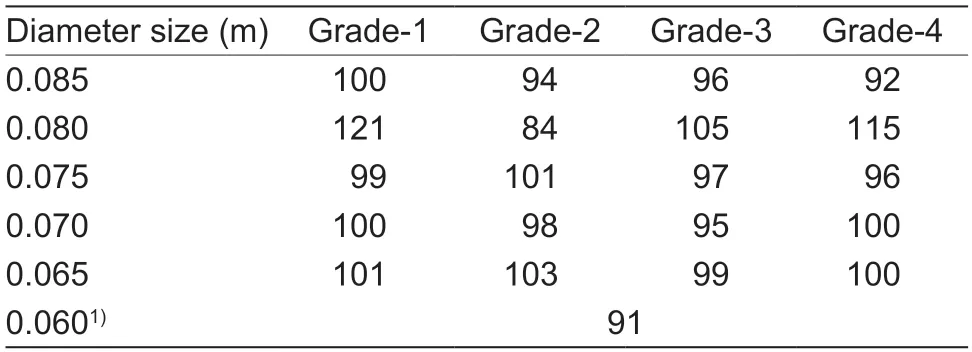
Table 1 The number of orange subjects
Image scalingDuring image acquisition,the distance between the camera and each orange was not fixed,resulting in depth information that is unique to each image.To ensure that all RGB images have the same depth information,we calculated the scaling factor for each orange image based on its depth information.
As described in Fig.3,we selected a baseline image to calculate the scaling factors for other orange images.When the distance between the baseline image and the camera,denoted bydbaseline,is fixed,the scaling factorαof a given RGB image can be calculated using the corresponding depth informationdimage,as shown in eq.(1).
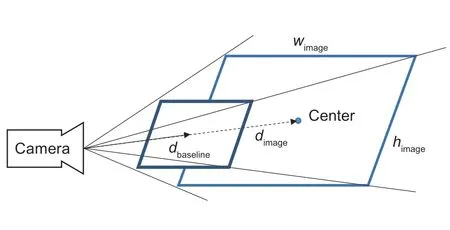
Fig.3 Image scaling based on depth information.Wimage and himage are the width and height of the given image that need to be scaled.dbaseline (dashed arrow) is the distance between the camera and baseline images;dimage (solid arrow) indicates the distance between the camera and given images.

After that,the image’s scaled height and width can be computed by eq.(2).

In this paper,all scaling factors are employed in the data augmentation part,referred to Section 2.2.
Images for diameter gradingIn the orange diameter grading task,orange images were labeled with their respective diameter sizes,as shown in Table 3.Specifically,multi-view images with a diameter of 0.060 m were excluded to prevent sample imbalance between classes.We divided the 11 976 orange images in a ratio of 7:1.5:1.5,with 8 386 images serving as the training set,1 795 images serving as the validation set,and 1 795images serving as the test set.
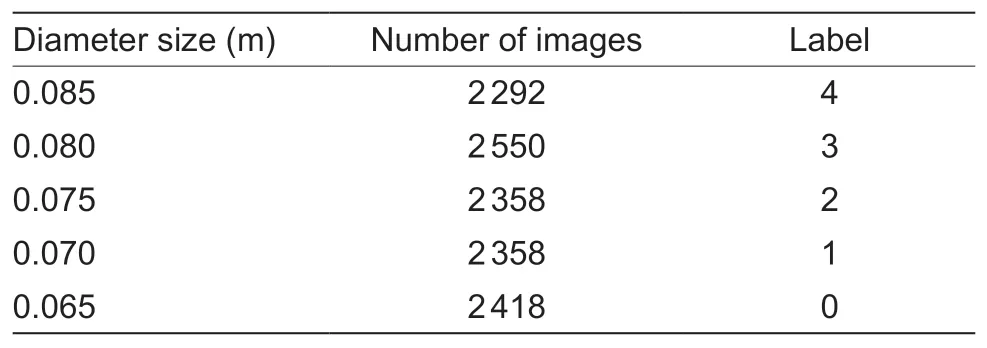
Table 3 The orange images and corresponding labels for the diameter grading task
Images for appearance gradingOnly 11 976 RGB images were tagged with the corresponding appearance grades for the orange appearance grading task,as shown in Table 4.We employed 8 384 images for training,1 796 for validation,and the remaining 1 796 for testing.
Images for fine-grained gradingIt is required to do fine-grained annotation on all orange images because the quality of each orange is determined by both its appearance and diameter.Specifically,the orange images were finely annotated by diameter size and appearance grade.For instance,images with a diameter of 0.085 m and appearance grade 2 are labeled 18.It is important to note that orange images with a diameter of 0.060 m was a separate category since their diameteris too small,and there was no need to partition their appearance quality.Finally,12 522 images were applied to the fine-grained quality grading task,containing 21 categories,of which 8 384 training images,1 796 validation images,and 1 796 test images were utilized,as shown in Table 5.

Table 4 The orange images and corresponding labels for the appearance grading task
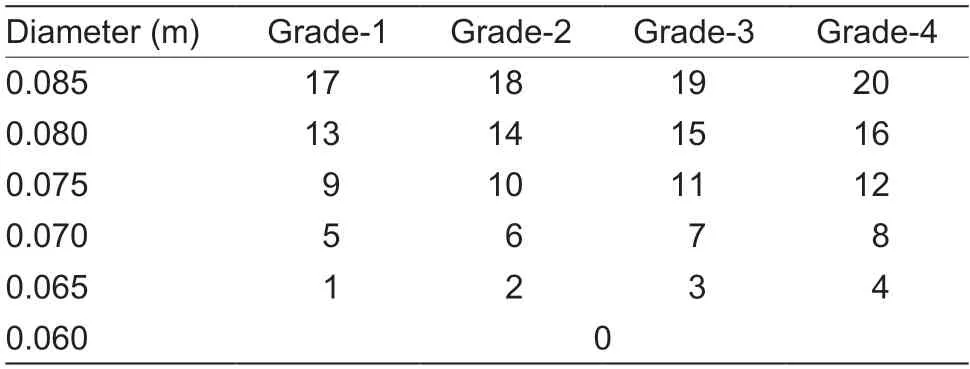
Table 5 The predefined labels for the fine-grained orange grading task1)
2.2.VL network
Object detectionSCNet is a cascaded neural network for object detection and instance segmentation that is designed to address the disparity in quality between training and test samples.Fig.4 depicts the basic components of SCNet,such as ResNet,feature pyramid networks (FPN),global context branch (G),and region proposal network (RPN).
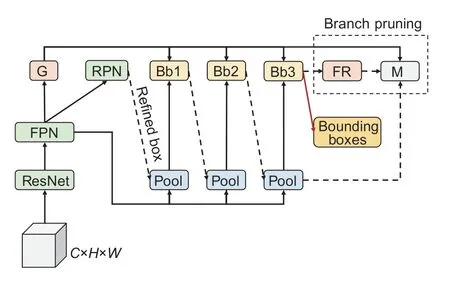
Fig.4 Sample consistency network (SCNet)-based orange object detection diagram.G,RPN,FPN represent the global context branch,region proposal network,and feature pyramid network,respectively.Bb and M represent the box branch and mask branch,respectively.The dotted box represents the pruned network.All arrows (solid red arrows,solid black arrows,and dashed arrows) in the network represent data flow.The solid red arrow denotes the extra output layer of the bounding box.
ResNet,followed by FPN,was used to extract fundamental visual features.The feature relay block was designed to facilitate information exchange between theobject detection and instance segmentation branches.The global context branch utilizes the basic visual feature to predict multi-labels of objects in images.In this paper,only the orange bounding boxes were generated from images;hence,the mask branch in the pre-trained SCNet model was pruned.
Data augmentationData augmentation was performed for each orange image using “Bbox crop”,“Resize”,“Random flip”,and “Normalize”.
Bbox crop: This step was used to crop each orange’s bounding region from a supplied RGB image depending on the bounding box.The orange bounding box is represented as (w1,h1,w2,h2) where (w1,h1) refers to the upper-left corner coordinate of the orange bounding box in the image,and (w2,h2) refers to the lower-right corner coordinate.In this paper,the resolution of all original orange images was 848 by 480 pixels,whereas the resolution of the cropped orange image was reduced to (w2–w1)×(h2–h1) pixels.It can significantly reduce extraneous visual information in the original image that is unrelated to orange.
Scaling and padding (optional): Each orange image that had been cropped was multiplied by the corresponding scaling factor so that all images had the same depth value.Each image was then restored to the same shape by padding with “0”,as the scaled photos had different shapes.Because the maximum height and width of all scaled images were 397 and 414 pixels,respectively,the padded image’s dimensions were set to 400× 420.
Resize: Orange images should be resized to a fixed width and height in order to meet the input requirements of visual feature extraction models.Orange images were subjected to an affine transformation utilizing bilinear interpolation as an up-sampling or down-sampling technique.All orange images were resized to 224 by 224 pixels.
Random flip: Furthermore,all resized orange images were randomly flipped by a predefined probability value,which was set to 0.5,to improve the generalization ability of the visual feature extraction model.
Normalize: Finally,the pixel values of the red,green,and blue channels in the orange image were normalized using the data normalization method so that the pixel values in the same channel could conform to the normal distribution.
Feature extractionRepVGG is a classification network developed using the VGG network as its foundation.It utilizes the concept of residual networks and augments the VGG block with identity and residual branches.As illustrated in Fig.5,only stacked 3×3 convolutions and rectified linear unit (ReLU) were used for feature extraction,while 1×1 convolution branches were applied for direct information transfer to prevent gradient dissipation.
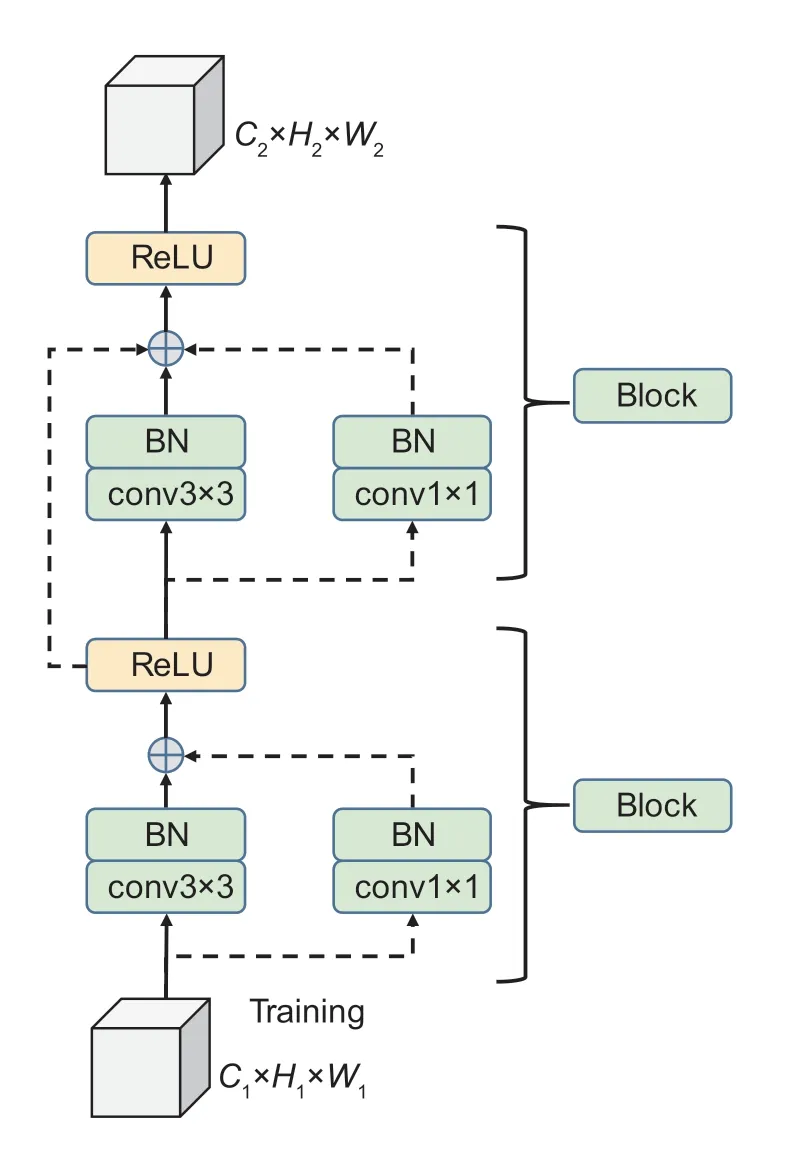
Fig.5 The basic block in sample consistency network (RepVGG)-based feature extraction.BN is the batch normalization layer;conv3×3 and conv1×1 refer to the convolution layer with a 3×3 and 1×1 kernel size,respectively.Backbone connections are represented by solid arrows,whereas residual connections or auxiliary layers are represented by dashed arrows.
The proposed VLGCN approach for orange visual feature extraction was based on RepVGG,as the straight VGG-like network structure and only 3×3 or 1×1 convolution operations significantly increased the speed and feature extraction capability of RepVGG.Specifically,the classification layer of RepVGG was removed,and the orange images following data augmentation were utilized as input data to produce a large number of small-size feature maps.A total of 2 560 7×7 feature maps were generated for each orange image.
2.3.Fine-grained orange feature learning
Every feature value in each feature map produced by the VL network has a fixed position.CNN-based methods have a drawback in that the convolution procedure can only sequentially extract the semantics of nearby feature values using convolution kernels.Consequently,the VLGCN employed GCN to extract topological semantics between feature values of each feature map,as shown in Fig.6.
Adjacency matrixThe adjacency matrix was utilized to record whether there exist edges between topological vertices.In GCN,the adjacency matrix was used to capture the semantic association between each feature map’s feature values.For a given 7×7 feature map denoted asvi,the adjacency matrix can be computed by eq.(3).

The blocksf1andf2consist of a convolution layer,a batch normalization layer.The symbol denotes matrix multiplication.Trepresents the notation for matrix transposition,while softmax is the activation function.
Graphical semanticsThe GCN is used to learn the graphical semantics of every feature map.As illustrated in Fig.6,the graphical semantics of each feature map is calculated based on adjacent matrixAiand feature mapvi.The calculation process is given in eq.(4).
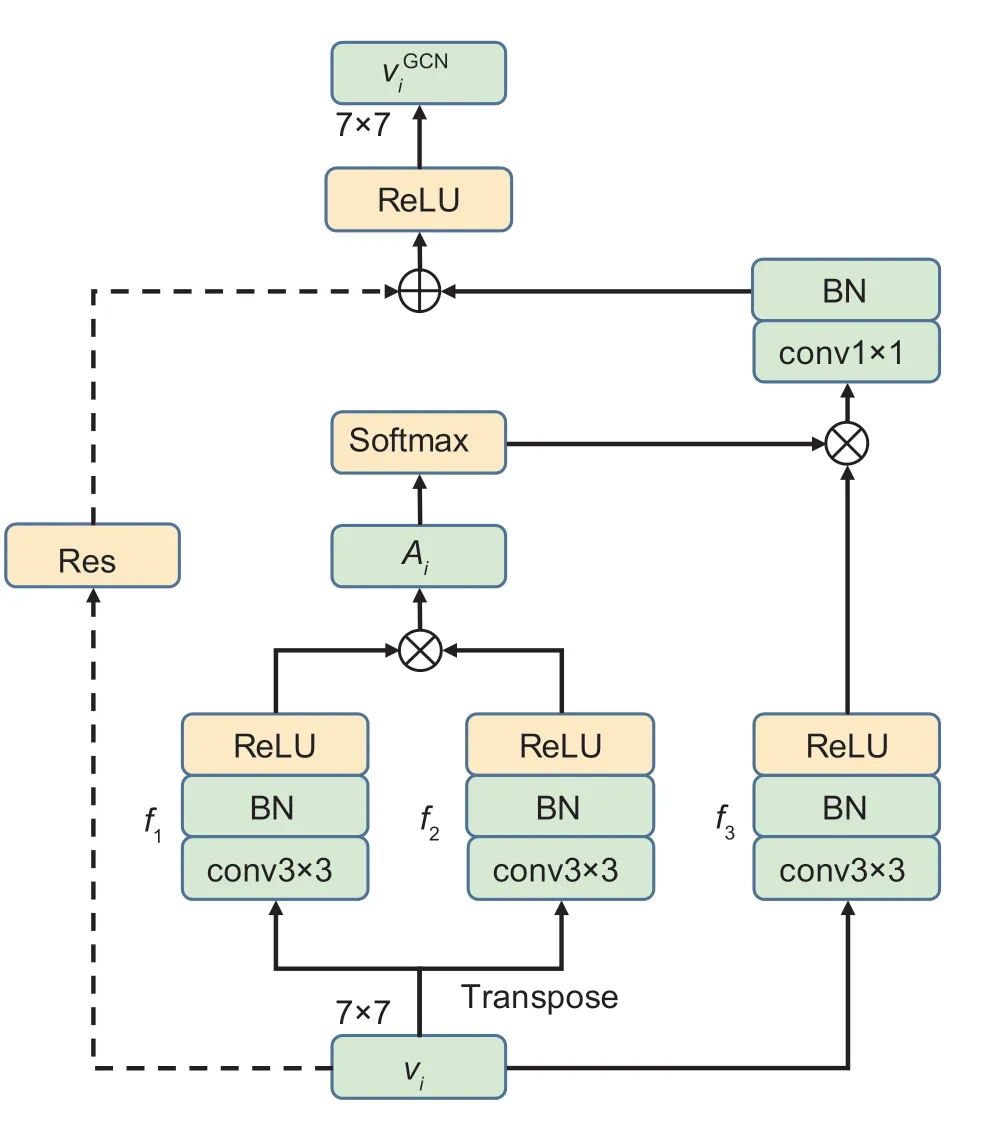
Fig.6 Graph convolutional network (GCN)-based finegrainedfeature learning illustration. conv3×3 and conv1×1refer to the convolution layer with a 3×3 and 1×1 kernelsize. BN is the batch normalization layer. ReLU is rectifiedlinear unit. Dashed arrows indicate residual connections(Res).⊗represents the matrix product.⊗indicates thematrix addition.

In the abovementioned equation,ReLU serves as the activation function.f3consists of one convolution layer and one batch normalization layer.Resrefers to the residual block that performs the same convolution asf3.
Quality gradingFinally,the global average pooling (GAP)was employed as a down-sampling technique for feature mapsand a linear classification layer was utilized to classify orange quality.Each image’s classification probabilities were computed using the feature mapsVGCN,as indicated in eq.(5).

In the aforesaid equation,P(VGCN) indicates the classification probabilities ofVGCN;ffcandfmaprepresent the classification layer and adaptive pooling layer,respectively.
2.4.Implementation setting
Configuration detailsThe configuration specifications of the experimental environment are listed in Table 6.The operating system and programming language adopted in this research are,respectively,red hat Linux version 4.8.5 and Python version 3.7.11.The experiments were conducted on the Pytorch platform with NVIDIA Tesla P100 graphic processing units (GPUs) cards.The NVIDIA driver and compute unified device architecture (CUDA)versions are 418.39 and 10.1,respectively.The version of Pytorch is 1.7.1.
The configuration information for model training or testing is detailed in Table 7.All backbone networks are pre-trained on ImageNet-1k datasets and fine-tuned on the collected multi-view orange images.We utilized stochastic gradient descent (SGD) and adaptive moment estimate (Adam) as optimizers.The batch size was set to 32,and the loss was calculated by the cross-entropy function.There were 30 epochs,and the learning rate was initialized with 0.01 and decayed by a factor of 10 at epochs 15,20,and 25.
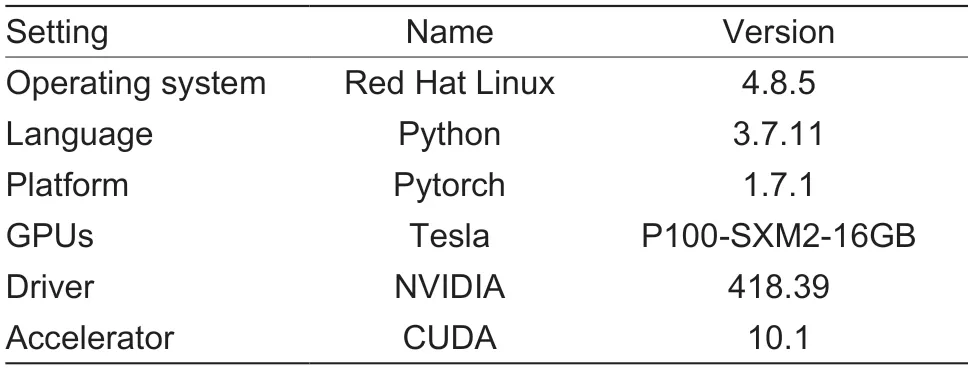
Table 6 Configuration specifications of experimental environment
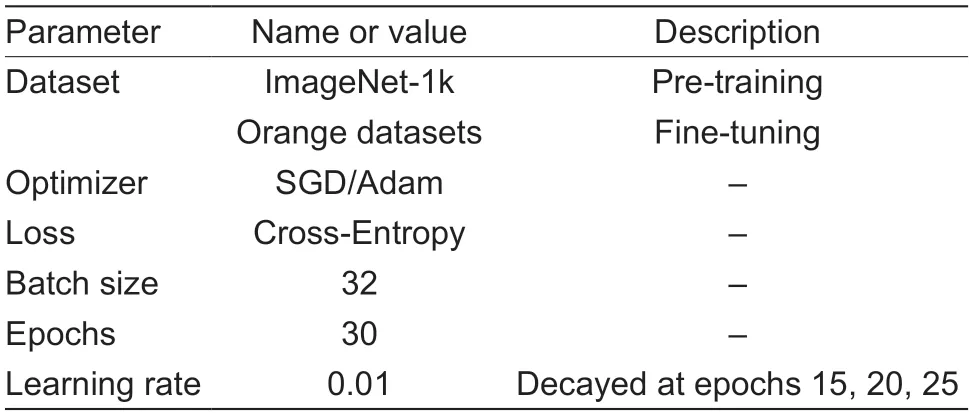
Table 7 Training or test parameter configurations
Evaluation metricsWe evaluated the performance of VLGCN for orange quality grading using multiple metrics,including accuracy (Acc),precision (P),recall (R),and F1 score (F1).All of these assessment measures can be computedviatrue positive (TP),true negative (TN),false positive (FP),and false negative (FN),as described by eqs.(6)–(9).

3.Results
3.1.Object detection results
It is necessary to employ object detection algorithms to process original orange images and precisely extract the bounding box of each orange,thereby eliminating redundant visual features from the original images.This research primarily compared the detection outcomes of two models,YOLOX and SCNet,which are both outstanding computer vision approaches.
As illustrated in Figs.7 and 8,both YOLOX and SCNet are capable of accurately identifying and generating the bounding box for orange objects with a diameter of 0.085 m and an appearance grade of 2.SCNet’s recognition accuracy reached 100%,which is superior to YOLOX’s.There are no discernible differences between the results of YOLOX and SCNet in the detection of the orange bounding box,which both can produce a pretty compact bounding box.Both YOLOX and SCNet can be used to detect the bounding box of high-quality oranges,such as those with smooth and un-reticulated surfaces.
However,the accuracy of YOLOX is inferior to that of SCNet for quality grading of oranges with a poor appearance,as depicted in Fig.9.Surface marks cause YOLOX to misidentify an orange with a diameter of 0.065 m and an appearance grade of 4 as “Frisbee”,but SCNet correctly classifies it.It has been proved that SCNet is more robust than YOLOX.Therefore,SCNet is more appropriate than YOLOX for the fine-grained orange quality grading task that involves different diameter sizes and appearance grades.
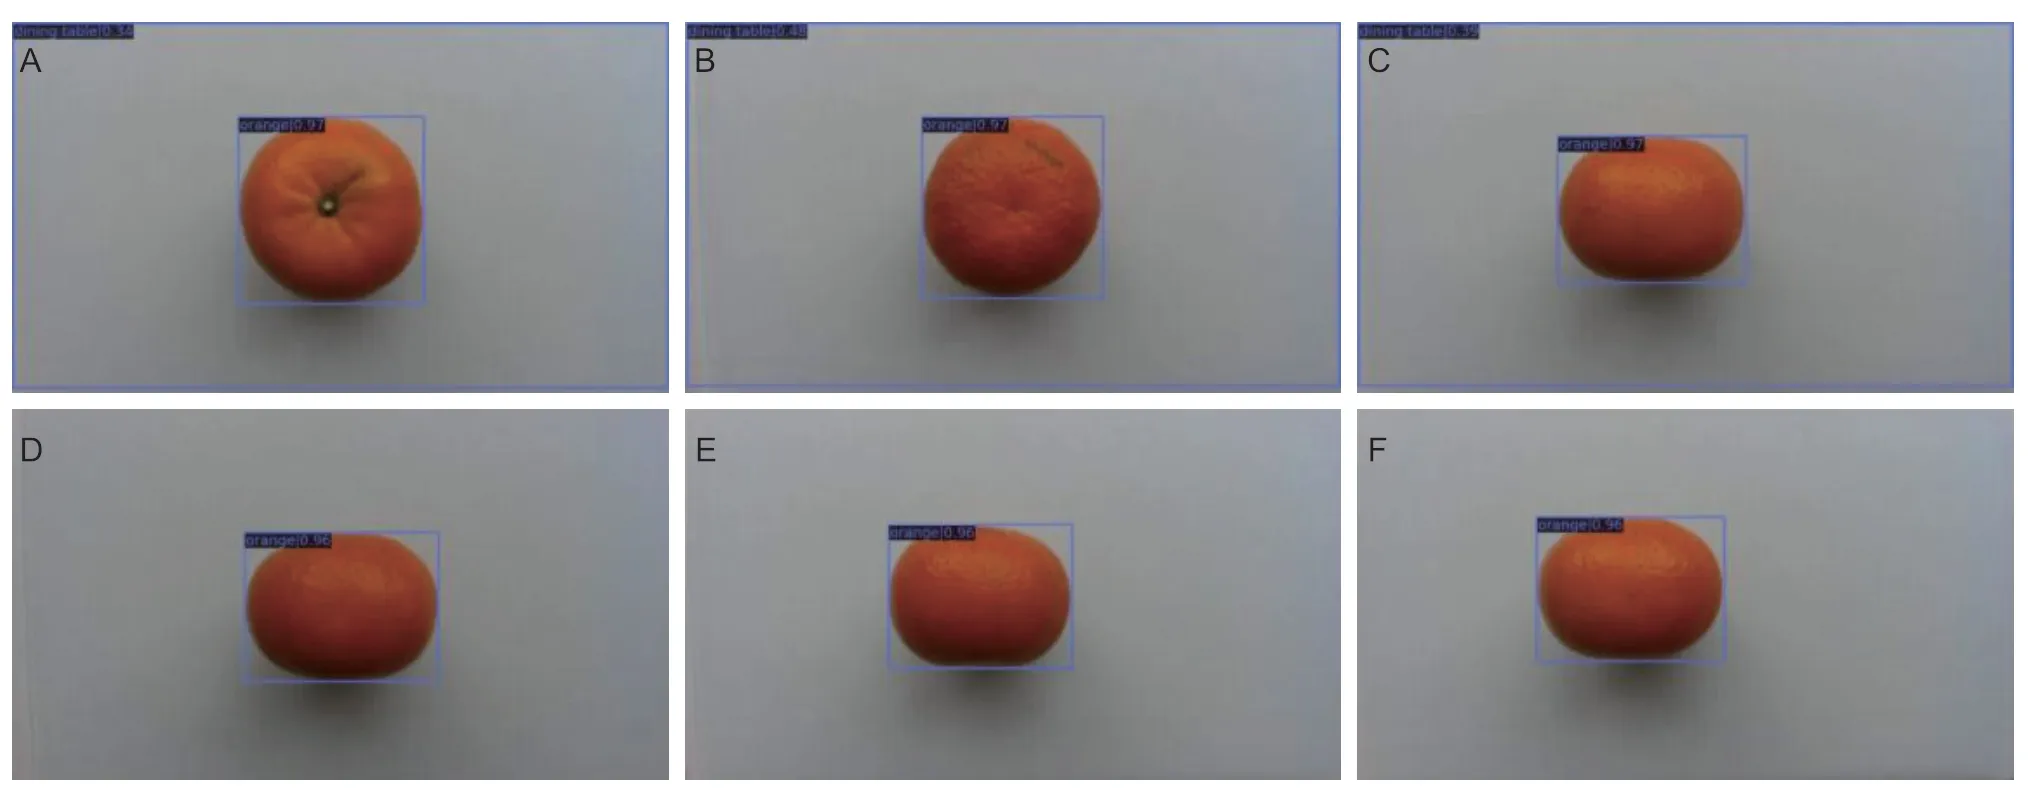
Fig.7 Object detection results in multi-view orange images based on You Only Look Once (YOLOX).Images are top view (A),bottom view (B),side view 1 (C),side view 2 (D),side view 3 (E),and side view 4 (F).The blue box represents the detected orange bounding box.The dark blue rectangle shows the detected object category.
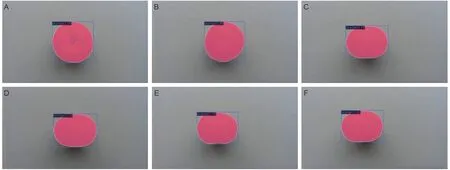
Fig.8 Object detection results on multi-view orange images based on sample consistency network (SCNet).Images are top view(A),bottom view (B),side view 1 (C),side view 2 (D),side view 3 (E),and side view 4 (F).The blue box represents the detected orange bounding box.The magenta region represents the segmented orange semantics.The dark blue rectangle shows the detected object category.

Fig.9 Object detection result comparison between You Only Look Once (YOLOX) and sample consistency network (SCNet).Images are input image (A),YOLOX result (B),and SCNet result (C).The blue box represents the detected orange bounding box.The dark blue rectangle shows the detected object category.
3.2.Image scaling and padding results
The comparison results of whether scaling factors are utilized to constrain images are given in Table 8.The“w/o” symbol represents that the scaling factor is not utilized in VLGCN,and the “w/i” symbol indicates that the scaling factor is employed.The results showed that the application of scaling factors can reduce grading accuracy.For instances,the accuracy of scheme “w/i scaling (D)” (row 2 in Table 8) and “w/i scaling (F)” (row 4 in Table 8) is poorer to “w/o scaling (D)” (row 3 in Table 8)and “w/o scaling (F)” (row 5 in Table 8) by 0.28 and 0.90%,respectively.Therefore,image scaling and padding werenot applied for data augmentation in the subsequent experiments.

Table 8 Comparison results of whether scaling factors are utilized to constrain orange images (%)
3.3.VL results with different modules
First,we investigated the VL network’s performance.Fig.10 depicts the visualized evaluation results of VL for fine-grained orange grading.
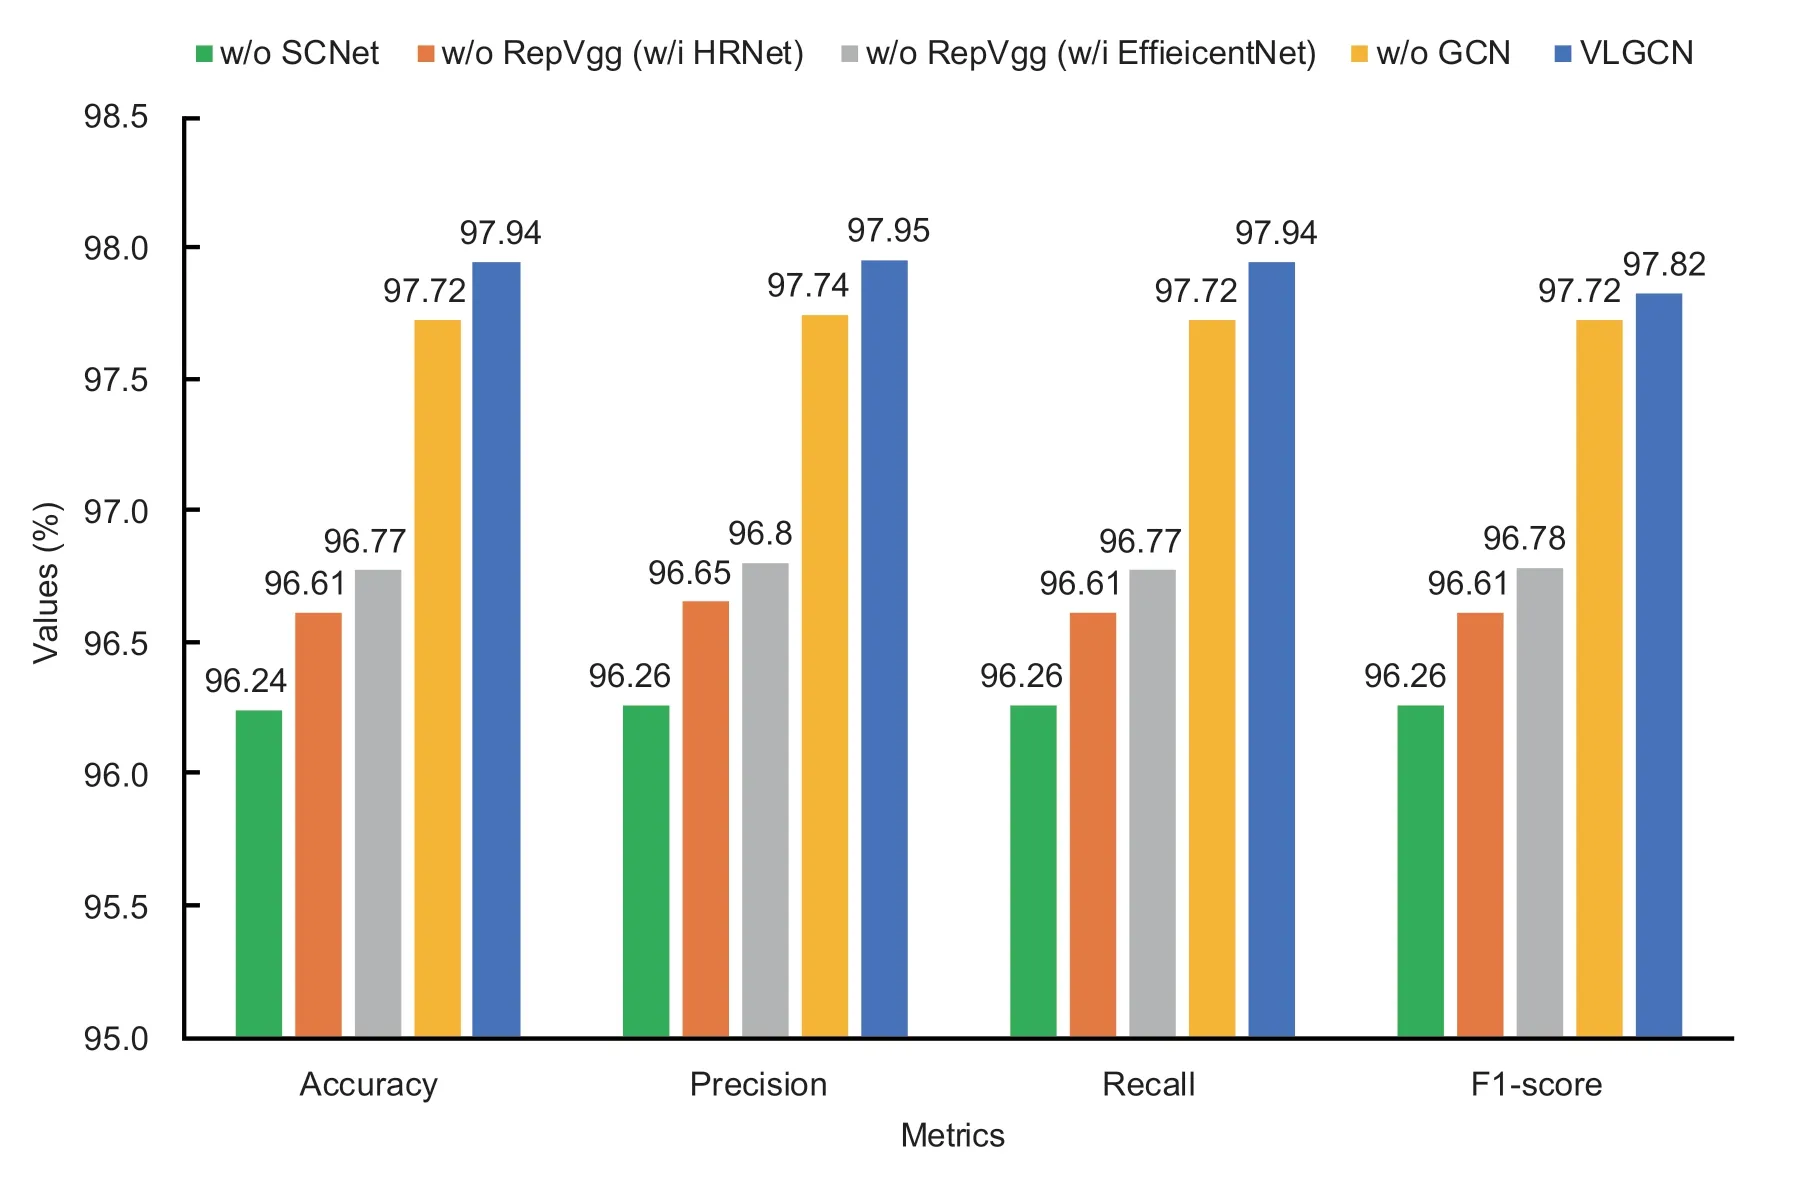
Fig.10 Visualization of the visual learning graph convolutional network (VLGCN)’s fine-grained quality grading results.w/o,without;w/i,with.
As demonstrated in Table 9,the VLGCN network’s performance on the fine-grained quality grading task varies depending on the modules utilized.The “w/o”symbol represents that the corresponding module is not adopted,whereas the “w/i” symbol indicates that the module is used.
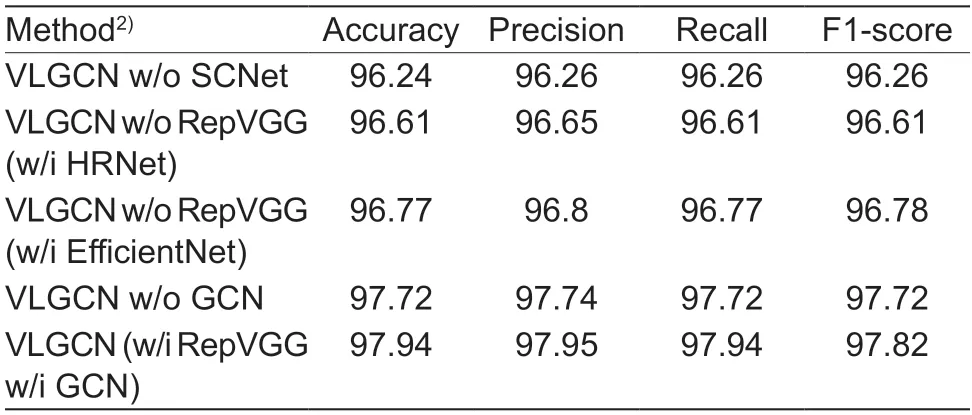
Table 9 Visual learning graph convolutional network (VLGCN)results with different modules on the fine-grained quality grading task1)
Therefore,“VLGCN w/o SCNet” denotes the scheme in which the SCNet is not employed for orange detection.“VLGCN w/o GCN” denotes that GCN is not utilized for fine-grained orange feature learning,whereas the VL network,followed by the classification layer,was used directly for orange quality grading.“VLGCN w/o RepVGG(w/i HRNet)” implies that RepVGG is replaced by HRNet,while “VLGCN w/o RepVGG (w/i EfficientNet)” denotes that the RepVGG is replaced by EfficientNet,both of these schemes were designed to demonstrate the significance of RepVGG.“VLGCN (w/i RepVGG w/i GCN)” is the presented method.
The three primary observations are as follows.
1) The orange grading performance of “VLGCN w/o SCNet” is considerably inferior to other schemes,both in terms of accuracy,precision,recall,and F1 score.In particular,the evaluation result of “VLGCN (w/i RepVGG w/i GCN)” is superior to “VLGCN w/o SCNet” by 0.7% in terms of accuracy.This verifies the necessity of SCNet for orange bounding box detection.
2) RepVGG is replaced by HRNet and EfficientNet in schemes “VLGCN w/o RepVGG (w/i HRNet)” and“VLGCN w/o RepVGG (w/i EfficientNet)”,resulting in grading results that are 0.33 and 0.17% less accurate than “VLGCN (w/i RepVGG w/i GCN)”.It indicates that RepVGG is irreplaceable for orange feature extraction.
3) “VLGCN (w/i RepVGG w/i GCN)” is superior to VLGCN w/o GCN by 0.22,0.21,0.22 and 0.22% in terms of accuracy,precision,recall,and F1-score,respectively.The comparison of these two schemes indicates that GCN can learn fine-grained orange features more reliably,proving GCN’s necessity.
The above experimental analyses and depictions demonstrate the irreplaceability and necessity of several modules of VLGCN for orange quality grading.
4.Discussion
This section mainly investigates the grading effectiveness of VLGCN with different settings in two directions: 1) The effectiveness of GCN followed by different pooling layers,such as global average pooling (GAP) and global maxpooling (GMP);2) The effectiveness of different optimization algorithms,including SGD and Adam.There are a total of four different model settings,termed as “VLGCN w/i GMP w/i SGD”,“VLGCN w/i GAP w/i SGD”,“VLGCN w/i GMP w/i Adam”,and “VLGCN w/i GAP w/i Adam”.
4.1.GAP vs.GMP
As shown in Table 10,VLGCN results on multi-granularity grading tasks with different settings are presented.The three primary observations are as follows.
1) VL’s orange grading performance is worse than other model settings that include GCN for learning finegrained visual features.It is compatible with the previous section’s discussion conclusion.Besides,the grading accuracy of orange diameter is approximately 99%,whereas the accuracy of appearance grade or finegrained quality is approximately 97%,indicating that the feature learning of orange appearance is more difficult.
2) Based on the same optimization algorithm,GAP can provide a modest performance boost for diameter grading and fine-grained orange quality grading.In the fine-grained grading task (rows 12 to 16 in Table 10),for example,“VLGCN w/i GAP w/i SGD” outperforms “VLGCN w/i GMP w/i SGD” by 0.11 and 0.11% in terms of accuracyand precision,respectively.Precision-wise,“VLGCN w/i GAP w/i Adam” is superior to “VLGCN w/i GMP w/i Adam”by 0.01%.

Table 10 Visual learning graph convolutional network (VLGCN) results with different settings on multi-granularity grading task (%)
3) In the appearance grading task (rows 7 to 11 in Table 10),the performance of GAP is lower than that of GMP with the Adam optimization algorithm.For example,“VLGCN w/i GAP w/i Adam” is inferior to “VLGCN w/i GMP w/i Adam” by 0.22,0.24,and 0.23% in terms of accuracy,precision,and F1-score,respectively.The evaluation results of “VLGCN w/i GAP w/i SGD” and “VLGCN w/i GMP w/i SGD” (rows 8 and 9 in Table 10) demonstrate little difference in the effectiveness of GAP and GMP.
4.2.SGD vs.Adam
Furthermore,we examined the performance of SGD and Adam for VLGCN.The following observations were carried out:
1) Regarding the diameter grading task,SGD and Adam are identical.As indicated in rows 4 and 6 in Table 10,the assessment results of “VLGCN w/i GAP w/i SGD’ and “VLGCN w/i GAP w/i Adam’’ schemes are the same.
2) The performance improvement brought about by SGD in the appearance grading task is much superior to that of Adam.“VLGCN w/i GMP w/i SGD” and “VLGCN w/i GAP w/i SGD” (rows 8 and 9 in Table 10) are superior to “VLGCN w/i GMP w/i Adam” and “VLGCN w/i GAP w/i Adam” (rows 10 and 11 in Table 10) in terms of accuracy by 0.33 and 0.11%,respectively.
3) In the fine-grained orange grading task (rows 12 and 16 in Table 10),“VLGCN w/i GAP w/i SGD” is inferior to “VLGCN w/i GAP w/i Adam” by 0.16% in terms of accuracy.
In summary,since GCN is capable of learning the topological semantics of feature maps,it is ideal for different grading tasks.Secondly,the scheme “VLGCN w/i GAP w/i SGD” is acceptable for the appearance grading task,whereas “VLGCN w/i GAP w/i Adam” is more suitable for learning fine-grained orange features.The reason is that the performance of SGD in coarse-grained grading is more stable,while it is easier for Adam to make“VLGCN w/i GAP” reach the global optimum in the finegrained grading task.
4.3.Comparison with other methods
We compared the performance of VLGCN with other classification approaches,including VGG19,ResNet,ResNetXt101,HRNet,EfficientNet,Conformer,Twins-SVT,and RepVGG.All of these methods carry out identical orange bounding box extraction and data augmentation to ensure that experiment results are comparable.
The detailed comparison results between VLGCN and other approaches for multi-grained orange grading tasks are provided in Tables 11–13.VLGCN surpasses other approaches in all three orange quality grading tasks.In terms of grading accuracy,VLGCN is superiorto RepVGG by 0.22% for diameter sizes,0.56% for appearance grades,and 0.28% for fine-grained orange quality grading.

Table 11 Performance comparison with other methods on diameter size grading task (%)
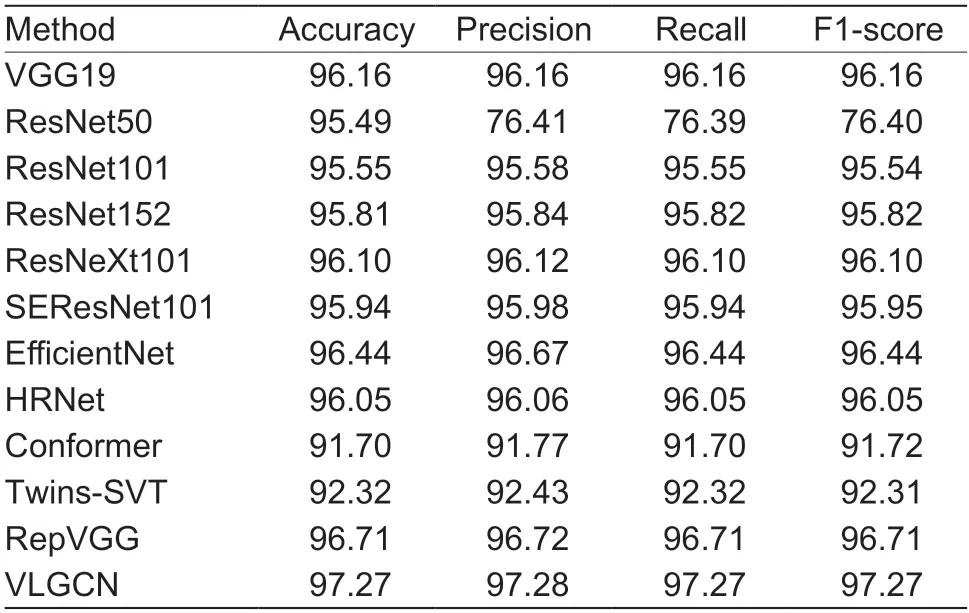
Table 12 Performance comparison with other methods on appearance grading task (%)

Table 13 Performance comparison with other methods on fine-grained orange grading task (%)
The aforementioned results indicate that VLGCN has superior learning ability for fine-grained orange features than other approaches,as well as strong robustness in multi-grained orange quality grading tasks,as shown in Fig.11.
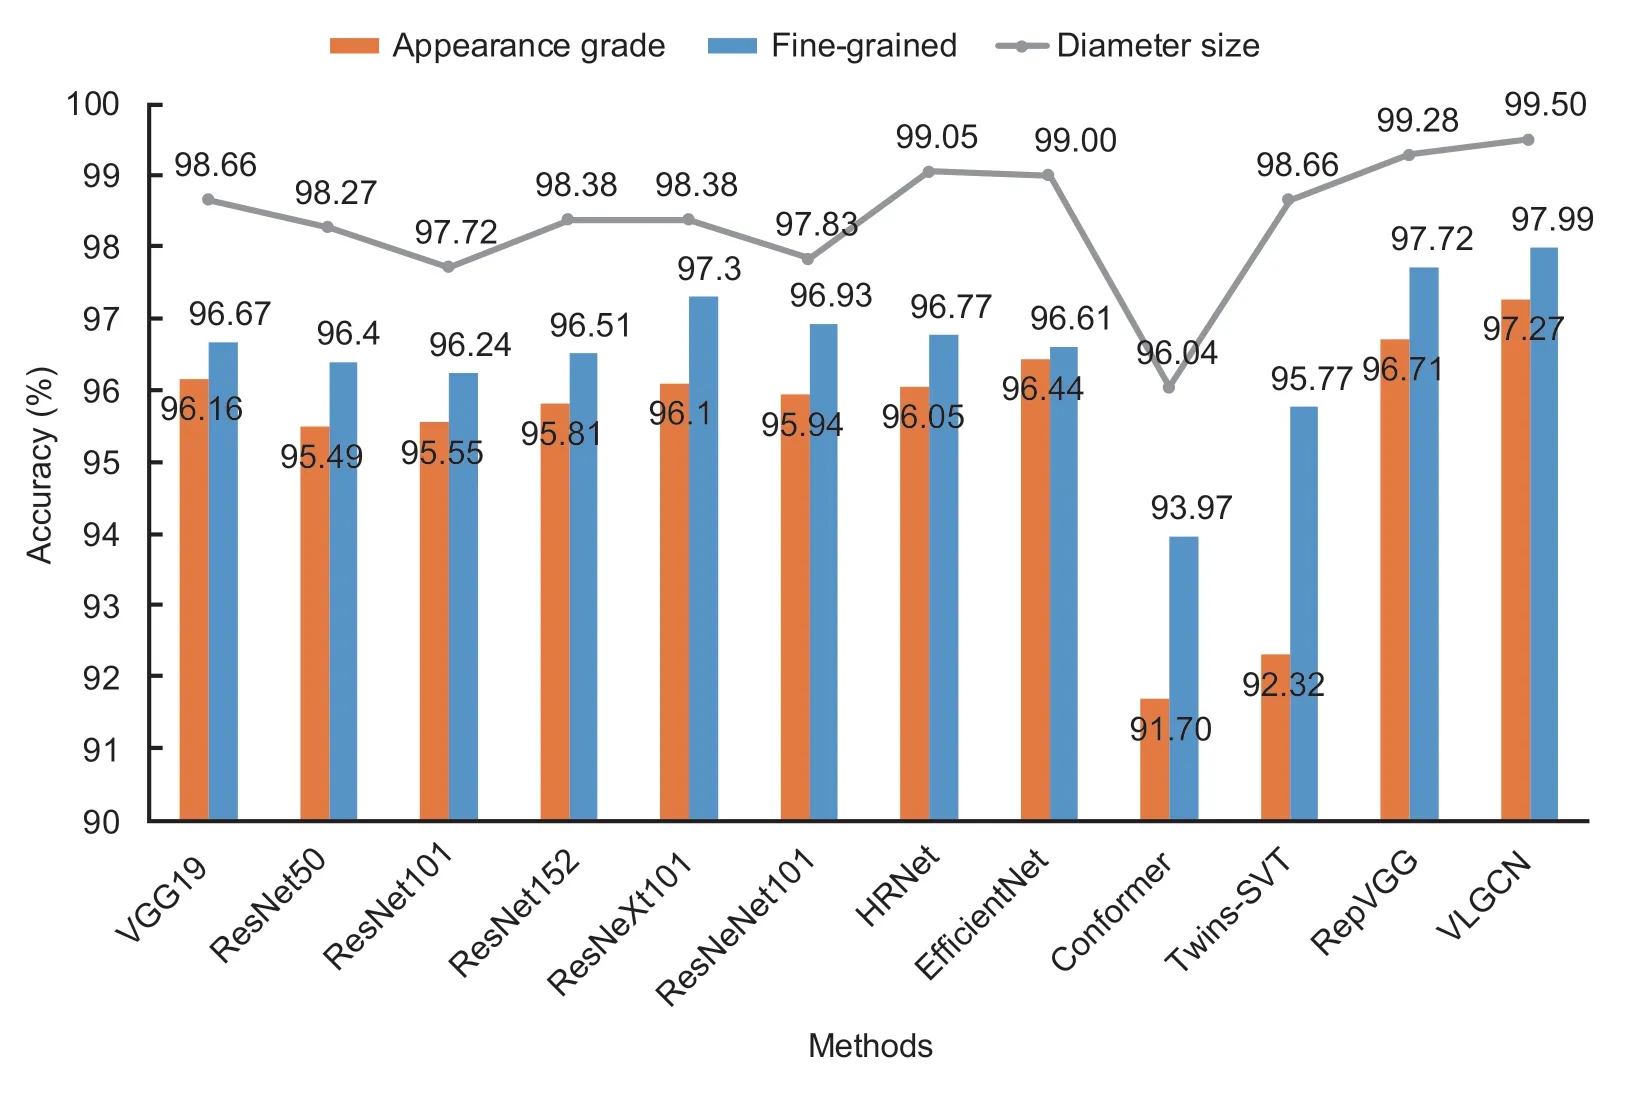
Fig.11 Visualization of approach outcomes for multi-grained orange quality grading tasks.
5.Conclusion
This research introduced VLGCN,a multi-view visual learning graph convolution method for multi-grained orange quality grading,which can accurately recognize the diameter sizes and appearance grades of orange images captured from any viewing angle.
The VL backbone network of the presented VLGCN is composed of functional modules such as orange boundary detection,data augmentation,and visual feature extraction,which are applied for the global feature extraction of oranges in the original image.The GCN is used to learn the high-level topological semantics from orange feature maps to further identify fine-grained and differentiated visual features of oranges.
We evaluated the proposed VLGCN method’s grading performance with different modules and configurations on multi-grained orange grading tasks.VLGCN outperforms other approaches in diameter size grading,appearance grading,and fine-grained quality grading of oranges,with respective grading accuracy of 99.50,97.27,and 97.99%.
However,when numerous oranges are adjacent in a single image,the bounding boxes detected by the VL backbone network are likely to contain visual features of multiple oranges,resulting in quality grading errors.Future research would therefore examine leveraging instance segmentation to accomplish global feature extraction for each orange.
Acknowledgements
This work was supported by the National Natural Science Foundation of China (31901240 and 31971792),the Science and Technology Innovation Program of the Chinese Academy of Agricultural Sciences (CAAS-ASTIP-2016-AII),and the Central Public-interest Scientific Institution Basal Research Funds,China (Y2022QC17 and CAAS-ZDRW202107).
Declaration of competing interest
The authors declare that they have no conflict of interest.
杂志排行
Journal of Integrative Agriculture的其它文章
- Less hairy leaf 1,an RNaseH-like protein,regulates trichome formation in rice through auxin
- Characterization of a blaCTX-M-3,blaKPC-2 and blaTEM-1B co-producing lncN plasmid in Escherichia coli of chicken origin
- Consumers’ experiences and preferences for plant-based meat food: Evidence from a choice experiment in four cities of China
- Farmers’ precision pesticide technology adoption and its influencing factors: Evidence from apple production areas in China
- lnfluence of two-stage harvesting on the properties of cold-pressed rapeseed (Brassica napus L.) oils
- Reduction of N2O emissions by DMPP depends on the interactions of nitrogen sources (digestate vs.urea) with soil properties
