Effect of the L-D1 alleles on leaf morphology,canopy structure and photosynthetic productivity in upland cotton (Gossypium hirsutum L.)
2023-01-06JlANGHuiGAOMingweiCHENYingZHANGChaoWANGJiabaoCHAlQichaoWANGYongcuiZHENGJinxiuWANGXiuliZHAOJunsheng
JlANG Hui ,GAO Ming-wei ,CHEN Ying ,ZHANG Chao ,WANG Jia-bao ,CHAl Qi-chao ,WANG Yong-cui,ZHENG Jin-xiu,WANG Xiu-li,ZHAO Jun-sheng,
1 Institute of Industrial Crops,Shandong Academy of Agricultural Sciences,Jinan 250100,P.R.China
2 College of Life Sciences,Shandong Normal University,Jinan 250014,P.R.China
Abstract One of the most important objectives for breeders is to develop high-yield cultivars.The increase in crop yield has met with bottlenecks after the first green revolution,and more recent efforts have been focusing on achieving high photosynthetic efficiency traits in order to enhance the yield.Leaf shape is a significant agronomic trait of upland cotton that affects plant and canopy architecture,yield,and other production attributes.The major leaf shape types,including normal,sub-okra,okra,and super-okra,with varying levels of lobe severity,are controlled by a multiple allelic series of the D-genome locus L-D1.To analyze the effects of L-D1 alleles on leaf morphology,photosynthetic related traits and yield of cotton,two sets of near isogenic lines (NILs) with different alleles were constructed in Lumianyan 22 (LMY22) and Lumianyan 28 (LMY28) backgrounds.The analysis of morphological parameters and the results of virus-induced gene silencing (VIGS) showed that the regulation of leaf shape by L-D1 alleles was similar to a gene-dosage effect.Compared with the normal leaf,deeper lobes of the sub-okra leaf improved plant canopy structure by decreasing the leaf area index (LAI) and increasing the light transmittance rate (LTR),and the mid-range LAI of sub-okra leaf also guaranteed the accumulation of cotton biomass.Although the chlorophyll content (SPAD) of sub-okra leaf was lower than those of the other two leaf shapes,the net photosynthetic rate (Pn) of sub-okra leaf was higher than those of okra leaf and normal leaf at most stages.Thus,the improvements in canopy structure,as well as photosynthetic and physiological characteristics,contributed to optimizing the light environment,thereby increasing the total biomass and yield in the lines with a sub-okra leaf shape.Our results suggest that the sub-okra leaf may have practical application in cultivating varieties,and could enhance sustainable and profitable cotton production.
Keywords: photosynthesis,canopy structure,yield,biomass,sub-okra leaf shape
1.lntroduction
In the first Green Revolution,the yield potential of crops was increased through a combination of breeding for improved morphology-related traits,such as harvest index,and increased inputs of water and fertilizer.While this strategy has sustained yield increases since the 1960s,it is neither sufficient nor sustainable,especially in China (Xuet al.2017).Further increases in the yield potential must rely in large part on improved photosynthesis,in which the leaf and canopy photosynthesis seem to be the keys in the context of enhancing the efficiency of light conversion into biomass (Murchieet al.2009;Zhuet al.2010).
Cotton (Gossypiumspp.) is the most important natural textile fiber crop in the world.Upland cotton (G.hirsutumL.),an AD1-genome tetraploid species,dominates most global cotton production because of its high lint yield (Fanget al.2017).The leaf is the most important photosynthetic organ of cotton,and leaf morphology can significantly modify the canopy penetration of sunlight,and consequently yield (Duet al.2009;Fenget al.2016;Wanget al.2021;Zhanget al.2022).The leaf shape of most upland cotton varieties is designated as the normal type,with three to five rather shallow sinuses,but other leaf shapes also exist,such as sub-okra,okra and super okra,which have varying depths of indentations (Appendix A).These four major leaf shapes are controlled by theL-D1locus encoded homodomain leucine-zipper class I protein on chromosome 15 (Andreset al.2014,2017;Changet al.2016;Zhuet al.2016;Heet al.2018).Several studies have attributed various production advantages to specific leaf shapes (Zhuet al.2005,2008;Andreset al.2016).Although the effects of leaf shape on boll rot resistance,earliness,flowering rate,chemical spray penetration,and lint trash were consistent (Jones 1982;James and Jones 1985;Wells and Meredith 1986),the effects of leaf shape on various insect resistances,yield,photosynthetic rate,and water use efficiency have not been consistent across studies (Wilson 1990;Pettigrewet al.1993;Jianget al.2015;Andreset al.2016).
In the past 70 years,cotton production has developed rapidly in China based on cultivar improvement and intensive farming technologies (Dai and Dong 2014;Yuet al.2016;Fenget al.2022).Almost all varieties have the normal leaf shape,so maximizing light interception in the middle and lower layers in the condition of higher density is challenging.Deterioration of the light environment in the lower part of the canopy due to heavy upper canopy foliage has been associated with low source-to-sink interaction of assimilates,which limits the yield of lower bolls (Niinemets 2007,2016).Light attenuation within rows of cotton is influenced by architecture,which is defined by the size,shape and orientation of shoot components (Chapepaet al.2020).Maximum light utilization in cotton production can be realized by modifying the plant canopy components,so the selection of varieties with a good geometry and leaf shape is very important for optimizing the light distribution in the whole canopy.Although previous studies have indicated the potential of the okra leaf shape in the development of cotton hybrids,senescence induced by the limited leaf area can influence yield and fiber quality(Maet al.2006;Zhuet al.2008;Duet al.2009;Fenget al.2012a,b).Compared with the okra leaf shape,the sub-okra leaf shape has a larger leaf area,and its lobe depth is greater than that of the normal leaf,so the subokra leaf shape has great potential for the breeding of varieties with high photosynthetic efficiency.
The main objective of this study was to compare the effects ofL-D1alleles on leaf morphology,canopy structure,yield and fiber quality.Some morphological and physiological traits that are closely associated with cotton growth,namely leaf area index (LAI),light transmittance rate (LTR),relative chlorophyll content (SPAD value),leaf net photosynthetic rate (Pn) and biomass of each organ,were investigated to elucidate the biological process by which the leaf shape affects cotton yield.The results of this study will provide useful information for the development of upland cotton varieties with higher photosynthetic efficiency.
2.Materials and methods
2.1.Plant materials
This study was conducted at the experimental station of the Shandong Cotton Research Center in Linqing(115°41´E,36°61´N).The plant materials used in this study are listed in Appendix B.LMY22 NORMAL and LMY28 NORMAL are adapted commercial varieties grown in the Yellow River Basin Cotton Region of China.The super okra leaf shape of LMY22 SUPER OKRA and LMY28 SUPER OKRA was introduced from R132163(which has a super okra leaf shape),the okra leaf shape of LMY22 OKRA and LMY28 OKRA was introduced from T586 (which has an okra leaf shape),and the sub-okra leaf shape of LMY28 SUBOKRA and LMY22 SUBOKRA was introduced from S131189 (which has a sub-okra leaf shape).These three donor parents,R132163,T586 and S131189,were backcrossed with LMY22 NORMAL and LMY28 NORMAL for eight generations.The isogenic lines with the same background differed only in leaf shape.
Lines with okra,sub-okra and normal leaf shapes were planted on 25 April,2017 and 27 April,2018 in plots with six rows spaced 76 cm apart.The length of each row was 8 m,and each row was thinned to five plants m–1to guarantee a density of 60 000 plants ha–1.For each genetic background,three lines with different leaf shapes were arranged into a randomized complete block design with three replicates.Six F1lines (nos.5–7,nos.12–14) were also planted for the measurement of leaf morphological traits in 2018.The field management procedures followed common practices in cotton production as described previously (Daiet al.2015).
Materials for VIGS (nos.8–11) were planted in an artificial climate chamber,in which the photoperiod was 16 h of light and 8 h of darkness,and the temperature was set at 23°C.
2.2.Data collection
Data on the yield,lint,fiber quality and physiological traits were collected from 2017 to 2018.Morphological and molecular biological data were collected in 2018 and 2019,respectively.
Measurement of leaf morphological traitsThe reciprocal fourth leaf was selected for the measurements of six leaf morphological traits at the full-bloom stage,including main lobe length (L),main lobe depth (L1),second lobe depth (L2),leaf width (W),main lobe width(W1),second lobe width (W2),and third lobe width(W3).The main lobe depth ratio (RL1) was calculated as RL1=L1/L.The second lobe depth ratio (RL2) was calculated as RL2=L2/L.The main lobe width ratio (RW1)was calculated as RW1=W1/W.The second lobe width ratio (RW2) was calculated as RW2=W2/W.The third lobe width ratio (RW3) was calculated as RW3=W3/W.Image J Software (https://imagej.nih.gov/ij/download.html)was used to calculate leaf area based on pictures taken by a scanner (HP Scanjet G4050).To measure the leaf rolling index (LRI) of leaves with sub-okra and normal leaf shapes,the distances from the marginal intersection of the main and second lobes to the leaf cushion in the unfolding state (LW1) and the natural state (LN1) were measured,as well as the distances between the two marginal intersections of the main and second lobes in the unfolding state (LW2) and the natural state (LN2).LRI was calculated as LRI (%)=(LW–LN)/LW×100.For related measurements of the second and third lobes,the averages of the corresponding lobes on opposite sides of the leaf were calculated.Ten individuals were selected for each line.Leaves with super okra shapes were not used for measurements of the morphological traits,because the lobed leaves were reduced to a single linear blade at the full-bloom stage.
Yield,lint and fiber qualityThe yield was determined from three central rows per plot at harvest.Cotton was manually harvested twice on 10 October and 30 October in each crop year.After sun-drying for 7 days,seed cotton was weighed and ginned.Ginned cotton from each plot was sampled to test the lint and fiber quality.The fiber quality was judged by High Volume Inspection(Uster Technologies,Switzerland).
Physiological measurementsPhysiological parameters,including chlorophyll content,photosynthetic rate and accumulation of biomass,were determined using four plants randomly selected from each plot at 20,45,70,100,and 130 DAS (days after sowing).The measurements were taken during 9:00–10:00 a.m.in sunny,windless weather conditions.The LAI and LTR values of different canopy layers were measured before artificial topping (70 DAS) and 20 days after artificial topping (90 DAS).
For measuring the chlorophyll content during the growth stage,the SPAD values (relative chlorophyll content) of the fourth leaf below the main stem terminal before topping and the second from the top after topping were measured with a SPAD-502 Chlorophyll Meter(Konica Minolta Holdings,Inc.,Tokyo,Japan).Pnrates of the same leaves were also calculated with a Li-6800 portable photosynthesis system (Li-Cor,Lincoln,NE,USA).
To measure biomass values at different stages,randomly selected plants were removed from the soil by hand.For each plant,the biomasses of root,stem,leaf and fruit were recorded after drying at 108°C for 30 min and then at 80°C to a constant weight.
LAI values of the upper (UL,2/3-height positions of the canopy),middle (ML,1/3-height positions of the canopy)and lower canopy layers (LL,bottom of the canopy) were collected with an AccuPAR LP-80 (METERGroup,Inc.,Pullman,USA).For the measurement of LTR,PAR of 30 cm above the top of the canopy,UL,ML and LL were recorded asPI,PU,PM,andPL,respectively.LTR was then calculated as follows: LTR (%)=PN/PI×100 (N=U,M,L).
Quantitative real time PCR analysisTotal RNA was extracted from cotton leaf primordia at the seedling stage in the VIGS experiment using the Plant Total RNA Extraction Kit (BioFlux,cat: BSC65S1).The cDNA was generated using the HiScript III RT SuperMix for qPCR(+gDNA wiper) Kit (Vazyme,cat: R323–01).The cotton Histone 3 gene (GenBank accession number: AF024716)was used as the reference gene.The sequences of the qRT-PCR primers are listed in Appendix C.The qRT-PCR products were quantified with a LightCycler®480 System(Roche,Basel,Switzerland) and a ChamQ Universal SYBR®qPCR Master Mix Kit (Vazyme,cat: Q711–02).
VlGS assayThe cDNA for cloning the 3´UTR ofL2swas generated from the leaf primordium of LMY28 SUPER OKRA with an EasyScript®First-Strand cDNA Synthesis SuperMix Kit (TransGen,cat: AE301–02).The genespecific primers and anchored primers used to obtain the cDNA fragment are listed in Appendix C.A 349-bp fragment from the 3´ end of theL2scDNA was cloned intoXbaI–BamH1-digested pTRV2 with the ClonExpress®II One Step Cloning Kit (Vazyme,cat: C112),generating a pTRV2-L2sconstruct.The two vectors,pTRV1 and pTRV2-L2s,were introduced intoAgrobacterium tumefaciensstrain GV3101.More than 10 individuals for each isogenic line were infiltrated with a 1:1 mixture ofAgrobacteriumwith pTRV1 and pTRV2 as a negative control,or with pTRV1 and pTRV2-L2s,separately.The primers used for the construction of the VIGS vectors are also listed in Appendix C.The VIGS assay was carried out according to the methods described previously (Changet al.2016).
2.3.Data statistics
SigmaPlot Software V10.0 (Systat Software,Inc.) was used to draw the graphs.The Data Processing System(DPS) was adopted to analyze the variance (Tang and Feng 1997).Means were separated with Duncan’s multiple range tests atP<0.05 andP<0.01.
3.Results
3.1.Leaf morphology
TheL-D1allelic series conferred increasingly lobed leaf shapes,which exhibited a possible effect of gene dosage.To explore the effect ofL-D1alleles on leaf morphological traits,the 3´ end fragments ofL2swere cloned into pTRV2 vectors to construct pTRV2-L2svectors for silencing theL-D1alleles.Fifty days after the induction of TRVmediated gene silencing,the super okra leaf,okra leaf and sub-okra leaf exhibited shapes similar to the okra leaf,sub-okra leaf and normal leaf control,respectively(Fig.1-A,B,D,and E).The RL1 values of super okra leaf,okra leaf and sub-okra leaf were reduced significantly as compared with their negative controls (Fig.1-F).The results of qRT-PCR analysis showed that the transcripts ofL-D1alleles were also down-regulated in the pTRV2-L2sVIGS lines (Fig.1-C).
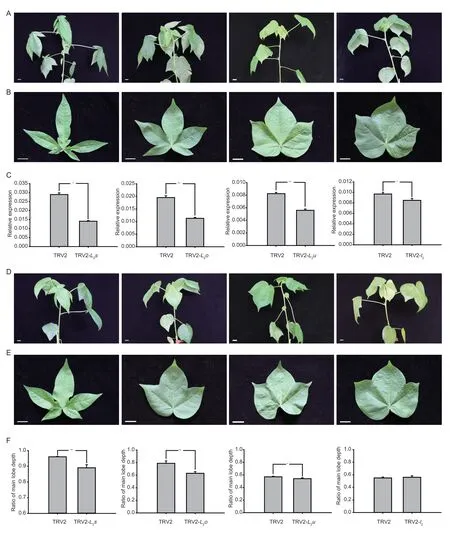
Fig.1 Virus-induced gene silencing (VIGS) phenotypes and suppression of L-D1 allele transcripts.A,uninfected lines.B,the 6th leaf of uninfected lines.C,relative expression of L-D1 alleles.D,infected lines.E,the 6th leaf of infected lines.F,RL1 of the 6th leaf of infected lines and their control lines.n=1 (super okra leaf),2 (okra leaf),3 (sub-okra leaf) and 4 (normal leaf).Scale bar,1 cm.Values are mean±SE.The statistical significance of differences was determined using the t-test.*,P<0.05;**,P<0.01.
The morphological traits of leaves controlled by different combinations ofL-D1alleles were also investigated in field conditions.In both genetic backgrounds,the RL1 of okra leaves was the largest,followed by that of hybridized leaf shapes between super okra and normal leaves,sub-okra shape,hybridized leaf shape between sub-okra and normal leaves,and normal leaves.Regarding RL2,a similar trend was observed among the different leaf shapes.However,RW1,RW2,RW3 and LA exhibited the opposite trend.There were no obvious patterns regarding A1 and A2 (Table 1).Significant (P<0.01) correlations between most traits indicated thatL-D1alleles could regulate LA gradually by changing the width and depth of the leaf lobes (Table 2).Furthermore,compared with normal leaf,sub-okra leaf also exhibited an obvious characteristic of adaxially-rolling at the marginal intersection of the main and second lobes(Appendices A and D).

Table 1 Morphological traits of the different leaf shapes1)

Table 2 Correlations among different morphological traits1)
3.2.Leaf area index (LAl) and light transmittance rate (LTR)
Altering the leaf shape directly contributed to changes in LAI and LTR (Figs.2 and 3).The LAI of the upper layer of lines with sub-okra leaf was higher than those of lines with the other two leaf shapes before topping,and the LAI value was between those of okra leaf lines and normal leaf lines after topping.Regarding the LAI of ML,the LAI values of lines with sub-okra leaf were always between those of lines with the other two leaf shapes before and after topping.The LAI of LL is often cited to describe the leaf source capacity of the whole plant at any given time.The LAI values of LMY22 SUBOKRA were 8.54 and 8.48% lower than those of LMY22 NORMAL before and after topping,respectively (Fig.2-A–D).The LAI values of LMY28 SUBOKRA were 4.91 and 11.19% lower than the corresponding values of LMY28 NORMAL (Fig.2-E–H).

Fig.2 Leaf area index (LAI) values of different canopy layers of isogenic lines.A and B,LAI of different canopy layers of isogenic lines before topping in the background of LMY22 in 2017 and 2018.C and D,LAI of different canopy layers of isogenic lines after topping in the background of LMY22 in 2017 and 2018.E and F,LAI of different canopy layers of isogenic lines before topping in the background of LMY28 in 2017 and 2018.G and H,LAI of different canopy layers of isogenic lines after topping in background of LMY28 in 2017 and 2018.UL,ML and LL indicate the upper,middle and lower layers of the canopy,respectively.Bars mean SE (n=4).Different lowercase letters indicate significant differences at P<0.05.
Compared to lines with normal leaf,the LTR of the whole canopy increased in lines with sub-okra leaf.In particular,the LTR values of ML and LL increased by 71.35 and 123.14% in the background of LMY22 before topping,respectively,and by 134.88 and 41.81% after topping,respectively (Fig.3-A–D).In the background of LMY28,the LTR of ML and LL increased by 38.99 and 28.15% before topping,respectively,and by 93.10 and 118.62% after topping,respectively (Fig.3-E–H).As expected,the decreasing of LAI and increasing of LTR showed that the canopy structures of lines with sub-okra leaf were better than those of lines with normal leaf.
3.3.Pn and SPAD value
Near-isogenic lines with sub-okra leaf exhibited higherPnvalues at most growth stages (Fig.4).In the background of LMY22,thePnvalues of sub-okra leaf were 4.3,2.12,4.25,0.93,and 12.45% higher than those of normal leaf at each stage,respectively,and 7.28,7.18,20.03,and 19.68% higher than the corresponding values of okra leaf from 45 to 130 DAS,respectively (Fig.4-A and B).In the background of LMY28,thePnvalues of sub-okra leaf were 13.84,9.67,7.12,7.49,and 10.20% higher than those of normal leaf,and also 14.64,1.1,15,12.13,and 39.53% higher than those of okra at each stage,respectively (Fig.4-C and D).Contrary to the trend ofPn,the chlorophyll content in sub-okra leaf was lower than those of the other two leaf shapes (Fig.5).In the background of LMY22,the SPAD values of sub-okra leaf were 2.12,5.76,3.10,4.01,and 5.48% lower than those of normal leaf at the five stages,respectively,and 2.96,9.04,10.78,8.46,and 7.52% lower than those of okra leaf from 20 to 130 DAS,respectively (Fig.5-A and B).In the background of LMY28,the SPAD values of subokra leaf were 6.08,3.7,8.87,6.80,and 4.19% lower than those of normal leaf,and also 7.62,6.45,8.78,5.95,and 7.36% lower than those of okra at each stage,respectively (Fig.5-C and D).
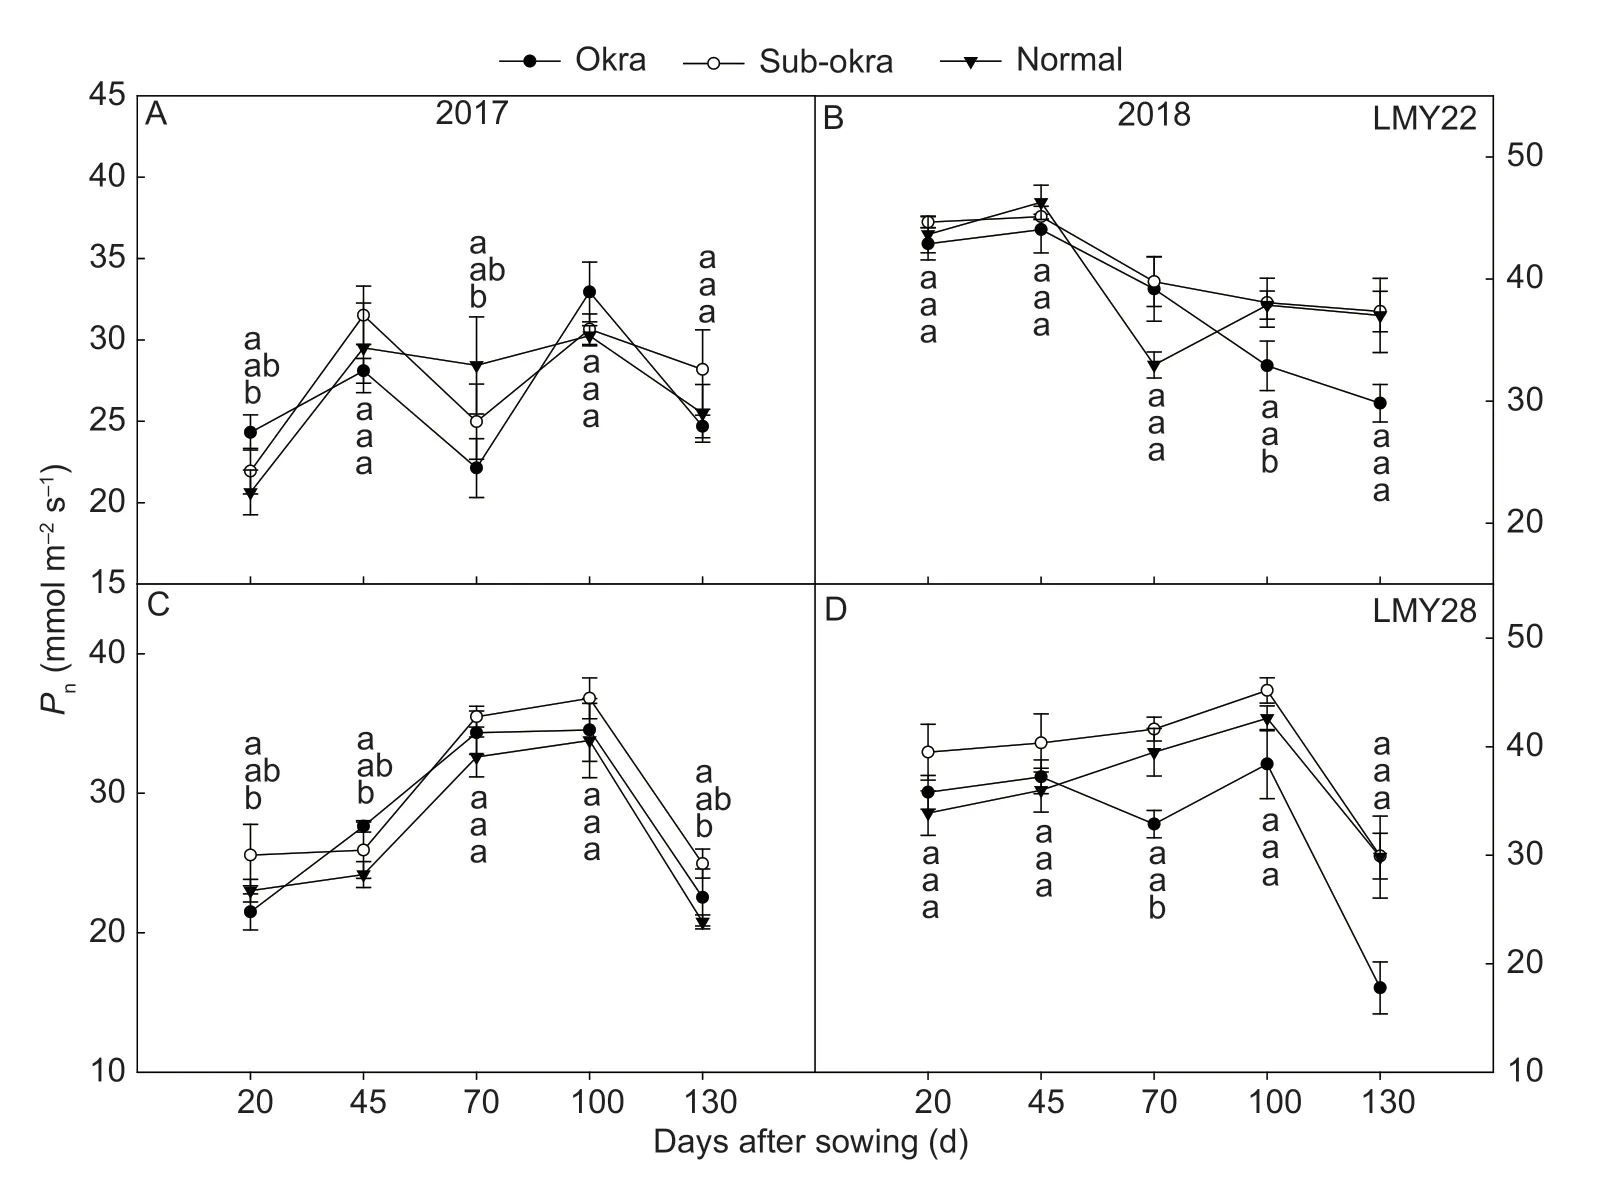
Fig.4 Net photosynthetic rates (Pn) of isogenic lines.A and B,Pn of isogenic lines in the background of LMY22 in 2017 and 2018.C and D,Pn of isogenic lines in the background of LMY28 in 2017 and 2018.Bars mean SE (n=5).Different lower-case letters indicate significant differences at P<0.05.
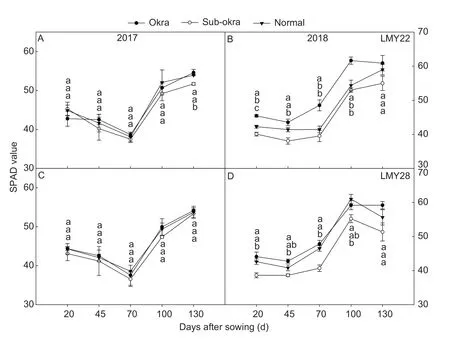
Fig.5 Relative chlorophyll contents (SPAD value) of isogenic lines.A and B,SPAD values of isogenic lines in the background of LMY22 in 2017 and 2018.C and D,SPAD values of isogenic lines in the background of LMY28 in 2017 and 2018.Bars mean SE (n=5).Different lower-case letters indicate significant differences at P<0.05.
3.4.Biomass,fiber yield and quality
As expected,with the improvements in canopy structure and photosynthetic rate,biomass accumulation was greater in lines with sub-okra leaf (Fig.6).The final biomass of lines with sub-okra leaf increased by 34.43 and 9.43%,respectively,in comparison with those of okra and normal leaf in the background of LMY22 (Fig.6-A and B),and by 43.22 and 19.35% in the background of LMY28,respectively (Fig.6-C and D).Regarding individual organs among the isogenic lines,the biomass values of stem and fruit were the largest in lines with subokra leaf for each genetic background (Appendix E).
With the increase in biomass,the yield values of lines with sub-okra leaf were the highest among the three lines (Table 3).In the genetic background of LMY22,the first harvest yield and total yield of lines with sub-okra leaf were 14.11 and 8.6% higher than those of lines with normal leaf,respectively.The first harvest yield and total yield of lines with sub-okra leaf also increased by 6.10 and 7.05%,respectively,compared with those of lines with normal leaf in the background of LMY28.Leaf shape had no negative effect on either lint percentage or fiber quality (Tables 3 and 4).
4.Discussion
The morphological changes of super okra,okra,sub-okra and normal leaf shapes controlled by a multiple allelic series of a single incompletely dominant genetic locusL-D1on chromosome 15 were similar to the effect caused by gene dosage.The results of VIGS and morphological trait analysis presented here supported this opinion(Fig.1;Table 1).The gradual changes in RL,RW and LA indicated that varieties with different shapes controlled by combinations ofL-D1alleles could be developed to meet the needs of different planting patterns.Moderate leaf rolling can not only be helpful for establishing ideal plant architecture,but it can also be beneficial for the improvement of stress tolerance in crops (Liuet al.2016;Baretet al.2018;Zhouet al.2018).Leaf rolling might be an advantage for optimizing canopy structure and drought tolerance in lines with sub-okra leaf.Our previous results have proven that the drought tolerance of lines with subokra leaf was better than in lines with normal leaf under drought stress (Zhenget al.2020).The higher yield indicated that the varieties with a sub-okra leaf shape might be more suitable than those with normal leaf in the present conditions (Table 3).
Leaf morphology could significantly affect canopy architecture,which directly affects light interception and the efficiency of light energy utilization (Fenget al.2016).Achieving an optimum canopy structure is the basis of high photosynthetic efficiency and high crop yields (Fenget al.2012a,b).L2oandL2uconferred increasingly lobed leaf shapes,in which the increased lobe depth and decreased lobe width could modify LAI and light penetration (Wellset al.1986).Our results showed that lines with sub-okra leaf exhibited intermediate LAI values,which were larger than those of lines with okra leaf and smaller than those of lines with normal leaf (Fig.2).With the decreasing of LAI,the LTR of UL and ML increased in lines with sub-okra and okra leaf shapes,and the light condition of LL also improved compared to lines with a normal leaf shape (Fig.3).Although maximizing leaf area index led to better yields,an appropriate reduction of LAI could increase the light energy supply of the lower leaves and the photosynthetic efficiency of the whole canopy (Songet al.2013).In the present study,the LAI values of lines with okra leaf were too small and tended to reduce the photosynthetic product and yield,while the slight decrease in LAI increased biomass and yield in lines with a sub-okra leaf shape (Fig.6;Table 3;Appendix E).Our results indicated that the insignificant decreasing of LAI and increasing of LTR ensured biomass synthesis and optimization of the canopy structure,which made lines with a sub-okra leaf shape perform better than lines with okra and normal leaf shapes.
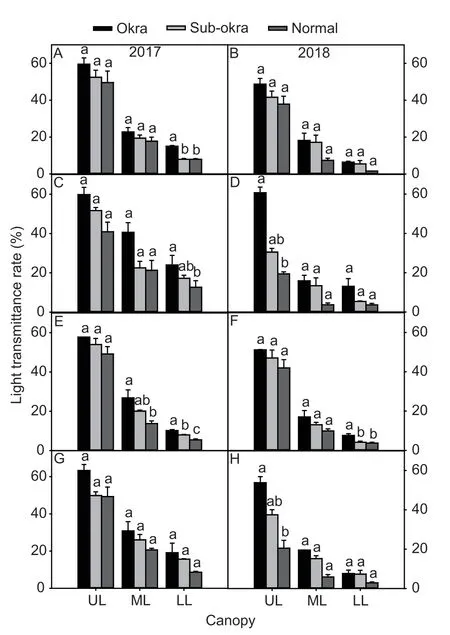
Fig.3 Light transmittance rates (LTR) of different canopy layers of isogenic lines (A and B) LTR of different canopy layers of isogenic lines before topping in the background of LMY22 in 2017 and 2018.C and D,LTR of different canopy layers of isogenic lines after topping in the background of LMY22 in 2017 and 2018.E and F,LTR of different canopy layers of isogenic lines before topping in the background of LMY28 in 2017 and 2018.G and H,LTR of different canopy layers of isogenic lines after topping in the background of LMY28 in 2017 and 2018.Bars mean SE (n=4).Different lower-case letters indicate significant differences at P<0.05.
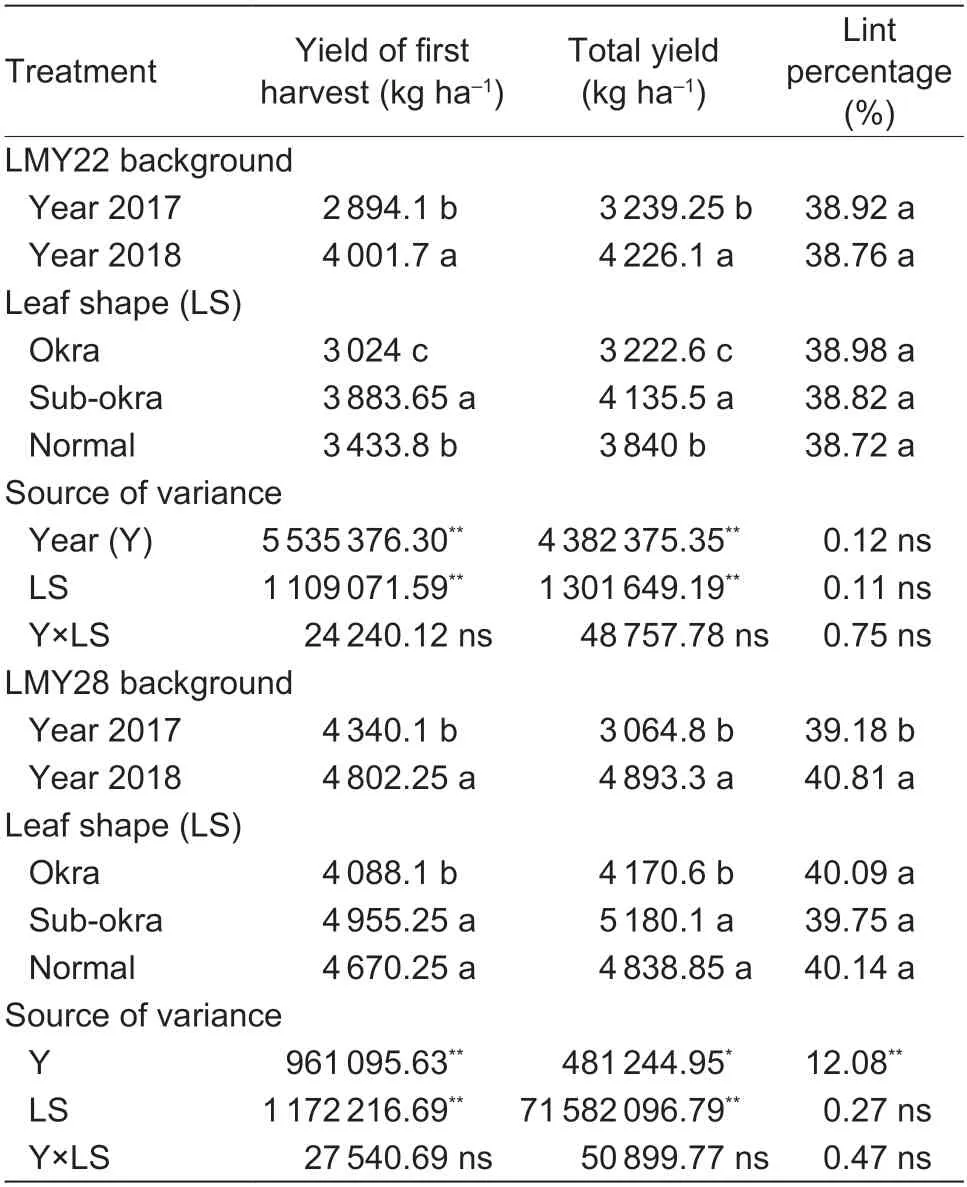
Table 3 Effect of leaf shape on yield and lint percentage
Photosynthesis is the most important process for plant growth and biomass production,so it is the driving force for yield formation (Raines 2011;Chenet al.2017,2018;Khanet al.2017).The close link between photosynthesis and yield was proven with elevated [CO2]experiments,in which yield was improved with increases inPn(Benderet al.1999;Mitchellet al.1999;Ainsworthet al.2004).The photosynthetic rate could reflect the productivity potential of a genotype,because the topmost,fully-expanded leaf is measured in the optimum physiological condition (Elmore 1980).Okra,sub-okra and its similar leaf (normal×okra) presented higher photosynthetic rates than normal leaf (Wellset al.1986).Semi-okra leaf (normal×super okra) also increased the photosynthetic rate in most growth stages (Zhuet al.2005).In this study,the photosynthetic rate of sub-okra leaf performed better than the other two leaf shapes in two genetic backgrounds (Fig.4).The increase inPnlaid a foundation for the improvement of yield in lines with sub-okra leaf.Leaf photosynthesis is also determined by biochemical properties (Songet al.2018).As one key factor,chlorophyll is responsible for the absorption of light energy.The chlorophyll content was closely related to yield,which increased with the SPAD peak value (Fenget al.2016).Our results showed that thePnand yield values of lines with sub-okra leaf increased with a slightlydecreasing SPAD value (Fig.5;Table 3).Some studies have reported that a reduction in chlorophyll content could increase the efficiency of PSII and light received by the leaves (Ortet al.2011;Xiaoet al.2016;Songet al.2017).This occurs because the light-harvesting antenna could rapidly and reversibly switch into a photoprotected quenched state,in which potentially harmful absorbed energy is dissipated as heat under conditions of excess sunlight (Alexanderet al.2007).Therefore,the relatively lower chlorophyll content of sub-okra leaf might help to alleviate the damage of high light intensity on the photosynthetic system and maintain a higher photosynthetic efficiency.However,this hypothesis needs to be verified with further experiments.
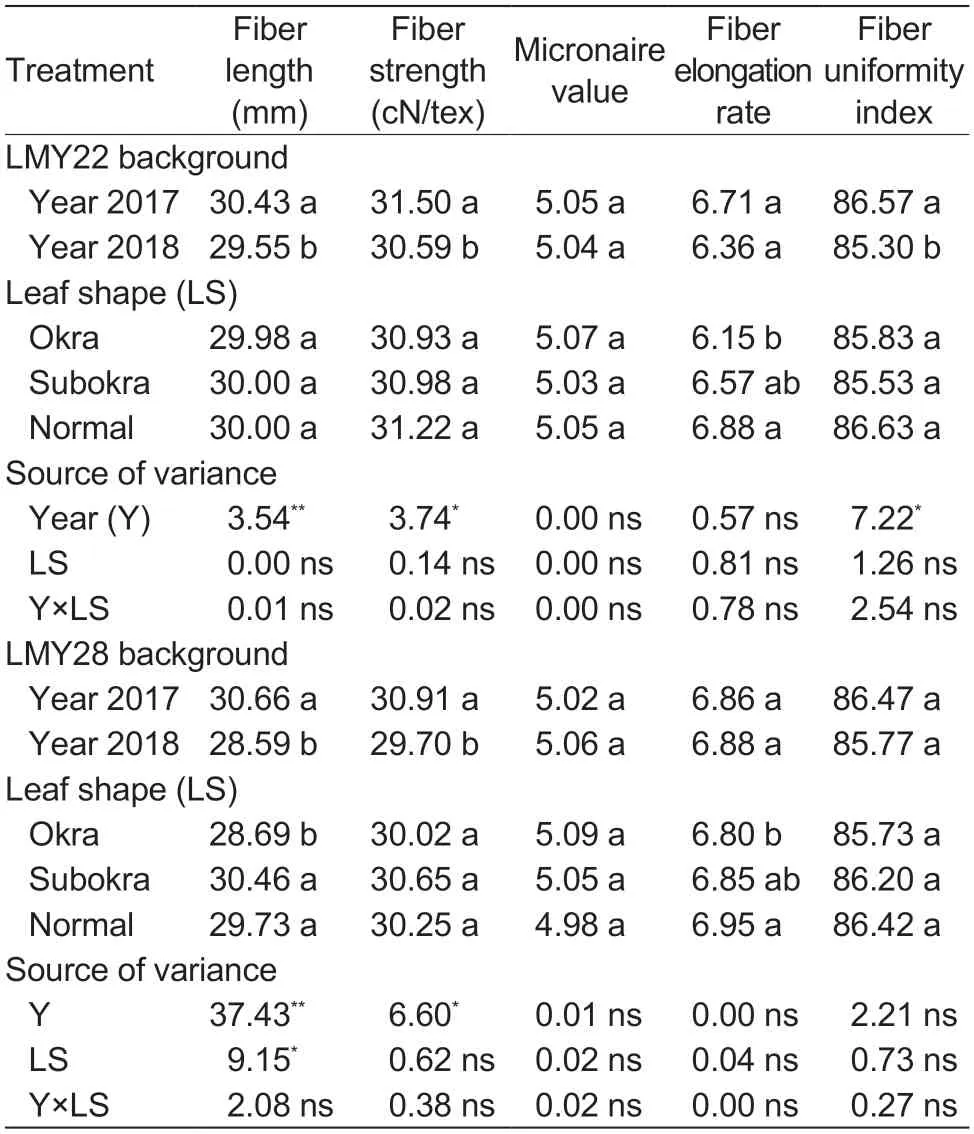
Table 4 Effect of leaf shape on fiber quality
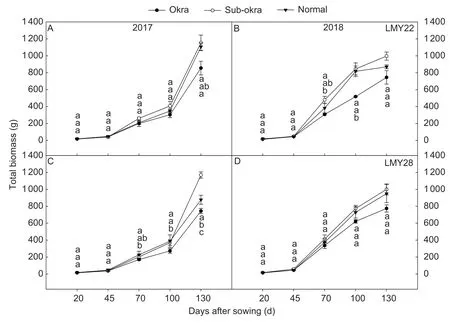
Fig.6 Total biomass of isogenic lines at different stages.A and B,biomass of isogenic lines in the background of LMY22 in 2017 and 2018.C and D,biomass of isogenic lines in the background of LMY28 in 2017 and 2018.Bars mean SE (n=3).Different lower-case letters indicate significant differences at P<0.05.
Our results showed that altering the sub-okra leaf shape contributed to serials advantages,such as reductions in LAI and chlorophyll content,or increases in LTR andPn.The data indicate that the co-optimization of canopy structure and photosynthesis increased the total biomass production and yield of lines with sub-okra leaf(Fig.6;Table 3),and the lint percentage and fiber quality were not affected at the same time (Tables 3 and 4).Although the increases in biomass and yield were insignificant in the genetic background of LMY28,the greater production of first harvest yield and total yield by no less than 6% indicated that the sub-okra leaf shape could be a useful trait for the development of cotton cultivars with high yield.
In present study,we mainly focused on the effect of leaf shape on canopy and photosynthetic characteristics under a single planting density.In addition,plant density was also shown to be an important factor that could optimize canopy light distribution and improve canopy photosynthetic capacity in cotton (Yaoet al.2016).Plant population density could influence plant size and alter the leaf azimuthal distribution.The optimum LAI could normally be achieved faster in a dense population as compared with a sparse population (Chapepaet al.2020).Therefore,it is necessary to study the effect of leaf shape on canopy structure and photosynthetic capacity under different planting densities in the next step.
5.Conclusion
Leaf shapes regulated by different combinations ofL-D1alleles play a key role in the improvement of canopy structure in upland cotton.The present study suggests that altering the leaf shape could lead to changes in the photosynthetic rate,chlorophyll content,canopy structure and biomass in cotton.Compared to lines with okra and normal leaf shapes,lines with sub-okra leaf possessed intermediate LAI,higher photosynthetic productivity,and could be used as potential germplasm for the breeding of high-yield cotton varieties with high photosynthesis rates.
Acknowledgements
This work was supported by the State Key Laboratory of Cotton Biology Open Fund,China (CB2021A18),the Youth Scientific Research Foundation of Shandong Academy of Agricultural Sciences,China (2016YQN09),the Improved Variety Project of Shandong Province,China(2020LZGC002) and the China Agriculture Research System of MOF and MARA (CARS-15-05).
Declaration of competing interest
The authors declare that they have no conflict of interest.
Appendicesassociated with this paper are available on http://www.ChinaAgriSci.com/V2/En/appendix.htm
杂志排行
Journal of Integrative Agriculture的其它文章
- Less hairy leaf 1,an RNaseH-like protein,regulates trichome formation in rice through auxin
- Characterization of a blaCTX-M-3,blaKPC-2 and blaTEM-1B co-producing lncN plasmid in Escherichia coli of chicken origin
- Consumers’ experiences and preferences for plant-based meat food: Evidence from a choice experiment in four cities of China
- Farmers’ precision pesticide technology adoption and its influencing factors: Evidence from apple production areas in China
- Visual learning graph convolution for multi-grained orange quality grading
- lnfluence of two-stage harvesting on the properties of cold-pressed rapeseed (Brassica napus L.) oils
