Agronomic management practices in dryland wheat result in variations in precipitation use efficiency due to their differential impacts on the steps in the precipitation use process
2023-01-06YANGWenjiaLlYulinLlUWeijianWANGShiwenYlNLinaDENGXiping
YANG Wen-jia ,Ll Yu-lin ,LlU Wei-jian ,WANG Shi-wen, ,YlN Li-na,,DENG Xi-ping
1 State Key Laboratory of Soil Erosion and Dryland Farming on the Loess Plateau,College of Natural Resources and Environment,Northwest A&F University,Yangling 712100,P.R.China
2 College of Life Sciences,Northwest A&F University,Yangling 712100,P.R.China
3 Institute of Soil and Water Conservation,Northwest A&F University,Yangling 712100,P.R.China
4 Institute of Soil and Water Conservation,Chinese Academy of Sciences &Ministry of Water Resources,Yangling 712100,P.R.China
Abstract Yield loss due to low precipitation use efficiency (PUE) occurs frequently in dryland crop production.PUE is determined by a complicated process of precipitation use in farmland,which includes several sequential steps: precipitation infiltrates into the soil,the infiltrated precipitation is stored in soil,the soil-stored precipitation is consumed through transpiration or evaporation,transpired precipitation is used to produce dry-matter,and finally dry-matter is re-allocated to grains.These steps can be quantified by six ratios: precipitation infiltration ratio (SW/SWe;SW,total available water;SWe,available soil water storage at the end of a specific period),precipitation storage ratio (SWe/P;P,effective precipitation),precipitation consumption ratio (ET/SW;ET,evapotranspiration),ratio of crop transpiration to evapotranspiration (T/ET;T,crop transpiration),transpiration efficiency (B/T;B,the increment of shoot biomass) and harvest index (Y/B;Y,grain yield).The final efficiency is then calculated as: Quantifying each of those ratios is crucial for the planning and execution of PUE improvements and for optimizing the corresponding agronomic practices in a specific agricultural system.In this study,those ratios were quantified and evaluated under four integrated agronomic management systems.Our study revealed that PUE and wheat yield were significantly increased by 8–31%under manure (MIS) or biochar (BIS) integrated systems compared to either conventional farmers’ (CF) or high N (HN)integrated systems.In the infiltration and storage steps,MIS and BIS resulted in lower SWe/P but higher SW/SWe compared with CF and HN.Regarding the consumption step,the annual ET/SW under MIS and BIS did not increase due to the higher ET after regreening and the lower ET before regreening compared with CF or HN.The T/ET was significantly higher under MIS and BIS than under CF or HN.In the last two steps,transpiration efficiency and harvest index were less strongly affected by the agronomic management system,although both values varied considerably across the different experimental years.Therefore,attempts to achieve higher PUE and yields in rainfed wheat through agronomic management should focus on increasing the T/ET and SW/SWe,while maintaining ET/SW throughout the year and keeping SWe/P relatively low at harvest time.
Keywords: precipitation use process,precipitation use efficiency,yield,rainfed agriculture
1.lntroduction
Drylands cover 41% of the Earth’s terrestrial surface and feed 35% of the global population (Mortimoreet al.2009).Rainfed agriculture,in which precipitation is the only water source for crop growth,is the main farming system in drylands,accounting for approximately 75% of global croplands (Bradfordet al.2017).Water deficiency is prevalent during the growing season due to low-rainfall and erratic precipitation events in the dryland areas (Kodur 2017).Furthermore,large amounts of stored precipitation in rainfed farmland are lost through soil evaporation due to the high air temperatures and high vapor pressure deficits,leading to low precipitation use efficiency (PUE)and corresponding crop yields (Angus and Herwaarden 2001).Thus,it is crucial to store the precipitation in the farmland and maximize its usage by the crops as much as possible in drylands.In other words,the principal approach for increasing crop yield in rainfed agriculture is to obtain more precipitation for crop use and improve PUE.

In rainfed farmland,a drop of precipitation will go through a complicated series of steps before producing grains.Thus,PUE is profoundly affected by these processes,which include several sequential steps:precipitation is stored in the soil (storage step),the soilstored precipitation is consumed through crop transpiration or soil evaporation (consumption step),and the transpired precipitation is ultimately used to produce grains (last step) (Pilbeamet al.1995;Liu 1997;Siahpoosh and Dehghanian 2012).The precipitation storage step affects PUE by influencing the amount of precipitation retained by the soil,and the precipitation consumption step affects PUE by determining the total amount of precipitation that can eventually be used by the crops (Liu 1997).The last step affects PUE by directly influencing grain yield (Turner 2004).Thus,quantifying and regulating these steps are the fundamental and effective strategy for planning and executing improvements in PUE.Considering this complicated process,Liu (1997) proposed an equation that contains four ratios to quantify the above steps in order to assess PUE in dryland farming system:In this equation,the precipitation storage step is quantified by SW/P (ratio of total available water to precipitation),where SW is the total available water,which is the sum of the available soil water storage (at the beginning of a specified period) and P is the effective precipitation during that period.The precipitation consumption step is quantified by ET/SW (ratio of precipitation consumption) and T/ET (ratio of crop transpiration to evapotranspiration),and the last process is quantified by Y/T (crop water use efficiency,WUET),where ET,T,and Y are evapotranspiration,crop transpiration and grain yield,respectively.These four ratios basically cover the major steps of the precipitation use process in farmland.However,further subdivisions in some of the ratios are still required to evaluate the precipitation use process in more detail.For example,during the precipitation storage step,if the soil is dry (i.e.,soil water storage is low),the precipitation can infiltrate into the soil faster before it evaporates or runoffs during the following step (Silva 2007).Therefore,the precipitation storage step can be further divided into two steps: precipitation infiltration into the soil (infiltration step),and storage of the infiltrated precipitation in the soil.Accordingly,SW/P can be divided into SWe/P (precipitation storage ratio) and SW/SWe(precipitation infiltration ratio),where SWe (mm) is the available soil water storage at the end of the specified period.As SWe decreases,the soil becomes drier,leading to an increase in SW/SWe.The last step can also be divided into two steps: 1) the use of the transpired precipitation to produce dry-matter;2) the reallocation of the produced dry matter to grains (Turner 2004;Siahpoosh and Dehghanian 2012);so Y/T can be divided into transpiration efficiency (B/T) and harvest index (Y/B).Based on these revisions,the PUE equation proposed by Liu (1997) can be further divided into six ratios as follows:

In farmland,all of these ratios can be affected by agronomic practices and cultivars,and different agronomic practices have various effects on each ratio,which ultimately determine the PUE (Turner 2004;Bhattaet al.2017;Unkovichet al.2018;Xueet al.2019).The quantification of the precipitation use process makes it possible to use optimized agronomic practices to improve PUE by regulating the steps with low efficiency in a specific agricultural system.Therefore,if we can clarify the characteristics of each step (i.e.,ratio) for a specific agricultural system,this information can guide the further optimization of agronomic practices for improving PUE.
The Loess Plateau in China is a representative dryland area,and 44% of its rainfed farmland is planted with winter wheat (Jinet al.2007).In this area,the average PUE and average grain yield of winter wheat are generally low (Zhanget al.2016,2018;Jinet al.2018;Xueet al.2019).Our previous research has shown that sustainable high yield and PUE can be achieved on the Loess Plateau through the integrated management of agronomic practices.In addition,our results also indicated that PUE could be increased by reducing the loss of precipitation during the early growth stage and increasing the use of subsoil water during the late growth stage (Yanget al.2021).However,that study did not: 1) consider the characteristics of each step in the precipitation use process during the growing season under different agronomic management systems;2) identify which steps have the potential to be further optimized for increasing PUE under agronomic management systems with low PUEs;or 3) determine which steps could be efficiently regulated by specific agronomic management practices.
As a follow-up study,the four integrated agronomic management systems in our previous investigation are used in this study.Those systems were constructed by integrating different agronomic practices,including seeding rates,N application strategies (dosage and timing),and manure or biochar applications.Here,we evaluated the effects of each integrated agronomic management system on the six ratios of PUE in the different growth stages throughout the year.The results will facilitate a better understanding of how to improve PUE by regulating the precipitation use process through agronomic management practices and how to further optimize the key agronomic practices in dryland agriculture.
2.Materials and methods
2.1.Experimental site
The field experiment was conducted at the Changwu Agro-ecological Experimental Station,south of the Loess Plateau,Shaanxi Province,China (107°44.70´E,35°12.79´N,and 1 200 m a.s.l.) from September 2015 to July 2018.In this region,the frost-free period is 171 days,and the mean annual temperature is 9.1°C.The mean annual precipitation was 529 mm,and the mean annual pan evaporation was 1 440 mm from 1994 to 2015,based on data collected from a meteorological station at Changwu.The groundwater level is 50 m below the soil surface,and no water is provided for irrigation.In the experimental field,the soil texture was silty loam with a pH of 7.9.The bulk density was 1.30 g cm–3,organic C content was 9.92 g kg–1,total nitrogen content was 1.06 g kg–1,NO3–-N content was 6.49 mg kg–1,NH4+-N content was 1.22 mg kg–1,available phosphate was 6.45 mg kg–1and available potassium was 127 mg kg–1at a 0–20 cm-soil depth before the experiment was performed.The annual precipitation levels in 2015–2016,2016–2017 and 2017–2018 were 413,602 and 505 mm,respectively,measured from July to June of the following year.The proportions of precipitation that fell during each of the three growing seasons relative to the total annual precipitation were 52,50 and 57%,respectively.The monthly total precipitation levels and average monthly air temperatures are shown in Fig.1.In this study,the drought index (DI) was used to assess the annual precipitation status among the different years (Guoet al.2012).According to the DI,2015–2016 was dry (DI<–0.35),2017–2018 was normal(–0.35<DI<0.35),and 2016–2017 was wet (DI>0.35).

Fig.1 Average monthly precipitation (A) and air temperature (B)in each year from 2015 through 2018.Capital letters represent the different growth stages: S,sowing;R,regreening;J,jointing;F,flowering;H,harvest.
2.2.Experimental design
Based on the current practices in the Loess Plateau,the seeding rate,N dosage and timing,and manure or biochar applications were integrated into different management systems that we compared to the conventional farmers’management system in order to maximize PUE and crop yield.Thus,we generated the following four management systems for assessment (Table 1): 1) Conventional farmers’ management system (CF): seeding rate and N application rate were low,and all N fertilizer was applied before sowing;2) relatively high input of N integrated system (HN): compared to CF,the total N application rate was 75% greater,the seeding rate was 25% greater,and 57% of the total N was applied at sowing,while the remaining N was top-dressed at the jointing stage;3)modified N application combined with manure integrated system (MIS): compared to CF,the total N application rate and seeding rate were 25% higher,and 60% of the total N and 10 000 kg ha–1manure were applied at sowing,while the remaining N fertilizer was top-dressed at the jointing stage;compared to HN,the seeding rate remained unchanged,but the total N application rate was 29% lower;and 4) modified N application combined with biochar integrated system (BIS): compared to CF,the total N application rate was 50% higher and the seeding rate was 25% higher,and 66% of the total N and 5 000 kg ha–1biochar were applied at sowing,while the remaining N fertilizer was top-dressed at the jointing stage;compared to HN,the seeding rate remained unchanged,but the total N application rate was 14% lower.
Each treatment included three plots (replicates).The distribution of plots was designed according to a randomized complete block pattern.The area of each plot was 40 m2(4 m×10 m) with 18 rows,and row spacing was 20 cm.The commonly planted winter wheat cultivar(Triticum aestivumL.) ‘Changhan 58’ was sown in late September in each of the three experimental years and harvested in late June of the subsequent year.Phosphatic fertilizer,manure and biochar were applied before plowing as a basal fertilizer.In CF,all N fertilizer was applied before plowing;while in the HN,MIS and BIS treatments,some N fertilizer was applied before plowing,and the remainder was applied at the jointing stage(Table 1).The manure consisted of sheep dung with a pH of 7.8,N content of 0.5%,P2O5content of 0.4%,organic matter content of 228 g kg–1,total nitrogen content of 21.6 g kg–1,total phosphorus content of 19.8 g kg–1,NO3–-N content of 2.31 mg kg–1,and NH4+-N content of 1.23 mg kg–1.The biochar was obtained from wheat straw and leaf residue,and had a pH of 9.9,C content of 53%,N content of 0.3%,P2O5content of 0.1%,total nitrogen content of 5.78 g kg–1,total phosphorus content of 0.9 g kg–1,NO3–-N content of 1.58 mg kg–1,and NH4+-N content of 1.09 mg kg–1.

Table 1 Seeding rates and fertilizer applications for the four experimental management systems
2.3.Measurements
Soil water content,available soil water storage,and evapotranspirationSoil water content (WC) was measured using the oven-drying method (Gardner 1986).At the sowing,regreening,jointing,flowering,and harvest stages,soil cores were collected using a soil auger from two spots in each plot for WC determination,with cores taken at 10 cm intervals for the 0 to 100 cm soil layer and at 20 cm intervals for the 100 to 300 cm soil layer.The sampling position of each soil core was centrally located between two neighboring rows.Soil water storage (SWS)was calculated as follows (Burgesset al.2014):

where BD is the soil bulk density (g cm–3),which was determined to be 1.3 g cm–3using the method reported by Burgesset al.(2014),and D is the soil depth (mm).
Available soil water storage (ASWS) was calculated according to the following equations:

where AWC is the available soil water content (w/w,%),andθpwpis the permanent wilting point.In this study,θpwpwas determined to be 7.3% according to the method reported by Bauer and Black (1992).
In this study,the soil water balance method was used to calculate ET according to the following equation (Hatiet al.2006):

where △SWS is the change in SWS in the 0–300 cm soil layer during a specified period;R is surface runoff (mm),which was omitted in this study because the ridges in our plots were high and the soil surface was flat;and D is deep leakage (mm),which rarely occurs in this region because large amounts of precipitation can be stored in the 0–300 cm soil layer (Huet al.2018).Thus,the above equation can be simplified to:

Based on the data of P,△SWS,and ET,the ratios of SWe/P,SW/SWe,and ET/SW were calculated at the different growth stages.
Leaf area index,the ratio of crop transpiration to evapotranspiration (T/ET),crop transpiration and soil evaporationThe leaf area index (LAI) was measured in the 2016–2017 and 2017–2018 growing seasons.At the regreening stage,fresh leaves collected from 400 stems(randomly sampled) were scanned using an EPSON scanner with EPSON TWAIN Pro Software (Epson,Suwa,Japan) to determine the leaf area,and LAI was calculated as the leaf area per plot divided by the land area per plot(Kanget al.2005).At the jointing and flowering stages,LAI was measured using a LAI-2200 canopy analyzer (LICOR,Lincoln,NE,USA) from 12 locations in each plot.T/ET was estimated according to an empirical model which is suitable for calculating the T/ET of winter wheat in this area (Kanget al.1995):

where t is the time of day (h) starting from 6:00 a.m.and ending at 20:00 p.m.Local standard time (LST) and K and A are empirical coefficients for winter wheat in this region,with K=0.3973 and A=0.10464.The T/ET was not estimated during the 2015–2016 growing season because we did not measure LAI in 2015–2016.
Crop transpiration (T) and soil evaporation (E) were calculated using the estimated T/ET and the measured ET as follows:

Shoot biomass and grain yieldThe tiller number,i.e.,the number of shoots of wheat,changed dynamically during the different growth stages.Thus,during the regreening,jointing,and flowering stages of each year,shoots were collected from two rows (1 m length per row) in each plot and oven-dried at 80°C for 48 h to determine shoot biomass.At harvest time in each year,plants from a 10-m2in each plot were collected to measure the grain yield (Y) and shoot biomass (B).Grain yield and shoot biomass were measured after airdrying.Based on these measured data,the ratio of B/T was calculated in the different growth stages during two experimental years (2016–2017 and 2017–2018),and Y/B values were calculated over the three experimental years.
2.4.Statistical analyses
All data were analyzed using SPSS 20.0 Software (IBM Company,Chicago,IL,USA).To determine the significant differences among the different treatments,Duncan’s test (P<0.05) was used to compare the means of the four treatments.A mixed ANOVA model was used to test the significance of treatments,years,and the interaction of treatment×year.Thet-test was used to compare differences in LAI or B/T among the different years or growth stages.
3.Results
3.1.LAl and shoot biomass
The LAI differed among the four treatments (Fig.2).The LAI values under HN were 21–28%,20–27%,and 6–17%greater than those under CF at the regreening,jointing,and flowering stages,respectively,during the two growing seasons,while the LAI values under MIS were 52–58%,48–51%,and 33–34% greater,and under BIS the values were 39–54%,30–45%,and 27–29% greater at the three growth stages,respectively.In addition,the LAIs under all four treatments were higher during the wet year (2016–2017) than during the normal year (2017–2018) for each of the growth stages.
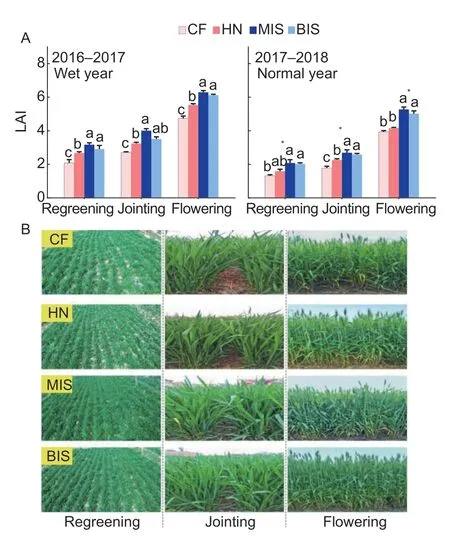
Fig.2 Effects of different treatments on leaf area index (LAI)in 2016–2017 and 2017–2018 (A) and growth status of winter wheat in 2016–2017 (B) at different growth stages. CF,conventional farmers’ management system;HN,relatively high input of N integrated system;MIS,manure integrated system;BIS,biochar integrated system.Bars mean SE (n=6).Lowercase letters indicate significant differences among the four treatments within the same growth stage (P<0.05).*,indicates significant differences in LAI between the same growth stages during the two years (P<0.05).
From the sowing through the flowering stages,the increments of shoot biomass under MIS and BIS were consistently higher than those under CF in each year(Fig.3).Compared with CF,the biomass values under MIS were 57,28 and 26% greater,and under BIS the values were–41,20 and 24% greater from sowing to regreening,from regreening to jointing and from jointing to flowering,respectively,in 2016–2017.The corresponding values were 40,10 and 45% greater under MIS,and 36,7,and 34% greater under BIS in the same three intervals,respectively,in 2017–2018.However,the increment of shoot biomass under HN was not significantly greater than that under CF.

Fig.3 Effects of each treatment on shoot biomass increments during the different growth stages in 2015–2016,2016–2017 and 2017–2018.CF,conventional farmers’ management system;HN,relatively high input of N integrated system;MIS,manure integrated system;BIS,biochar integrated system.S,sowing;R,regreening;J,jointing;FW,flowering;H,harvest.Bars mean SE (n=6).Lowercase letters indicate significant differences among the four treatments within the same growth stage (P<0.05).
3.2.Soil water content,precipitation,SWe and SW
The dynamic changes in soil water content in the 0–300 cm soil layer at the different growth stages are shown in Fig.4.During the 2015–2016 growing season,the soil water contents showed small differences among the four treatments at sowing and the regreening stages;however,at harvest time,the soil water contents under MIS and BIS were significantly lower than those under CF and HN below the 100 cm soil layer (Fig.4-A).During the 2016–2017 growing season,the soil water contents under MIS and BIS were consistently lower at sowing time in the 100–300 cm soil layer compared with CF and HN;at regreening,the soil water contents exhibited only a small difference among the four treatments;and at harvest time,they were lower under MIS and BIS than under CF and HN in the 100–300 cm soil layer (Fig.4-B).Similar trends in soil water content dynamics were observed in the 2017–2018 growing season,during which the soil water contents were lower under MIS and BIS in the 100–300 cm soil layer than under CF and HN at sowing and harvest time,but they were only slightly lower in the 100–300 cm soil layer at the regreening stage (Fig.4-C).
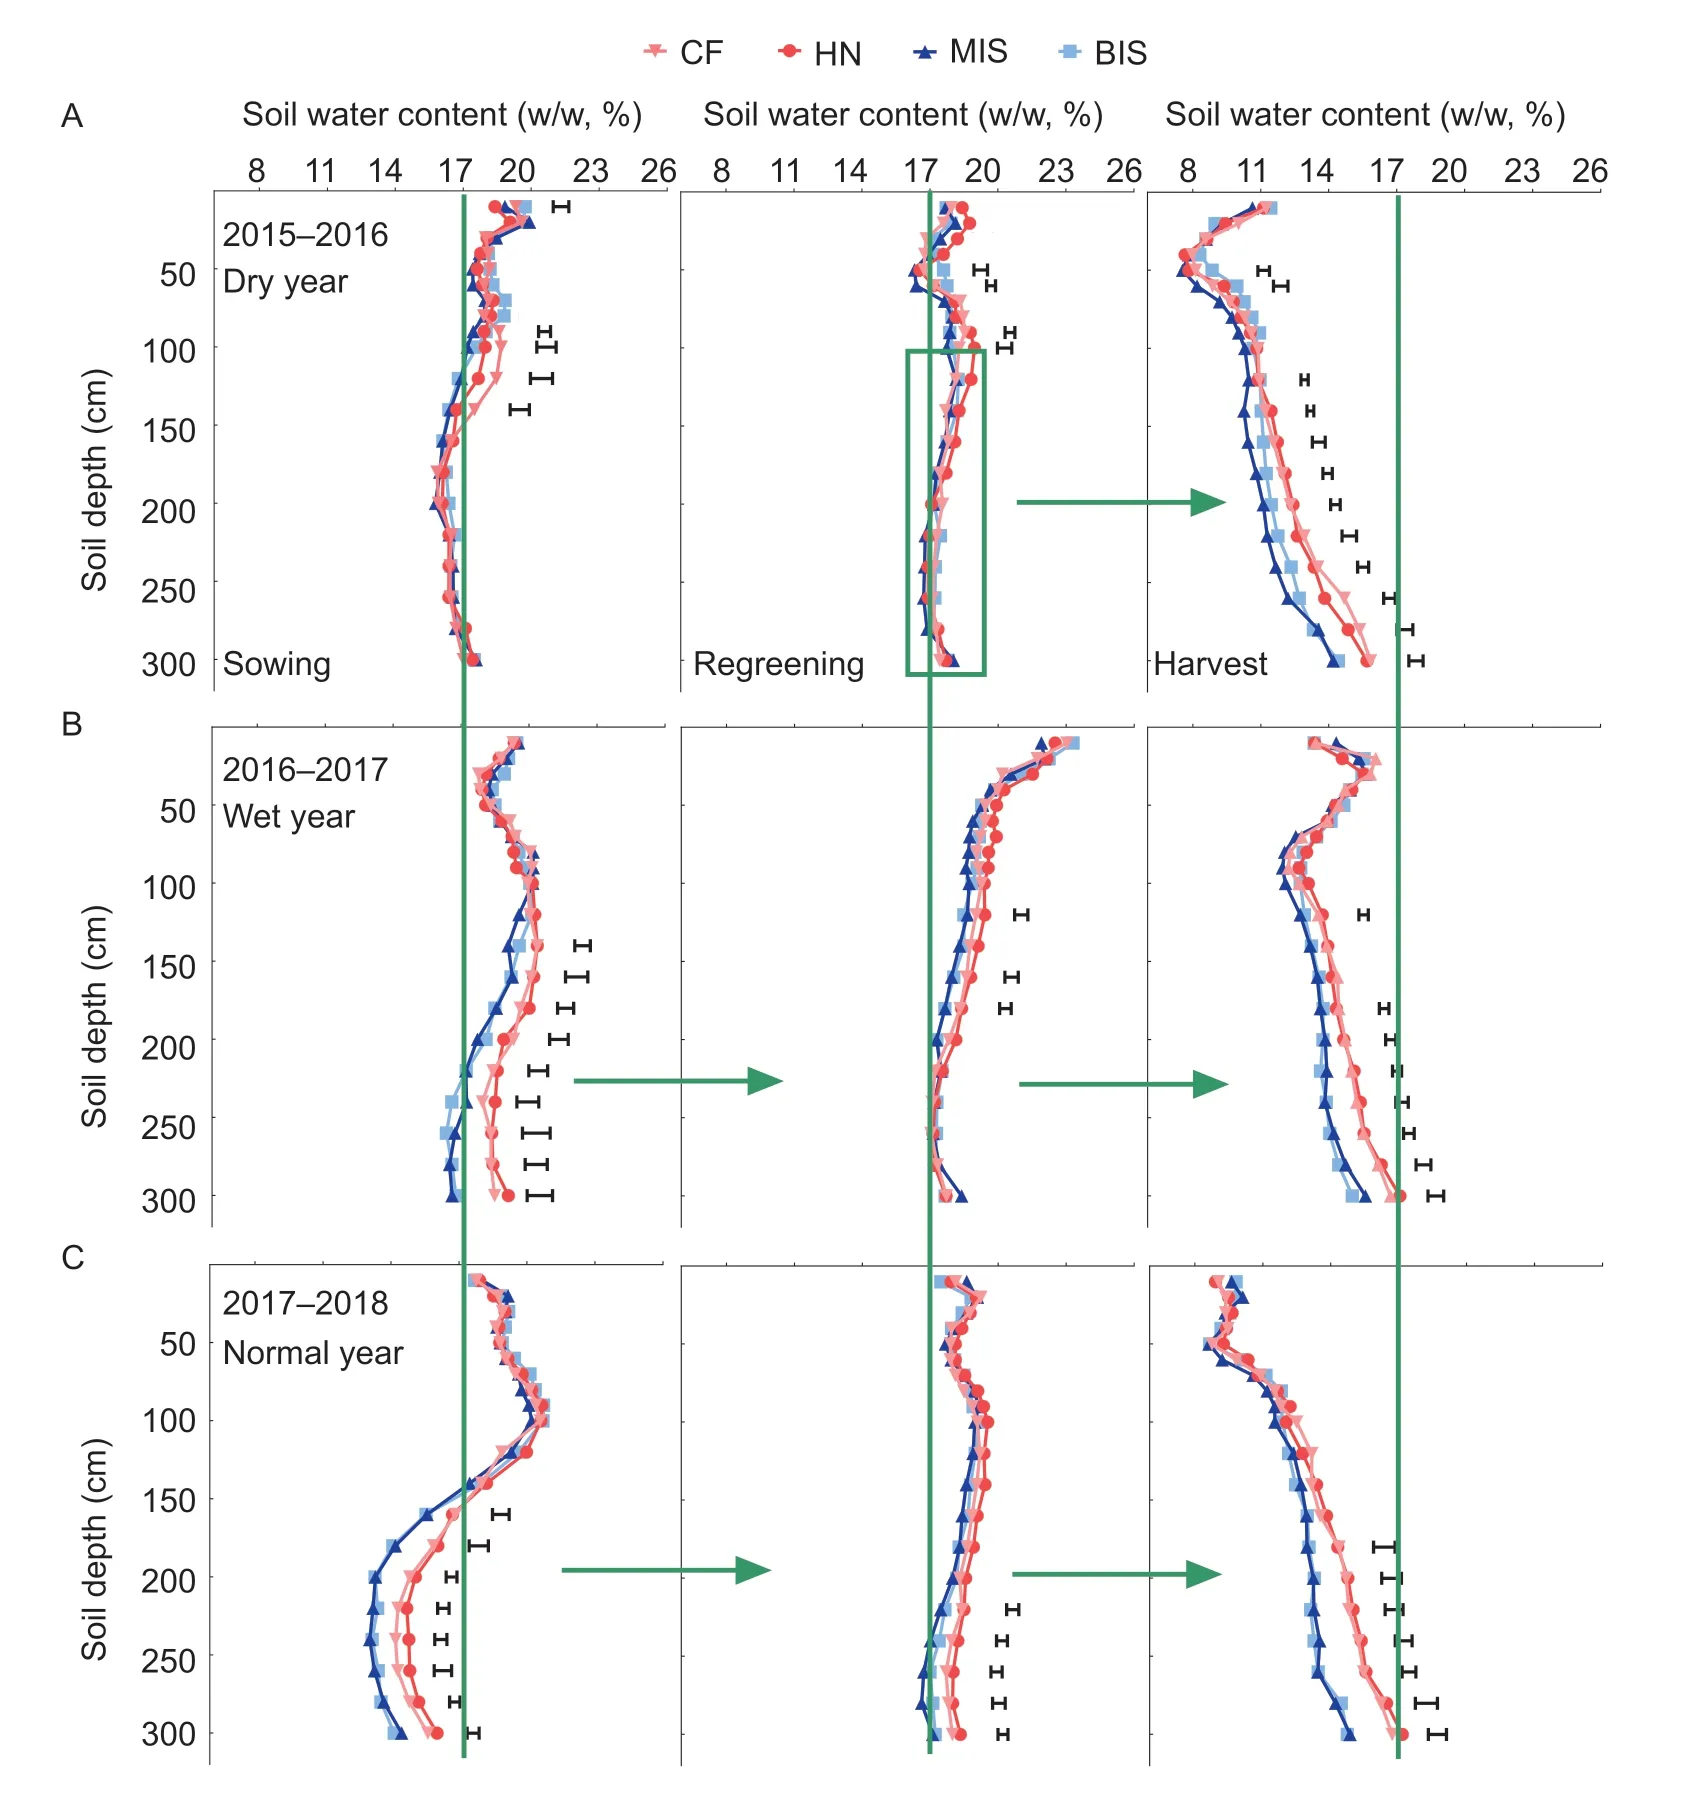
Fig.4 Effects of the different treatments on soil water contents in the 0–300 cm soil layer at the different growth stages in 2015–2016,2016–2017 and 2017–2018.CF,conventional farmers’ management system;HN,relatively high input of N integrated system;MIS,manure integrated system;BIS,biochar integrated system.Green vertical lines indicate differences in water content at different soil layers over the study period.Rectangles and arrows indicate differences in soil water content among the four treatments at different growth stages in the 100–300 cm soil layer.Small horizontal bars indicate significant differences in soil water contents among all the treatments in the same soil layer (P<0.05).
In the three years,the precipitation varied greatly during the different growth stages,and the precipitation during the fallow period occupied a large proportion of annual precipitation (Fig.5-A).Both SWe and SW were profoundly affected by the different treatments during the different growth stages (Fig.5-B and C).In 2015–2016,compared with CF,SWe was greatly reduced by 17%(43 mm) under MIS from jointing to flowering and by 24%(43 mm) from flowering to harvest;and SWe was 12%(22 mm) lower than under BIS from flowering to harvest.In the following two years,MIS and BIS consistently had lower SWe values than CF and HN throughout the years(except during regreening to jointing in 2017–2018).There were no differences in SWe between CF and HN in the three years.The SW in 2015–2016 was only greatly reduced under MIS when compared with CF from flowering to harvest.In 2016–2017,compared with the SW of CF,the SW of MIS was 9% (43 mm) lower from the fallow period to sowing,6% (31 mm) lower from sowing to regreening,and 7% (31 mm) lower from flowering to harvest;and the corresponding values were 5% (22 mm),6% (30 mm) and 8% (36 mm) lower under BIS in the same three intervals,respectively.In 2017–2018,the SW was significantly reduced under MIS and BIS compared with CF and HN from sowing to harvest,except during jointing to flowering.
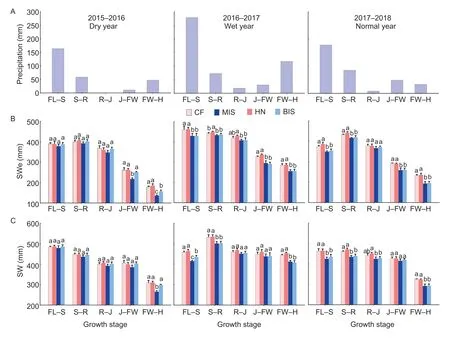
Fig.5 Precipitation and the effects of different treatments on available soil water storage at the end of a specific period (SWe) and total available water (SW) during the different growth stages in 2015–2016,2016–2017 and 2017–2018.CF,conventional farmers’management system;HN,relatively high input of N integrated system;MIS,manure integrated system;BIS,biochar integrated system.FL,fallow period;S,sowing;R,regreening;J,jointing;FW,flowering;H,harvest.Bars mean SE (n=6).Lowercase letters indicate significant differences among the treatments within the same growth stage (P<0.05).
3.3.Crop transpiration,soil evaporation and evapotranspiration
We further calculated the crop transpiration (T) and soil evaporation (E) at the different growth stages during 2016–2017 and 2017–2018 (Fig.6).T was affected by the different treatments after the jointing stage.Compared with CF,T under HN was 15% (15 mm)greater from the flowering stage through harvest time during 2016–2017,while under MIS and BIS,the values were 30–36% (29–34 mm) and 28–39% (27–33 mm)greater from the jointing through flowering stages,respectively,and 15–25% (13–15 mm) and 9–18% (9–10 mm)greater from the flowering stage through harvest time,respectively,in both years.The values of total T over the whole year were 10–11% (18–28 mm),22–30% (55–57 mm)and 17–26% (44–49 mm) higher under HN,MIS and BIS,respectively,than under CF.E was affected by the different treatments during each growth stage (except flowering through harvest in 2017–2018) (Fig.6).Compared with CF,the respective values of E under MIS and BIS were 30–41% (13–25 mm) and 25–40% (11–24 mm)lower from sowing through the regreening stage,35–37% (6–11 mm) and 21–33% (3–11 mm) lower from regreening through the jointing stage,27–36% (10–11 mm)and 17–27% (6–7 mm) lower from jointing through the flowering stage,and 22–28% (9–17 mm) and 14–29%(6–17 mm) lower from the flowering stage through harvest time during the two growing seasons.Under HN,however,E only showed a significant difference from the jointing stage through harvest time in 2016–2017 when compared with CF.The total E values over the whole year were 28–35% (45–57 mm) lower under MIS and 22–32% (34–51 mm) lower under BIS than under CF in the different growing seasons.
On the table were the most delicious cherries, and the old woman let Gerda eat as many as she liked, while she combed her hair with a gold comb as she ate
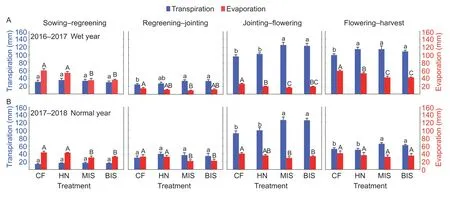
Fig.6 Effects of each treatment on crop transpiration (blue columns) and soil evaporation (red columns) during the different growth stages in 2016–2017 (A) and 2017–2018 (B).CF,conventional farmers’ management system;HN,relatively high input of N integrated system;MIS,manure integrated system;BIS,biochar integrated system.Bars mean SE (n=6).Lowercase letters indicate significant differences in crop transpiration among the treatments within the same growth stage (P<0.05);capital letters indicate significant differences in soil evaporation among the treatments within the same growth stage (P<0.05).
The values of ET varied greatly at the different growth stages and differed among the four treatments (Fig.7).Compared with CF,ET was higher by 15% (22 mm) under MIS from jointing to flowering in 2015–2016.In 2016–2017,the ET values under MIS and BIS were 24% (22 mm)and 28% (25 mm) lower,respectively,from sowing through regreening.In contrast,from jointing through flowering,ET under MIS was 16% (20 mm) higher and under BIS it was 21% (26 mm) higher than under CF.In 2017–2018,compared with CF,the ET values under MIS and BIS were lower from sowing through regreening but higher from jointing through flowering.The ET values were not significantly different under CF and HN during the different growth stages throughout the three growing seasons.

Fig.7 Effects of different treatments on evapotranspiration (ET) during the different growth stages in 2015–2016,2016–2017 and 2017–2018.CF,conventional farmers’ management system;HN,relatively high input of N integrated system;MIS,manure integrated system;BIS,biochar integrated system.FL,fallow period;S,sowing;R,regreening;J,jointing;FW,flowering;H,harvest.Bars mean SE (n=6).Lowercase letters indicate significant differences among the treatments within the same growth stage (P<0.05).
3.4.The ratios of SWe/P,SW/SWe and ET/SW at different growth stages
The SWe/P,SW/SWe,and ET/SW ratios over the study period are presented in Fig.8.The SWe/P was different for each treatment in the late growth stages,excluding those in 2016–2017 (Fig.8-A).Compared with CF,the SWe/P was not significantly different under HN,although it was significantly lower under MIS and BIS.From jointing through flowering,the SWe/P values under MIS and BIS were 17 and 4% lower,respectively,in 2015–2016 (dry year),10 and 11% lower,respectively,in 2016–2017 (wet year),and 12 and 11% lower,respectively,in 2017–2018(normal year) than the corresponding values under CF.From flowering through harvest time,the SWe/P values of MIS and BIS were still lower in 2015–2016 and 2017–2018,respectively,than the SWe/P of CF.In contrast,the SW/SWe values were significantly higher under MIS and BIS than under CF in the late growth stages (Fig.8-B),reaching 9–13% higher under MIS and 3–11% higher under BIS from jointing through flowering during the three years.Moreover,from the flowering through harvest stages,the SW/SWe values were much higher under MIS and BIS than under CF in 2015–2016 (dry year).The ET/SW was not significantly different between CF and HN,but it was greatly affected by MIS and BIS in the late growth stages (Fig.8-C).During 2015–2016,the ET/SW values under MIS and BIS from jointing through flowering were 21 and 5% higher,respectively,and the values from the flowering through harvest were 17 and 14% higher,respectively,than those under CF.During 2016–2017,compared with CF,the ET/SW values under MIS and BIS were 20 and 24% higher,respectively,from jointing through flowering;however,from sowing time through regreening,they were 20 and 23% lower,respectively.During 2017–2018,the ET/SW values were consistently higher under MIS and BIS than under either CF or HN in the late growth stages.
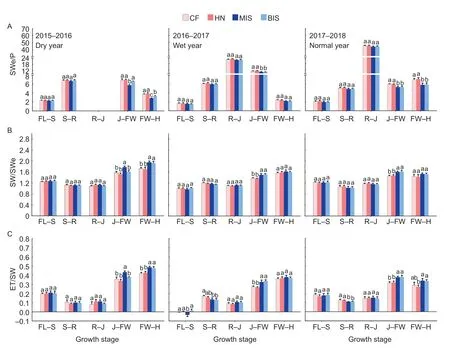
Fig.8 Effects of the different treatments on SWe/P (A),SW/Swe (B) and ET/SW (C) during the different growth stages in 2015–2016,2016–2017 and 2017–2018.SWe/P,precipitation storage ratio;SW/SWe,precipitation infiltration ratio;ET/SW,precipitation consumption ratio.CF,conventional farmers’ management system;HN,relatively high input of N integrated system;MIS,manure integrated system;BIS,biochar integrated system.FL,fallow period;S,sowing;R,regreening;J,jointing;FW,flowering;H,harvest.The SWe/P value did not exist from the regreening to jointing stage of 2015–2016 because there was no effective precipitation during that period.Bars mean SE (n=6).Lowercase letters indicate significant differences among the treatments within the same growth stage (P<0.05).
3.5.The ratios of T/ET and B/T at different growth stages
The T/ET and B/T ratios of two experimental years(2016–2017 and 2017–2018) are presented in Fig.9.The average T/ET values from the sowing to regreening stages under CF,HN,MIS and BIS were 0.29,0.35,0.42,and 0.39,respectively.From the regreening to jointing stages,they were 0.55,0.63,0.71,and 0.67,respectively.From the jointing to flowering stages,they were 0.74,0.79,0.85,and 0.83,respectively.From the flowering to harvest stages,they were 0.59,0.63,0.70,and 0.68,respectively (Fig.9-A).The B/T value was less affected by the different treatments,but it was higher before jointing than after jointing (Fig.9-B).
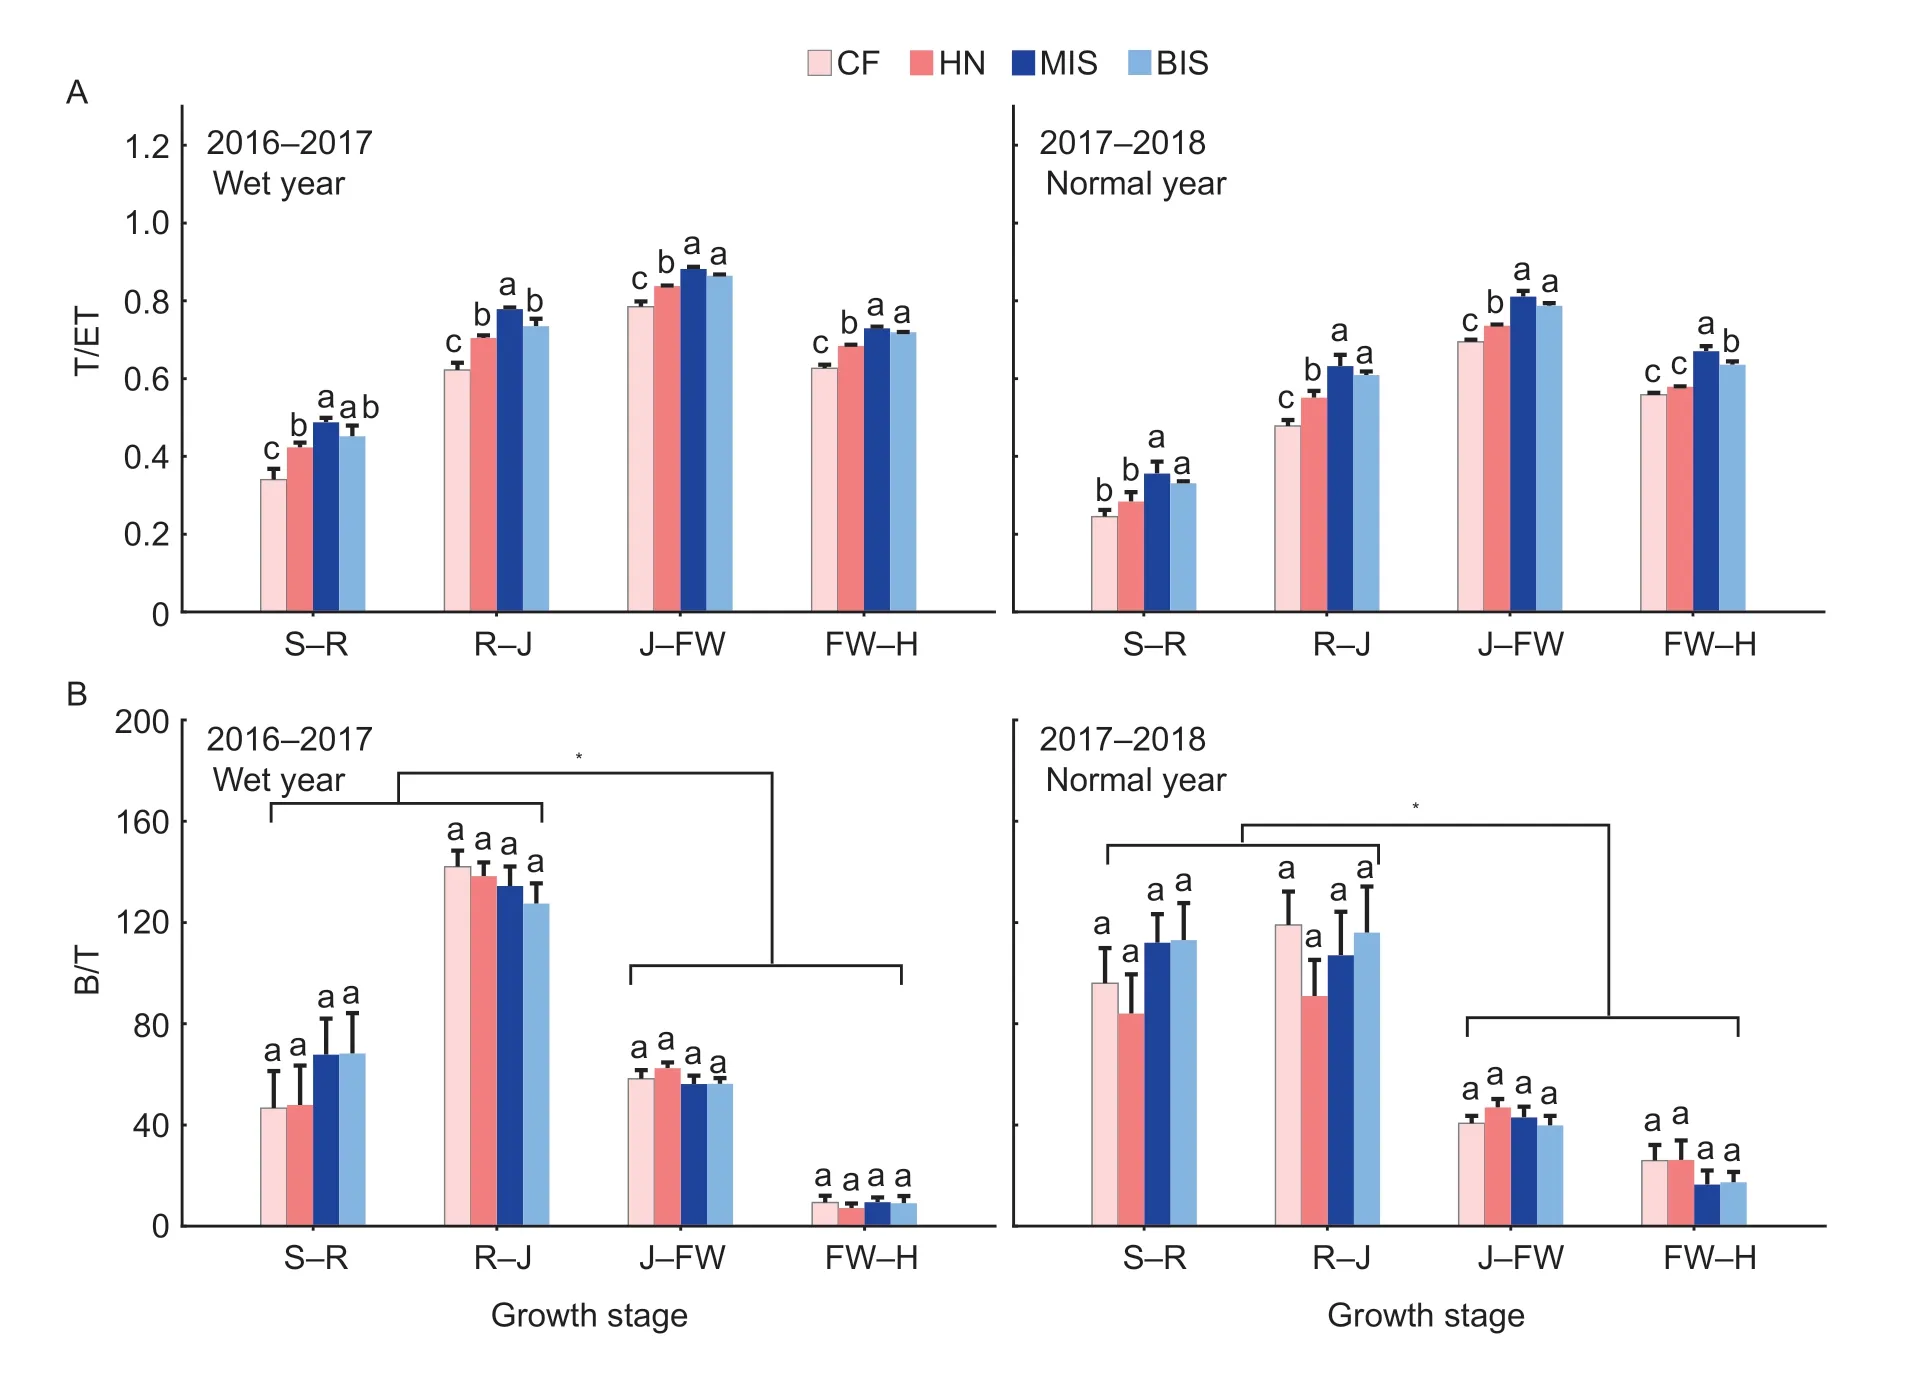
Fig.9 Effects of the different treatments on T/ET (A) and B/T (B) during the different growth stages in 2016–2017 and 2017–2018.T/ET,ratio of crop transpiration to evapotranspiration;B/T,transpiration efficiency.CF,conventional farmers’ management system;HN,relatively high input of N integrated system;MIS,manure integrated system;BIS,biochar integrated system.S,sowing;R,regreening;J,jointing;FW,flowering;H,harvest.Bars mean SE (n=6).Lowercase letters indicate significant differences among the the four treatments within the same growth stage (P<0.05).*,indicate significant differences in B/T before and after the jointing stage (P<0.05).
3.6.Yield,PUE,SWe/P,SW/SWe,ET/SW,T/ET,B/T and Y/B in different years
The results of our three-year field experiment showed that the yields were significantly 22–31% higher under MIS and 15–26% higher under BIS,but only 7–13% higher under HN as compared with CF (Table 2).The highest yield was found in 2015–2016 under MIS,with a value of 7 234 kg ha–1.The PUE values under MIS and BIS were also higher than under CF or the HN treatment.In the dry year of 2015–2016,PUE values under all four treatments were higher than those in any other experimental year,and the greatest PUE was found under MIS in 2015–2016,with a value of 23.53 kg ha–1mm–1.
In the precipitation infiltration and storage steps,the SWe/P values under MIS and BIS were 24 and 12%lower,respectively,in 2015–2016 (dry year);and 16 and 15% lower,respectively,in 2017–2018 (normal year) than under CF (Table 2).In contrast,compared to under CF,the SW/SWe under MIS was 31% higher and under BIS it was 15% higher in 2015–2016 (dry year),and both were 12% higher in 2017–2018 (normal year).The SWe/P and SW/SWe values under HN were not significantly different from those under CF.As for the precipitation consumption step,the ET/SW values were no greater under MIS or BIS than under CF or HN throughout our three-year experimental period.The average T/ET values under HN,MIS and BIS were 0.60,0.69 and 0.65 respectively,which were 11,28 and 19%greater than under CF (0.54).Moreover,B/T and Y/B varied considerably among the different experimental years,but neither of them was significantly affected by the different treatments.
3.7.The contributions of the six ratios to PUE and grain yield
In order to further clarify the differences in importance of the six different ratios on PUE and grain yield,we calculated standard regression coefficients and contribution ratios for each of the six ratios to PUE and grain yield (Table 3).The results show that for PUE improvement,the importance of the six ratios followed the rank order: SW/SWe>SWe/P>T/ET>Y/B>B/T>ET/SW;with SW/SWe,SWe/P,T/ET,and Y/B accounting for 91.04% of the PUE variation.For grain yield improvement,the rank order followed Y/B>T/ET>B/T>SWe/P>SW/SWe>ET/SW;and Y/B,T/ET,B/T and SWe/P accounted for 88.55% of the grain yield variation.
4.Discussion
4.1.Higher PUE and higher yield achieved by regulating the precipitation use process in farmland through integrated management practices
In our three-year study,the yields under MIS and BIS were consistently far higher than those under CF or HN.Meanwhile,the PUE values under MIS and BIS were also much higher than those under CF or HN (Table 2).Agronomic practices significantly affected the SWe/P,SW/SWe,and T/ET ratios but had little effect on ET/SW,B/T,or Y/B throughout the year.MIS and BIS had lower SWe/P but higher SW/SWe and T/ET among the four systems.These results indicated that the precipitation infiltration,storage,and consumption steps still have a great deal of potential for further optimization in the Loess Plateau,and different agronomic practices can specifically regulate these steps.

Table 2 Effects of different treatments on SWe/P,SW/SWe,ET/SW,T/ET,B/T,Y/B,PUE,and grain yield in each year (fallow period+growing season)1)

Table 3 The standard regression coefficients and contribution ratios of the six ratios to precipitation use efficiency (PUE) and grain yield
4.2.Effect of integrated management practices on the precipitation infiltration and storage steps
Before precipitation can be stored in the soil,it must contact the soil surface and undergo an infiltration step,which is affected by the soil physical properties,such as bulk density,mechanical resistance,and porosity (Silva 2007;Bormann and Klaassen 2008).Manure or biochar application can decrease soil bulk density and soil mechanical resistance,leading to an increased precipitation infiltration rate (Silva 2007;Mosaddeghiet al.2009;Al-Wabelet al.2017).In addition,the precipitation infiltration rate can also be affected by soil dryness.Infiltration occurs faster as the soil becomes drier,as drier soil has a greater capacity to absorb precipitation (Silva 2007).In wheat production,large amounts of soil water can be consumed in highyielding farmland,especially in the late growth stages(Wanget al.2018).In this study,the highest yields were observed under MIS and BIS,which are associated with lower soil water contents,SWe/P and higher SW/SWe during the late growth stages compared to CF and HN(Figs.4,7-A and B).The increased SW/SWe under MIS and BIS suggest that more precipitation can infiltrate into the soil and become stored by the soil in the following period.Thus,the differences in soil water contents and SWe/P values between MIS or BIS and the other two treatments diminished at sowing time and disappeared at the regreening stage (Figs.4 and 7-A).These results suggest that the potential improvements can be achieved in the precipitation infiltration and storage steps by their interaction with each other,which can be greatly regulated by agronomic management practices.Thus,PUEs were affected by the varying amounts of precipitation retained by soil under different agronomic management systems.
4.3.Effects of integrated management practices on the precipitation consumption step
During the consumption step,the average ET/SW throughout each study year showed no difference among the four treatments,but the ET/SW values in specific growth stages varied for each treatment (Table 2;
The T/ET ratio was consistently higher under MIS and BIS than under CF and HN throughout the growing seasons in 2016–2017 and 2017–2018 (Fig.9).During the early growth stage of winter wheat,large areas of land were bare due to the low LAI.Therefore,E accounts for the majority of ET before regreening (Chenet al.2010).It is known that E is positively associated with soil water content (Yanet al.2015).If the soil water content is high during the early growth stage,E is more intensive (Zhanget al.2018).Thus,T/ET values were higher under MIS and BIS than under CF and HN during the early growth stage due to the decrease in E,which could be ascribed to their lower soil water contents compared with CF and HN (Figs.4,5,and 8-A).After regreening,the canopy dramatically grows owing to the increased seedling growth and expanding leaves;as a result,E gradually decreases while T continuously increases (Eberbach and Pala 2005;Chenet al.2010).Therefore,the higher T/ET values during the late growth stages under MIS and BIS,as compared to CF and HN,were mainly due to the increased T and decreased E caused by the high LAI(Figs.2,5 and 8-A).These results indicated that the potential improvements in the precipitation consumption step could also be achieved by agronomic management practices,which can be ascribed to the allocation of more precipitation resources available for crop use.
In this study,we obtained data of estimated T/ET and measured ET,thus,we calculated T and E separately by their product (Fig.6).The results showed interesting variations in T and E under the different treatments during different growth stages,which could provide guidance for the most efficient utilization of limited precipitation resources in dryland farmlands.However,the data of T and E obtained in this study may not be precise because some uncertainties may have arisen from our approach.For example,T is extremely difficult to measure directly on farmland,thus,improved technologies related to T measurement should be investigated in order to better understand the crop water use patterns on farmland.
4.4.Effect of integrated management practices on transpiration efficiency and harvest index
The transpiration efficiency (B/T) and harvest index (Y/B)can be affected by different species and cultivars (Turner 2004;Unkovichet al.2018).For a specific cultivar,B/T is mainly affected by vapor pressure deficits,while Y/B is significantly affected by ET after flowering in wheat(Passioura 1977;Unkovichet al.2018).In addition,B/T and Y/B could also be significantly affected by agronomic practices (Víctoret al.2005;Linet al.2019;Penget al.2020).For instance,high N application increases the consumption of soil water and allocates more soluble carbohydrates to structural tissues before anthesis,which leads to a shortage of water for transpiration and a scarcity of soluble carbohydrates for reallocation to grain;thus,B/T and Y/B decrease under high N application(Angus and Herwaarden 2001;Turner 2004).Our results showed that both B/T and Y/B varied greatly across the different experimental years,but they were equivalent among the different management systems (Table 2;Fig.9-B).Therefore,the increases in PUE and yield in this study were not related to B/T and Y/B.
5.Conclusion
In this study,both PUE and winter wheat yield were significantly higher under MIS and BIS than under CF and HN,which can be ascribed to the regulatory effects of MIS and BIS on the steps in the precipitation use process in farmland (Fig.10).Our approach split the four ratios in the PUE equation into six ratios,and the results showed that agronomic practices profoundly affected SWe/P,SW/SWe,ET/SW,and T/ET,although their impacts on B/T and Y/B were limited.Therefore,attempts to increase PUE and yield through agronomic management practices should focus on regulating the precipitation infiltration,storage and consumption steps.Specifically,the ET/SW can be greatly affected by the plant population,which is mainly regulated by the seeding rate.The T/ET can be profoundly determined by LAI,which is mainly controlled by plant population,N fertilizer,and manure or biochar application.The precipitation infiltration and storage steps are closely related to the dynamics of soil water status,which are influenced by the precipitation consumption step.Therefore,SWe/P and SW/SWe can be regulated by ET/SW.Our study shows that,in this region,the most effective way to increase PUE and yield through integral management of agronomic practices is to increase T/ET and SW/SWe while maintaining ET/SW throughout the year and keeping SWe/P relatively low at harvest time.The quantified precipitation use process makes it possible to use optimized agronomic practices to improve PUE by regulating the steps that have low efficiency in a specific agricultural system.In this study,the precipitation use efficiency (PUE) was divided into several individual sequential steps.This approach can not only be applied to the planning and execution of improvements in PUE in rainfed agriculture,but it can also be used to assess the efficiency of agricultural water use in other agriculture systems,such as irrigation agriculture.Therefore,more corresponding studies are still needed in other agricultural systems to further improve the use efficiency of the finite fresh water resources on the Earth in the future.
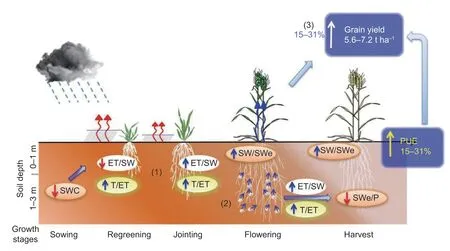
Fig.10 Effects of the manure integrated system (MIS) and biochar integrated system (BIS) treatments on the steps of precipitation use process that result in improved precipitation use efficiency (PUE) and yield.(1) Before the jointing stage,ET/SW (precipitation consumption ratio) is relatively low and T/ET (ratio of crop transpiration to evapotranspiration) is high due to the low soil water content at sowing.(2) After the jointing stage,more subsoil water (1–3 m) is absorbed by the large plant population,resulting in high ET/SW and T/ET and low SWe/P (precipitation storage ratio).SW/SWe (precipitation infiltration ratio) increases as the soil becomes drier.(3) PUE and grain yield are significantly increased.SWC,soil water content.
Acknowledgements
The authors would like to acknowledge the support of the National Key Research and Development Program of China (2021YFD1900705),the National Basic Research Program of China (2015CB150402),and the National Key Technology R&D Program of China (2015BAD22B01).
Declaration of competing interest
The authors declare that they have no conflict of interest.
杂志排行
Journal of Integrative Agriculture的其它文章
- Less hairy leaf 1,an RNaseH-like protein,regulates trichome formation in rice through auxin
- Characterization of a blaCTX-M-3,blaKPC-2 and blaTEM-1B co-producing lncN plasmid in Escherichia coli of chicken origin
- Consumers’ experiences and preferences for plant-based meat food: Evidence from a choice experiment in four cities of China
- Farmers’ precision pesticide technology adoption and its influencing factors: Evidence from apple production areas in China
- Visual learning graph convolution for multi-grained orange quality grading
- lnfluence of two-stage harvesting on the properties of cold-pressed rapeseed (Brassica napus L.) oils
