Influence of freeze tube deviation on the development of frozen wall during long cross-passage construction
2023-01-02JunHaoChenJianLinWangLeXiaoWangHanLiMeiLinChen
JunHao Chen,JianLin Wang,LeXiao Wang,Han Li,MeiLin Chen
1.School of Civil Engineering,Fujian University of Technology,Fuzhou,Fujian 350118,China
2.Key Laboratory of Underground Engineering,Fujian Province University,Fuzhou,Fujian 350118,China
ABSTRACT This paper investigates the influence of the deviation in freeze pipe installation on the development of the frozen wall in long cross passages by numerical simulation with ANSYS software.The study case is from the artificial ground freezing project along the Fuzhou Metro Line 2 between Ziyang Station and Wuliting Station.Two freeze-pipe configurations,i.e.,one with perfectly aligned pipes without any deviation from design and another with randomly distributed deviation,are included for comparison.The effect of the random deviation in the freeze pipes on frozen wall interconnection time,the thickness of the frozen wall and the development of the temperature field is explored.For the characteristic section of the numerical model at a depth of 25 m,it is found that the frozen wall interconnection time under the random deviation case and no deviation case is 24 days and 18 days,respectively.The difference in the thickness of the thinnest frozen wall segment between the random deviation and no deviation cases is the largest in the early freezing stage(up to 0.75 m),which decreases with time to 0.31 m in the late freezing stage.The effects of random deviation are more significant in the early freezing stage and diminish as the freezing time increases.
Keywords:long cross passages;artificial ground freezing;random deflection;numerical simulation
1 Introduction
With the rapid development of China's economy and accelerated urbanization,more and more cities in China are beginning to construct subways to solve traffic congestion and respond to the call for energysaving and emission reduction.Cross passages are the life channels connecting the lines of different directions in subways.Artificial ground freezing(AGF)is the most commonly adopted method for constructing such passages in shallow soil strata.In this method,the soil around the cross passages is first frozen and reinforced,and then the cross passages are excavated.AGF has the advantages of excellent water sealing,environmental protection by virtue of being relatively pollution-free,minimal damage to soil layer,and adaptability to various complex underground engineering construction conditions(Heet al.,2020).
In recent years,many researchers have systematically studied various distinct facets of this construction method,including the development and evolution of temperature field in the process of cross passages freezing and thawing,the variation of seepage field and displacement field when leakage occurs at different locations in the frozen soil curtain(Yueet al.,2005;Liet al.,2012;Liet al.,2012;Yanget al.,2017;Zhouet al.,2017;Maet al.,2019;Wanget al.,2019;Zhenget al.,2020),and the design and layout of freeze pipes.However,there is very limited research and analysis on the influence of freeze pipe deviation on the frozen wall formation in cross passage construction.The stability and safety of the frozen wall are of particular concern in the excavation of cross passages in soil strata.Deviation of the freeze pipes from their designed locations is among the most significant factors affecting the stability and safety of the frozen wall.In the drilling process,due to soil strata changes and human operation errors,freeze pipe holes deviate from their designed locations inevitably.The deviation in the freeze holes directly affects the overall quality and efficiency of the hole preparation and impacts the development of the temperature field of the frozen wall.For instance,the radial spacing between the freeze holes will vary if there are large deviations in the freeze hole’s orientation,and the actual frozen wall formed by AGF will be very different from the design.It will affect the overall frozen wall interconnection and other key technical indicators such as the average temperature and effective thickness of the frozen wall.In extreme cases,it may even cause engineering accidents such as freeze pipe fracture and water leaking into the cross passages,therefore delaying excavation or even leading to life losses(Maet al.,2020;Xiet al.,2020;Chenet al.,2019;Muet al.,2009;Chenet al.,2016;Fanet al.,2019;VITELet al.,2015;Huet al.,2018).Despite the significance of the issue,literature in this area is scarce.
This paper investigates in detail the influence of freeze pipe deviation on the performance of AGF in long cross-passage constructions using field measurements and finite element analysis.The prototype is based on the AGF application in the long cross passages along Fuzhou Metro Line 2 between Ziyang Station and Wuliting Station.The findings will provide a technical reference for the design and construction of similar projects in the future.
2 Engineering background
The shield tunnel between Ziyang station and Wuliting Station of Fuzhou Metro Line 2 is 6.2 m in outer diameter,5.5 m in inner diameter,and 350 mm in segment thickness.The interval cross passages and pump station line spacing is 66.8 m,making it the longest cross passages in China.According to the previous engineering experience,the design parameters of AGF are determined and shown in Table 1.The upper part of the stratum is mainly composed of fine silty sand,while the lower part is silt and sand.The soil has relatively weak strength and high permeability,rendering it prone to water gushing and sand piping.Therefore,the scheme of"horizontal freezing in the tunnel and excavation by mining method"is adopted.And the freeze holes are arranged in three ways,i.e.,upward,horizontal and downward,to ensure the integrity and stability of the frozen wall.

Table 1 Artificial ground freezing design parameters
3 Field measurement and analysis of the temperature field during AGF
3.1 Monitoring Scheme
A total of 189 freeze holes were arranged around the cross passages,with 95 and 94 holes on the left and right lines,respectively.Figure 1 shows the distribution of freeze and temperature measuring holes across the right line,and Table 2 lists the vertical distance between each temperature measuring hole and its adjacent freeze hole.Taking the right line excavation faces as an example,J1-J4 and J12 are located in the silty fine sand soil layer,J5-J8 and J13 in the silt sand layer,and J9-J11 in the sand soil layer.The temperature at different depths was monitored to observe the frozen wall development and guide the freezing process.

Table 2 The distance between temperature measuring hole and adjacent freeze hole in the right line(mm)
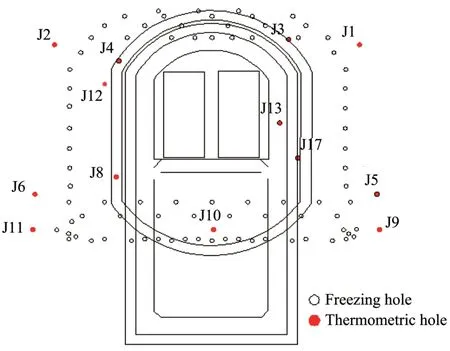
Figure 1 Layout of freeze holes in cross passages
3.2 Analysis of field measurement data
3.2.1 Ground temperature variation during the active freezing period
Variation in the soil temperature at depths of 17.5 m,20.5 m and 23.5 m as measured from the excavation surface and the surface is shown in Figure 2 to observe the cooling rate at various depths.During the early freezing stage,the soil close to the surface in the vicinity of the freeze pipe is contacted with brine to absorb heat,and the temperature decreases rapidly compared with soil at various depths.However,as the freezing process continues,the temperature-drop rate in the surface begins to fall compared to that of deeper soil layers.The slower drop in surface temperature can be attributed to heat exchange with air by convection.Therefore,thermal insulation can be adopted at the surface to improve the freezing efficiency.
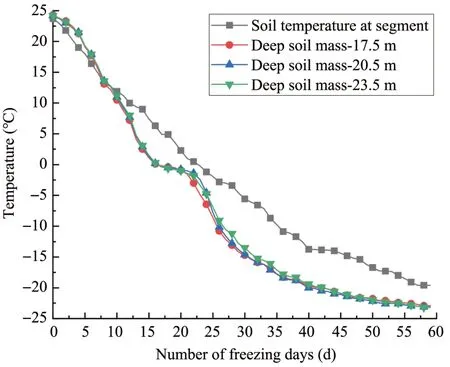
Figure 2 Variation in soil temperature at different depths
3.2.2 Analysis of the freezing effect at different soil layers
The temperature data of J1 and J5 temperature measurement holes,located respectively in the fine silty sand and silt-sand layers in the cross passages,are compared in Figure 3.It takes about 16 days for the temperature of the upper silty fine sand layer to drop to 0°C,with an average cooling rate of 1.46°C/d.In contrast,it takes about 23 days for the temperature of the lower silt-sand layer to drop to 0°C,with an average cooling rate of 1.08°C/d.This indicates that the heat transfer in the silty fine sand layer is more efficient than that of the silt-sand layer.When the heat exchange between the soil and the brine gradually reaches equilibrium,the average temperature in the siltsand layer is found to be-15.05 °C,whereas that in the silt silty fine sand layer is-12.61 °C,indicating that the freezing effect of the silt-sand layer is better than that of the silt silty fine sand layer.
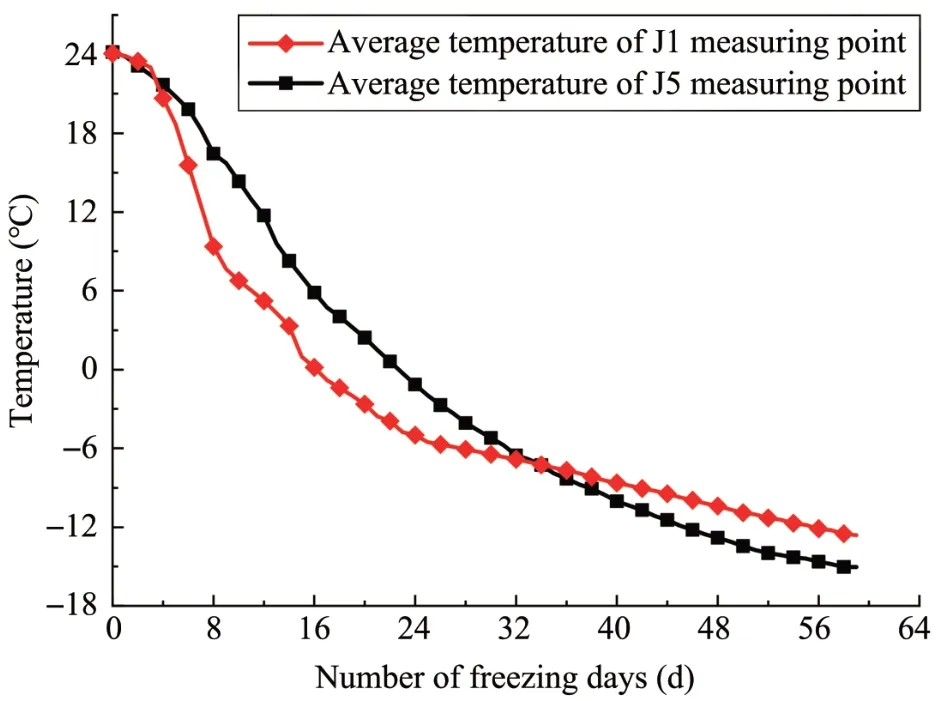
Figure 3 Variation in temperature data measured in J1 and J5 with freezing time
4 Finite element simulation of the temperature field
4.1 Thermal Properties and Boundary Conditions
The development and subsequent evolution of soil temperature field are closely related to parameters such as thermal conductivity,specific heat capacity and brine temperature.A finite element model of the temperature field of a cross passage was established according to the actual deviation of completed freezing boreholes.It is assumed that heat conduction is the only mode of heat transfer between the soil and freeze pipes within the considered domain.Adiabatic boundary conditions are imposed on the upper and side boundaries of the model.The finite element analysis was conducted with ANSYS software using the Quad4 node55 element.The thermal properties of fine silty sand soil layer and the silt sand layer are shown in Table 3,whereλuandλfare the thermal conductivities respectively of the unfrozen and frozen soil,andCuandCfare the specific heat capacities of the unfrozen and frozen soil respectively.The enthalpy values of the soil layers were set considering the latent heat of soil phase change and shown in Table 4.

Table 3 Main thermodynamic parameters of the soil layer

Table 4 Soil enthalpy
The initial soil temperature was set at 24 °C to be consistent with the field data and local meteorological data.The temperature of the freeze pipe wall is set to the temperature of chilled brine measured in the field.
4.2 Establishment of finite element model
A two-dimensional planar model of dimensions 25 m×25 m was created based on the prototype of a long cross passage,considering the two distinct schemes of randomly deviating and unbiased deviating freezing pipes.The size of the computational domain was chosen as four times the width of the frozen wall structure.Figure 4 illustrates the geometries and distribution of the freeze holes of the two cases.Three characteristic sections of the predicted weak freezing area within 50 days of the active freezing period were assigned at distances or depths of 15 m,20 m,and 25 m from the subway tunnel,as depicted in Figure 5.The purpose of this paper is to reveal the freezing effect by using the characteristic surfaces of the three predicted freezing weak areas.
A total of 32Φ108×8 mm freeze holes and 6Φ 108×8 mm temperature measuring holes J1,J2,J5,J6,J12,and J13 were created.The exact location information of these holes is presented in Table 2.
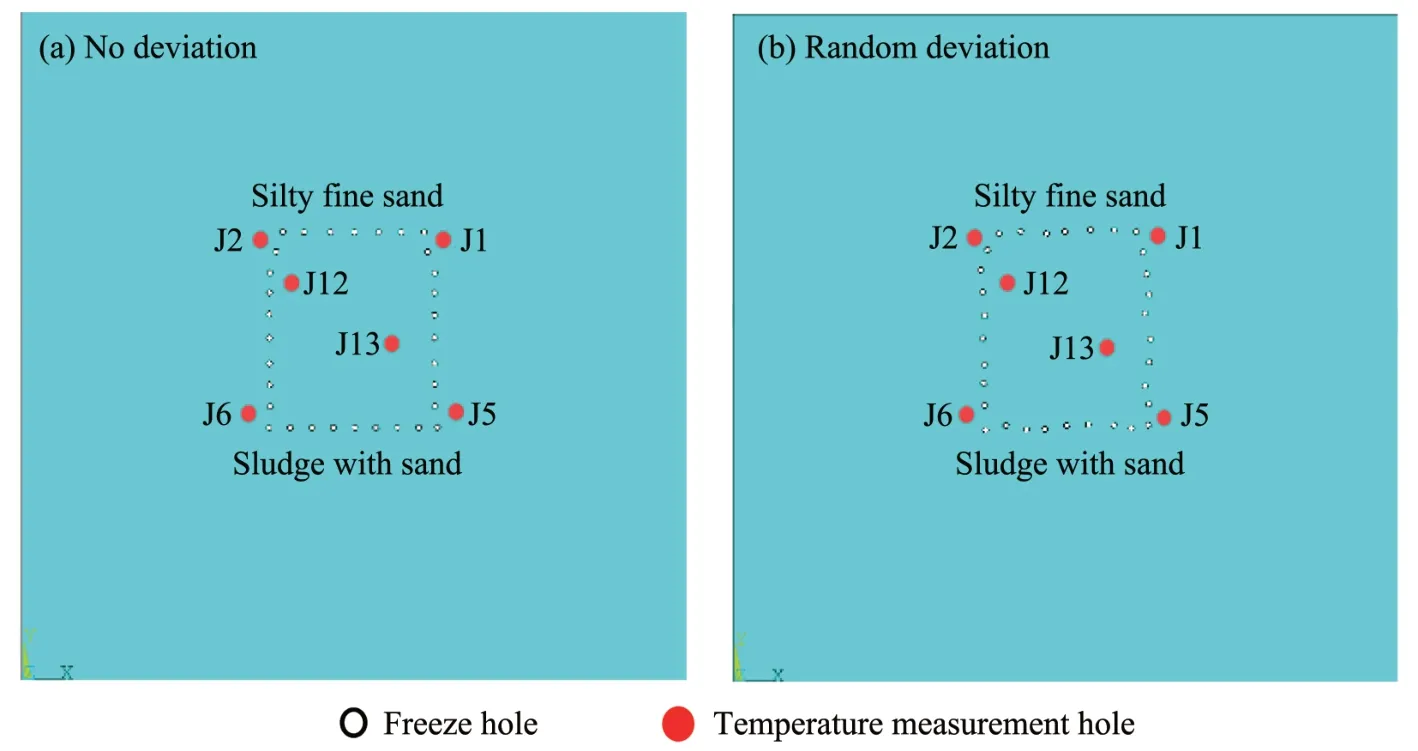
Figure 4 Finite element models at a depth of 25 m for cases with and without random deviation
4.3 Comparison of numerical simulation results with measured data
The finite element model of the characteristic section of 25 m depth is selected to examine the degree of agreement between the numerical simulation results of different models and the measured data.The simulated values under the three conditions at J1 are compared with the field measured results,as shown in Figure 6.At the initial stage of active freezing,the temperature drops fast,with the maximum cooling rate reaching around 1.9 °C/d under an ideal unbiased state.As the system slowly attains thermal equilibrium with increasing freezing time,the cooling rate gradually declines.The maximum temperature difference between the field measured and simulated values occurs at around the 17th day,and the maximum temperature difference between the ideal unbiased state and the field measured value reaches 5.5 °C.This is because the soil is regarded as homogeneous isotropic material in the numerical simulation,and the influence of water migration is ignored.In reality,the soil is a porous,non-uniform continuum,and there always exists water migration,which affects the thermal properties of soil.During the entire active freezing period,the calculated and measured values share a similar trend.To sum up,the model is effective and reliable.
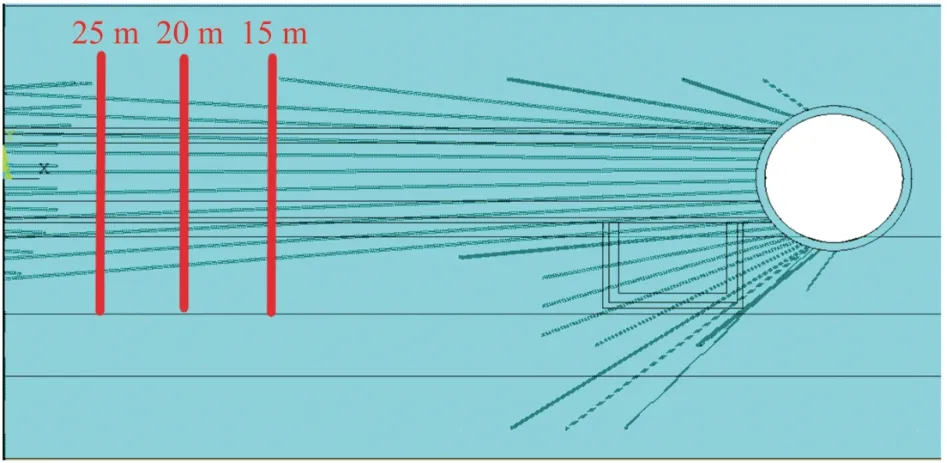
Figure 5 Location of feature sections
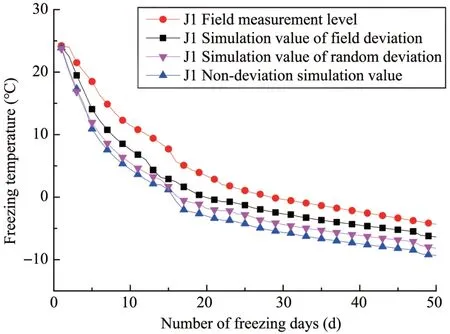
Figure 6 Comparison of measured and simulated temperature at hole J1
5 Effect of freeze pipe deviation on the characteristics of frozen wall
5.1 Frozen wall interconnection time
The main reason for selecting the 25-m deep section is that it is within the weak zone of the whole freezing project according to the temperature field results of the longitudinal section.Also,there is only a single row of freeze holes spaced at a large distance in this zone.In the model with randomly distributed deviations,the frozen wall interconnection time at a depth of 25 m is the longest,i.e.,24 days.The thickness of the thinnest frozen wall segment is the smallest under the cases of random deviation and ideal nondeviation,and the thickness difference of the thinnest frozen wall is the largest.Therefore,taking the depth of 25 m as the strategic depth,the influence of random deviation on the development of the frozen wall is analyzed.From Figure 7,it can be observed that in the case of freeze holes without any deviation,the cooling effect at each position is uniform.The freezing front develops evenly from the center of the freeze hole to the surrounding soil,and a continuous frozen wall is formed after 18 days of freezing.However,at the same freezing time,sections of the frozen wall are not completely connected yet in the case of randomly deviating freeze pipes.Further,sections of the frozen wall begin to connect after 24 days of active freezing,and there is an obvious weak freezing connection on the left wall of the cross passage.This suggests that the random deviation in the freeze tube affects the temperature field development,delays the freezing front connection and prolongs the freezing time.
Figure 8 shows the outlines of the frozen wall in the cases of random deviation and no deviation after 20 days and 50 days.Since the distribution of the freeze pipes in the random deviation case leaves uneven space between freeze holes than in the perfectly aligned case,the temperature field develops unevenly,especially on the left sidewall.In the no deviation case,the temperature field evolves symmetrically,and each freeze pipe transmits cooling evenly to the surrounding soil.Although the average thickness of the frozen wall at different locations is similar in both cases,the thickness of different frozen walls is uniform in the no deviation case,whereas,in the case of random deviation,it shows a significant degree of variation.Unlike in the no deviation case,in the random deviation model,the contour of the frozen wall is irregular,and a weak freezing region exists in the left wall of the cross passage.After freezing for 50 days,the shape of the frozen wall contour is very similar in both cases,and the minor differences are only noticeable at some distinct positions.The arrangement of freeze holes is staggered,and the thickness of the frozen wall formed by the same row of freeze holes is different.Compared with the no deviation case,the contour of the frozen wall is irregular,and an obvious freezing weak zone appears.At the early stage of freezing,the random deviations have a greater impact on the development of the frozen wall,with the contour of the frozen wall being more irregular and with greater fluctuations.As the freezing continues,the contour of the frozen wall in the random deviation case gradually becomes smoother and increasingly similar to the contour of the frozen wall in the no deviation case.
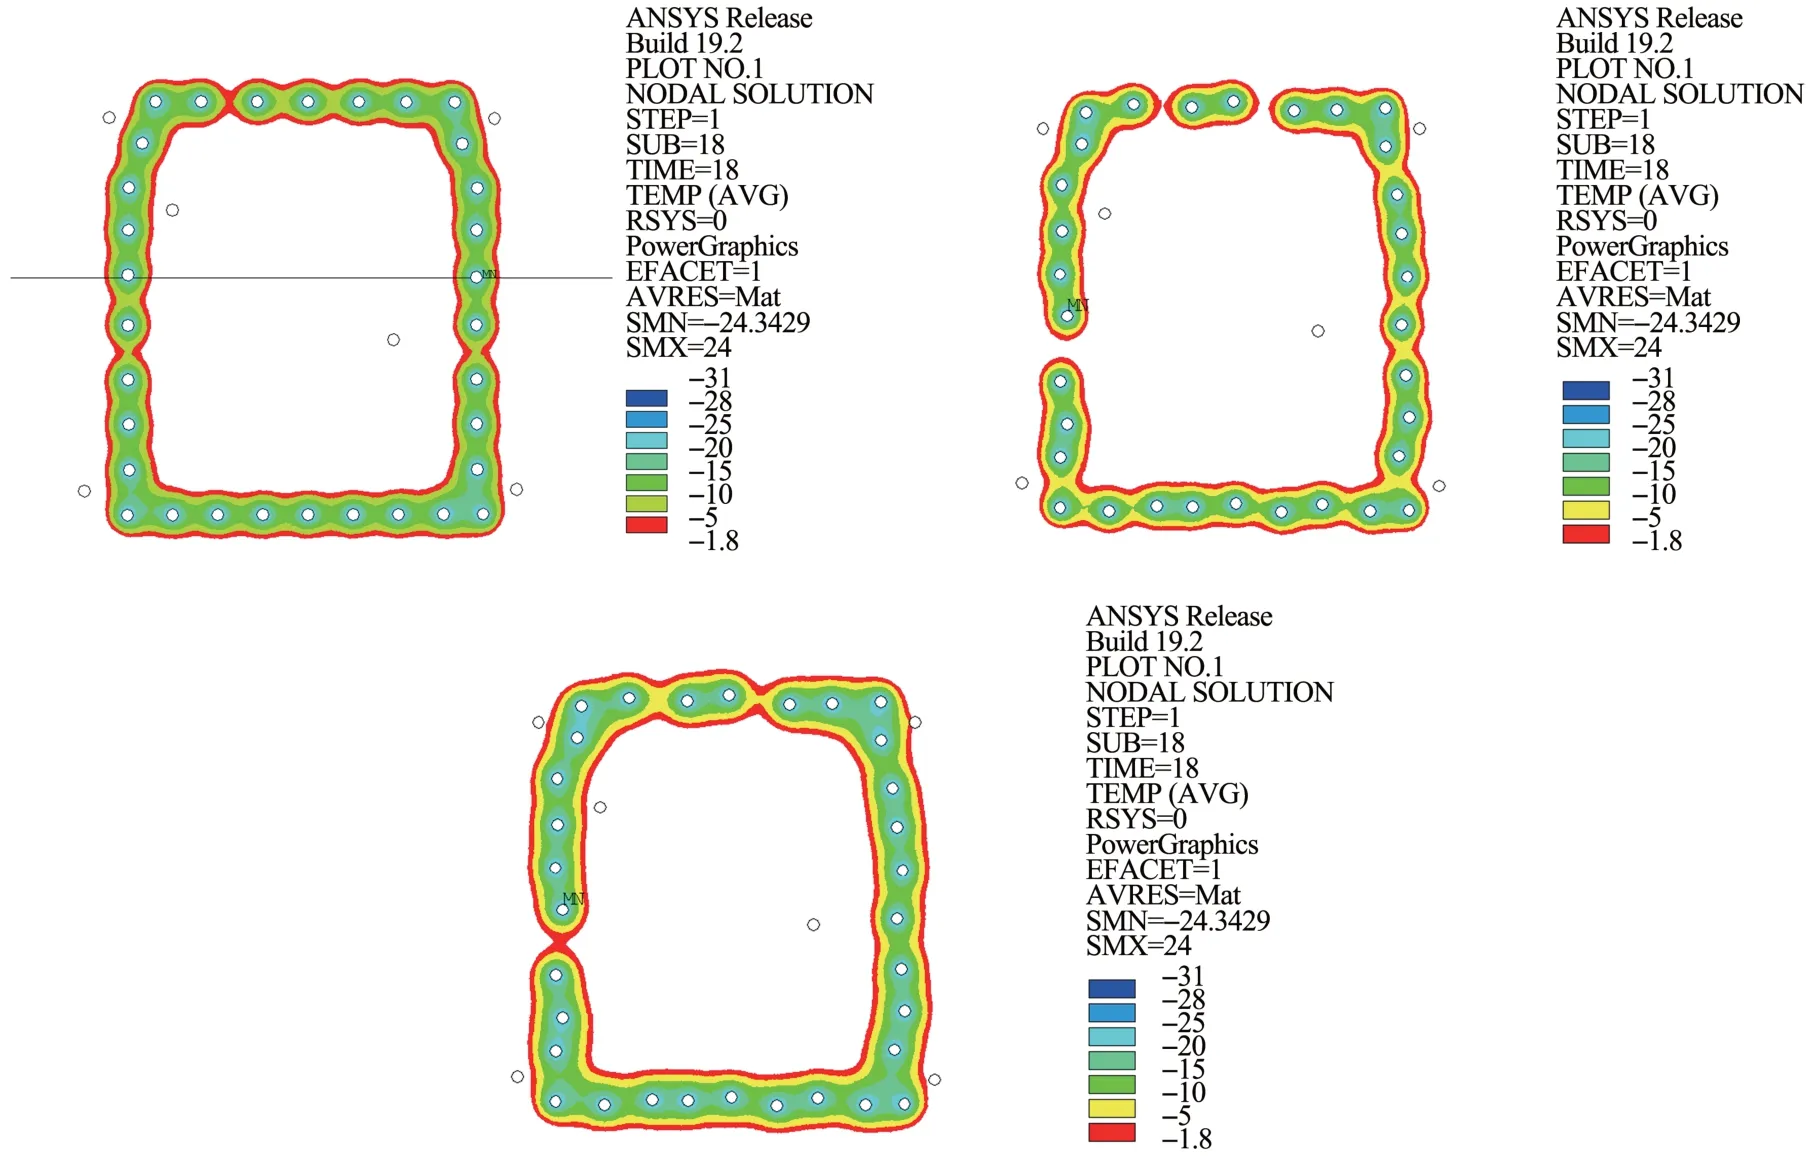
Figure 7 The intersection of the frozen wall of the 25-m model

Figure 8 The cloud maps of the frozen wall at the beginning and end of freezing at a depth of 25 m
5.2 Frozen wall thickness
According to"Technical Specification for Crosspassage Freezing Method of Urban Rail Transit Project in Fujian",the random deviation of freeze holes at a depth of 25 m should be controlled within 250 mm,random deviation of freeze hole in other depths should be controlled within 200 mm.According to the field measured data,the maximum actual deviation at 25 m depth is 228 mm at the study site.Therefore,a freeze-pipe random distribution program was written in the VC++platform to further analyze the influence of the amount of deviation on the frozen wall and the interconnection time through numerical analysis.Two deviation values at 25 m,i.e.,150 mm and 200 mm,were considered.Table 5 shows the interconnection time and thickness of the thinnest frozen wall segment under different deviation values.The results indicate that with the increase in the deviation,the frozen wall interconnection time is prolonged,and its thinnest thickness is reduced.

Table 5 Interconnection time and thickness of the thinnest part of the frozen wall
The evolution of the thickness of the thinnest frozen wall of the characteristic section at 25 m depth is compared between the no deviation case and the random deviation case.The frozen wall is interconnected in 24 days under the random deviation case.Hence,the comparison time is chosen to be from 25 days to 50 days,as shown in Figure 9.At 25 days,the difference in the thickness of the thinnest frozen wall between the two models is found to be the largest,i.e.,0.75 m.After 50 days of freezing,the thickness of the thinnest frozen wall segment is 2.56 m under the no deviation condition and 2.25 m under the random deviation condition,with a difference of 0.31 m.Such difference between the two conditions is seen to decrease with time.This is because before the comparison period,the thinnest frozen wall has evolved for a period of 6 days under the no deviation case,and the development speed of the thinnest frozen wall is relatively uniform during the comparison period.In contrast,the thinnest frozen wall in the random deviation case develops rapidly from 25 days to 35 days and then expands relatively uniformly afterward.This indicates that random deviation has a greater impact on the thickness of the frozen wall in the early freezing stage.With the increase in freezing time,the difference in the thickness of the thinnest frozen wall for the two models decreases gradually,as the impact of random deviation is gradually reduced.During the freezing process,the difference between the thickness of the thinnest part of the frozen wall and the average thickness of the frozen wall is always less than 0.05 m in the no deviation case,and the freezing front is smooth without any noticeable discontinuities or kinks.However,in the case of random deviation,the difference between the minimum thickness of the frozen wall and the average thickness of the frozen wall is always greater than 0.3 m,indicating that random deviation will hamper the uniform development of the frozen wall,resulting in the formation of a weak zone and poor integrity in the frozen wall.
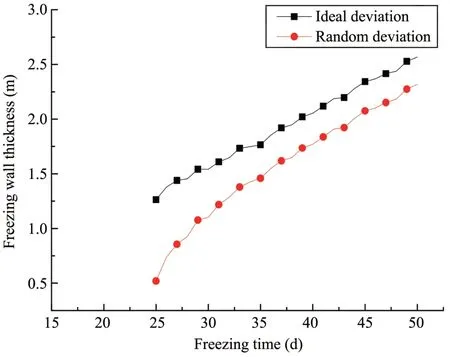
Figure 9 Variation of the thinnest frozen wall thickness in the characteristic section at a depth of 25 m for cases with and without deviation
5.3 Temperature field
The cloud chart of the temperature field at the beginning and end of freezing under the condition of random deviation of freeze pipe is illustrated in Figure 10.It can be seen from the figure that the temperature field under the condition of random deviation is significantly less even due to the deviation of freeze pipe,especially on the left sidewall.In the initial freezing stage,the random deviation has a greater impact on the development of the frozen wall,and the contour of the frozen wall is more irregular.As the freezing time increases,the contour line of the frozen wall under the condition of random deviation gradually improves and becomes smoother,and there are no obvious weak freezing zones.

Figure10 The Cloud maps of freezing temperature field of the model at a depth of 25 m
6 Comparison on the variation of frozen wall characteristic parameters with depths
6.1 Comparison of Interconnection Time of Frozen Wall at Different Depths
The temperature field cloud chart is analyzed,and the frozen wall interconnection time with and without freeze hole deviation is obtained to analyze the influence of random deviation on the frozen wall development,as shown in Table 6.The interconnection time of the frozen wall for the characteristic section at 15 m depth in the non-deviation case is found to be 16 days,whereas it is 20 days in the random deviation case.The difference of 4 days in the frozen wall interconnection time between the two cases is the minimum based on the finite element modeling results.

Table 6 Frozen wall interconnection time at various depths for different models
The interconnection time of the frozen wall in the random deviation case is greater than that of the no deviation case.In general,the interconnection time increases with the increase in depth.This is due to the fact that the freeze hole in the cross passage is bored by a divergent drilling device,and the horizontal arrangement is not absolute.With the increase in depth,random deviation may cause considerable hole spacing variation,and the divergence between the actual temperature field development and the design values will be greater.
The frozen wall interconnection at different depths is shown in Figure 11.It can be observed from Figure 11 that when the frozen wall interconnections,in the no deviation case,the soil near each freeze pipe is frozen evenly,and the frozen wall on both sides develop symmetrically along the central axis.The thickness of the frozen wall segments at different locations is roughly the same.When random deviation exists in the freeze pipe installation,the distribution of soil cooling capacity around the freeze pipe is uneven,and the frozen wall develops irregularly,resulting in considerable differences in the interconnection time.
6.2 Comparison of Frozen Wall Thickness Variation at Different Dept
Through the finite element simulation,the values of the thickness of the thinnest part of the frozen wall for both models are obtained,as shown in Table 7.It can be seen from the table that as the depth increases from 15 m to 25 m,the thickness of the thinnest frozen wall section decreases to 2.25 m and 2.56 m under random deviation and no deviation cases,respectively,but the thickness difference of the thinnest frozen wall section between the two cases increases from 0.13 m to 0.31 m.This shows that with the increase in depth,the thickness of the thinnest frozen wall becomes thinner for both cases,and the influence of the random deviation of the freeze pipes on the difference of the thinnest frozen wall section gradually increases.
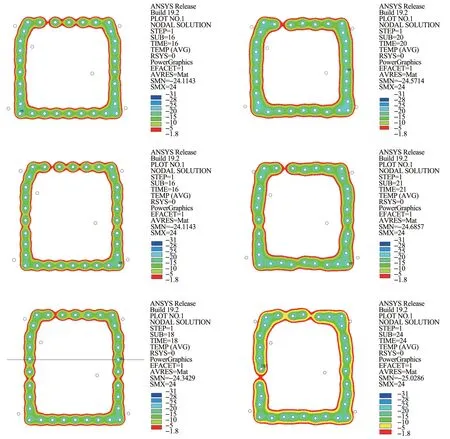
Figure 11 The cloud maps of the intersection of frozen walls at different depths

Table 7 Thickness of the thinnest section of the frozen wall
7 Conclusions
This study investigates the effects of freeze pipe deviation from their designed position on the temperature field and frozen wall development through finite element analysis of artificial ground freezing in a long cross-passage.Two cases,i.e.,random deviation in freeze pipe installation and no deviation,are considered.The following conclusions can be drawn:
(1)The frozen wall interconnection time of the model at a distance of 25 m from the excavation surface in the no deviation case and the random deviation case is 24 days and 18 days,respectively,with a difference of six days,which is the maximum among the models studied.The random deviation of the freeze pipe will delay the freezing front interconnection and prolong the time required for frozen wall completion.
(2)In the early freezing stage,the thickness difference of the thinnest frozen wall section under the no deviation case and random deviation case is 0.75 m.The random deviation has an adverse impact on the development of the temperature field,leading to poor integrity in the frozen wall.As the freezing time increases,the thickness difference of the thinnest frozen wall section under the two cases decreases to 0.31 m.With the increase in the horizontal depth of the cross passage,the thickness of the thinnest part of the frozen wall decreases in both cases.
(3)The amount of deviation also impacts the thickness and interconnection time of the frozen wall.When the deviation upper limit increases from 150 mm to 200 mm,the thickness of the thinnest frozen wall reduces from 2.67 m to 2.62 m,whereas the interconnection time lengthens from 12 days to 14 days.It indicates that the amount of deviation affects the intersection time of the thinnest frozen wall and the thickness of the frozen wall.In general,with the increase in the amount of deviation,the frozen wall interconnection time will be prolonged,and the thickness of the thinnest frozen wall will become thinner.
Acknowledgments:
This study was supported by the National Natural Science Foundation of China(51504070,41672278),the Key Laboratory Open Subject Fund of Fujian University of Underground Engineering(KF-T18014),the Outstanding Young Scientific Research Talents Cultivation Program of Fujian University(GY-Z17070),the Research Development Fund of Fujian Institute of Engineering(GY-Z17158),the Fujian Provincial Natural Science Foundation Projects(2017Y4001),and Fuzhou Science and Technology Bureau(2017-G-59,2018-G-77).
杂志排行
Sciences in Cold and Arid Regions的其它文章
- The influence of the underpassing frozen connecting passage on the deformation of the existing tunnel
- Thermal-Hydro-Mechanical coupled analysis of unsaturated frost susceptible soils
- Frozen curtain characteristics during excavation of submerged shallow tunnel using Freeze-Sealing Pipe-Roof method
- Discussion on pile axial load test methods and their applicability in cold regions
- Application of automated cone penetrometer for railway investigation using correlations with DCPI and Deflection Modulus
- Triaxial test on glass beads simulating coarse-grained soil
