A Case Analysis of the lnfluencing Factors of Job Satisfaction of Licensed Pharmacists in Retail Pharmacies Based on SEM-Taking R Retail Pharmacy for an Example
2022-12-30ChenJingCuiYuxueChenJing
Chen Jing,Cui Yuxue,Chen Jing
(School of Business Administration,Shenyang Pharmaceutical University,Shenyang 110016,China)
Abstract Objective To explore the influencing factors on job satisfaction of licensed pharmacists in R retail pharmacy,and to provide a reference for improving the job satisfaction of licensed pharmacists in China.Methods Through literature research and satisfaction questionnaire,349 licensed pharmacists in R retail pharmacy were investigated.Then,the influencing factor equation model was constructed by factor analysis and structural equation method.Results and Conclusion The overall adaptation of the structural equation model was well established.The job satisfaction of licensed pharmacists in R retail pharmacy was closely related to interpersonal relationship,work characteristics,good management,salary and growth opportunity,and it was not significantly correlated with job environment.Therefore,work characteristics influenced most,followed by salary.Five key factors affecting the job satisfaction of licensed pharmacists in R retail pharmacy are summarized in this paper.It is suggested to adjust corresponding key factors such as work characteristics and salary,so as to improve job satisfaction of licensed pharmacists in the same industry.
Keywords: R retail pharmacy;licensed pharmacist;job satisfaction;structural equation model (SEM)
Licensed pharmacists are professionals for drug quality control and providing safe medical services for drug users.Therefore,it is vital to pay attention to their job satisfaction.On November 19,2020,the National Medical Products Administration (NMPA)issued a “Notice on the Standardized Use of Licensed Pharmacists in Drug Retail Enterprises”,which means that pharmacies should give full play to the role of licensed pharmacists[1].By end of May 2021,the total number of registered the licensed pharmacists in the validity period was 622 602,an increase of 10 198 from the previous month.The number of licensed pharmacists per 10 000 population was 4.4.There are 568 175 licensed pharmacists registered in pharmaceutical retail enterprises,accounting for 91.2% of all[2].The proportion and number are large,but Chinese scholars pay less attention to the job satisfaction of licensed pharmacists in retail pharmacies.In this paper,349 licensed pharmacists in R retail pharmacy were investigated through the questionnaire.Then,the five-level scale was used to analyze the influencing factors of job satisfaction from six dimensions: Job environment,work characteristics,interpersonal relationship,organizational management,salary and growth opportunity.
1 Objects and methods
1.1 Survey objects and methods
R retail pharmacy has a total of 349 licensed pharmacists.We selected all the licensed pharmacists as the research objects and carried out the online survey.In order to ensure the quality of the survey,50 pharmacists were selected to organize and fill in the questionnaire after going through the online system training,and the questions were answered immediately online.R retail pharmacy is a large drug retail chain,giving priority to selling pharmaceutical products and health related products.From the beginning of its establishment to now,it has been in the first position in China’s drug retail industry.Besides,the company attaches importance to the role of licensed pharmacists.Through continuous innovation and reform,combined with the consumption characteristics and changes of the times,the company has developed its own business features.
1.2 Questionnaire design
First,we learned the questionnaire survey of Ma Qing (2015) on the job satisfaction of hospital pharmacists in 16 Provinces and cities in the southwest and northwest of China,and made an analysis from five aspects: Treatment or professional title,working environment,recognition degree of medical staff,leaders’ attention and the importance of selfevaluation[3].In addition,we studied Cao Wenjuan’s research (2021) on the evaluation the job satisfaction of psychiatric medical professionals from the five aspects of internal environment,work pressure,work environment,organizational management,and salary[4].Based on Maslow’s hierarchy of needs theory,the ERG theory,and Herzberg two-factor theory on job satisfaction,we used the Minnesota questionnaire (MSQ scale) jointly compiled by Weiss,Dawis,England and Lofquist in 1961 to summarize the influencing factors of licensed pharmacists’ job satisfaction.
Combined with the relevant research literature and theories,the first draft of the questionnaire was designed.Then,the licensed pharmacists in R retail pharmacy were interviewed.Finally,refined the survey results were refined with high-frequency viewpoints to form the first draft of the revised questionnaire.In order to make the questionnaire more reasonable,40 pre-surveys were conducted to improve the questionnaire.The final questionnaire was divided into two parts,the first covering personal basic information,and the second part including work environment,interpersonal relations,work characteristics,organizational management,salary and growth opportunity.This study presented 7 variables and 23 items.The Likert 5-point scale was used with a maximum of 5 and a minimum of 1.The higher the scores of all scales,the better their corresponding evaluation level.
2 Results
A total of 330 were collected from 1st to 7th in May 2021 through online questionnaires to 349 licensed pharmacists in R retail pharmacy.After screening,318 were effective questionnaires with an overall efficiency of 91%.After inputting the 318 valid questionnaires,descriptive analysis reliability validity analysis and differential analysis were performed by SPSS21.0 software.Meanwhile,the structural equation model (SEM) constructed in this paper was verified by AMOS software.
2.1 Demographic analysis
The basic information of the survey respondents is shown in Table 1,and the descriptive statistics for the 23 measurements are shown in Table 2.The values range from 1 to 5,reflecting the differences between the respondents.During the screening stage,the questionnaires with the identical values are deleted to ensure the difference of all items.The minimum mean is 3.700 and the maximum mean is 3.750.The minimum standard deviation is 0.917 and the maximum is 1.340,which are different from the total 5 points,indicating the low degree of discrete data.
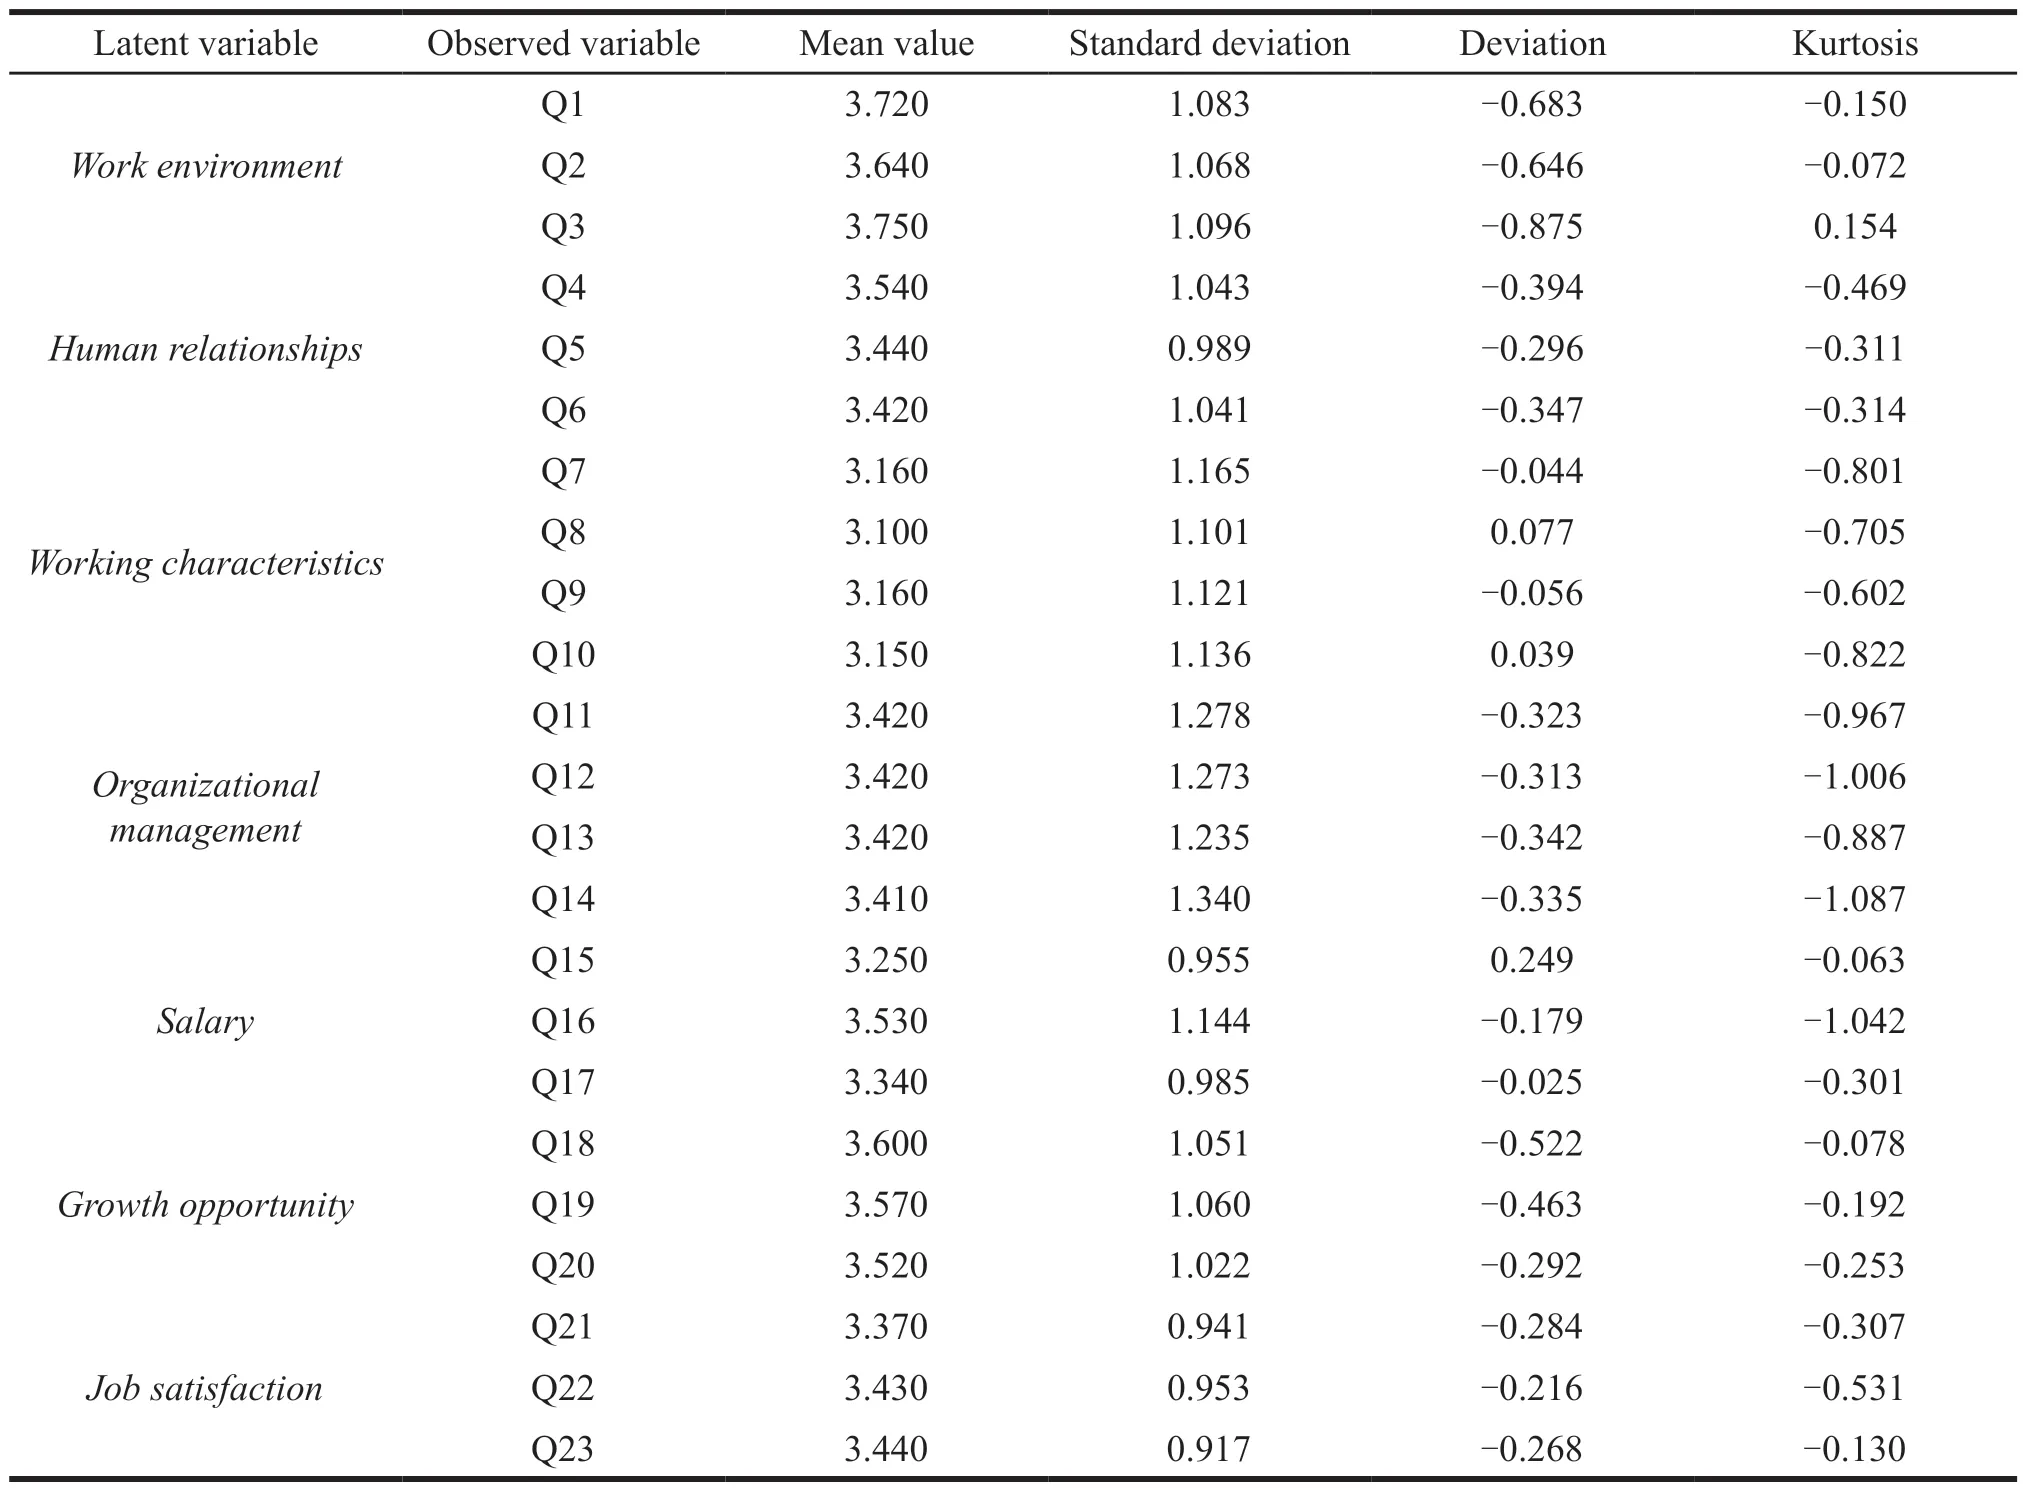
Table 2 Descriptive statistical results (n=318)
The deviations and kurtosis in Table 2 are the standard distribution tests of the official survey data.In general,the model essentially follows the standard distribution when the absolute value of deviation is less than 2 and the kurtosis is less than 7.From the table,we can see that the absolute value of the deviation for all measurement problems is less than 2 and the absolute value of kurtosis is less than 7.Therefore,it can be concluded that the research on a large sample of survey data for each measurement problem essentially meets the important value requirements mentioned above and can carry out a deep analysis[5].
2.2 The reliability and validity test
2.2.1 The reliability test
The reliability test of the questionnaire is the test of the reliability and credibility of the questionnaire.It mainly reflects the authenticity of the measured data,and it is the result of the test tool for consistency or stability.Reliability is divided into internal reliability and external reliability.The internal reliability test is a set of questions that measures the internal consistency and scale of each subject of the same concept.The higher the internal consistency of the questionnaire,the better the reliability of the questionnaire.Internal reliability of the Cronbach’s alpha is used in this study.The larger the Cronbach’s alpha coefficient,the better the internal consistency of the questionnaire[6].As to the range of intermediate values,researchers believe the Cronbach’s alpha coefficient of over 0.9 indicates that the internal consistency of the questionnaire is high.The Cronbach’s alpha coefficient greater than 0.9 demonstrates the internal consistency of the high questionnaire.Cronbach’s alpha values between 0.8 and 0.9 indicate that the internal consistency of the questionnaire is good.The Cronbach’s alpha coefficient between 0.7 and 0.8 indicates that the consistency of the questionnaire is universal.Cronbach’s alpha less than 0.7 means that internal consistency of questionnaires is bad and the questionnaire cannot be taken as a tool.Internal consistency of the questionnaire is examined by the reliability of the various parts of the relevant scale.It is seen from the table that in the scale above 0.7,the Cronbach’s alpha has a relatively high consistency within the questionnaire that can be used as a research tool for this study[7].
As shown in Table 3,the variables for work environment include 3 question items,and its Cronbach’sɑcoefficient is 0.900.The interpersonal variables contain 3 question items and its Cronbach’sɑcoefficient is 0.880.The variables for work feature contain 4 question items and its Cronbach’sɑcoefficient is 0.888.The organizational management variables contain 4 question items and its Cronbach’sɑcoefficient is 0.911.Variables for salary contain 3 question items and its Cronbach’sɑcoefficient is 0.863.Variables for growth opportunity contain 3 question items and its Cronbach’sɑcoefficient is 0.902.The job satisfaction variables include 3 subject items,and its Cronbach’sɑcoefficient is 0.833.The Cronbach’sɑcoefficient after items being deleted is not greater than the Cronbach’sɑcoefficient of each variable.In addition,the relationship between the observed variables of corrected item-total correlation(CITC) and their latent variables is mostly between 0.6 and 0.9,meeting the requirements of above 0.5.This indicates that the correlation coefficients of each observed variable and their associated latent variables are greater than 0.5,and most of them are between 0.6 and 0.9.Therefore,the potential variables for each question are well set,indicating a high overall credibility of the questionnaire[8].23 items that have passed the test will not be removed.Most importantly,Cronbach’sɑcoefficient is larger than 0.8,indicating the high reliability of the questionnaire with good internal consistency and stability of the scale.
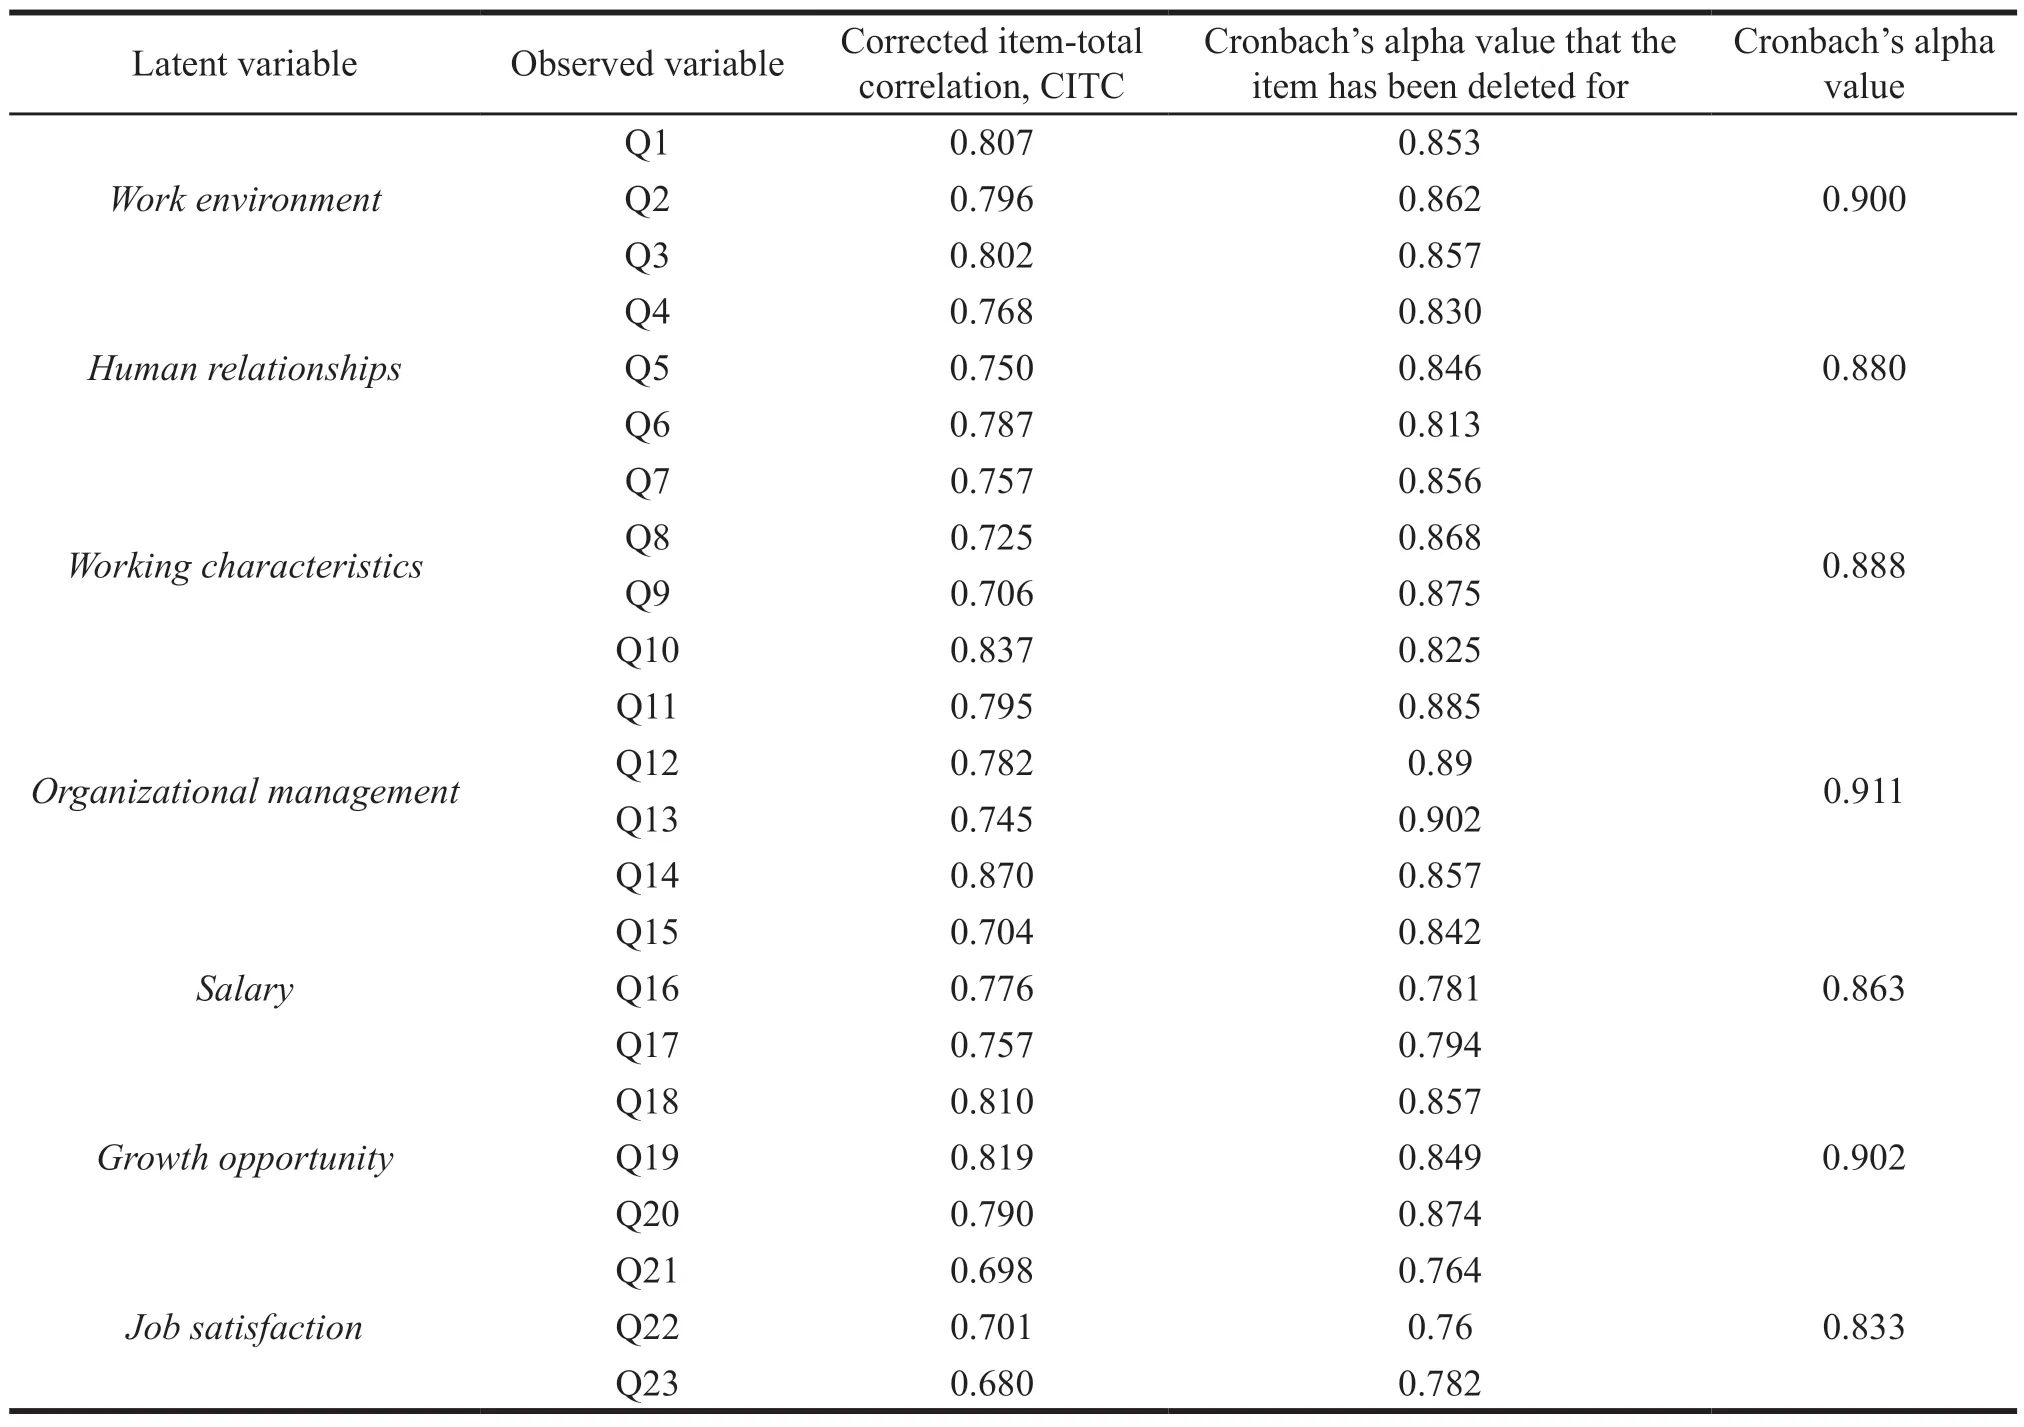
Table 3 Reliability test for each variable
2.2.2 The validity analysis
The purpose of the exploration factor analysis is to measure the validity of the scale structure,assess whether the measurement variables for each potential variable have consistency and stability,and the most commonly used metrics to assess the validityof the scale.SPSS21 is used to test the composition of various dimensions in this paper.When the effectiveness of factor analysis is used,we should first learn whether the conditions of factor analysis are satisfied.Generally speaking,two conditions are required,one is the KMO (Kaiser-Meyer-Olkin) value must be greater than 0.7,and the other is that the significance of Bartlett’s sphericity test is less than 0.05.If these two conditions show a strong correlation between the observed variables,it is suitable for factor analysis.
The exploratory factor analysis results in Table 4 show that the KMO value of the scale is 0.893,which is higher than the standard of 0.70.The Bartlett’s sphere calibration value is 4 313.573 and the Sig value is 0.000,which is suitable for factor analysis.The principal component analysis method is used to extract elements with Eigen values greater than 1.The results show that six common factors have been extracted.The square of this circle is over 80.155% and 60%.Through orthogonal rotation,the 25 question schemes can be divided into six elements and the load of each element is greater than 0.5,indicating that the information contained in the extracted six elements is complete without high double factor load.Then,each observed variable is aggregated under one dimension according to the theoretical preset[9].The above analysis shows that the scale selected in this paper has good structural value.
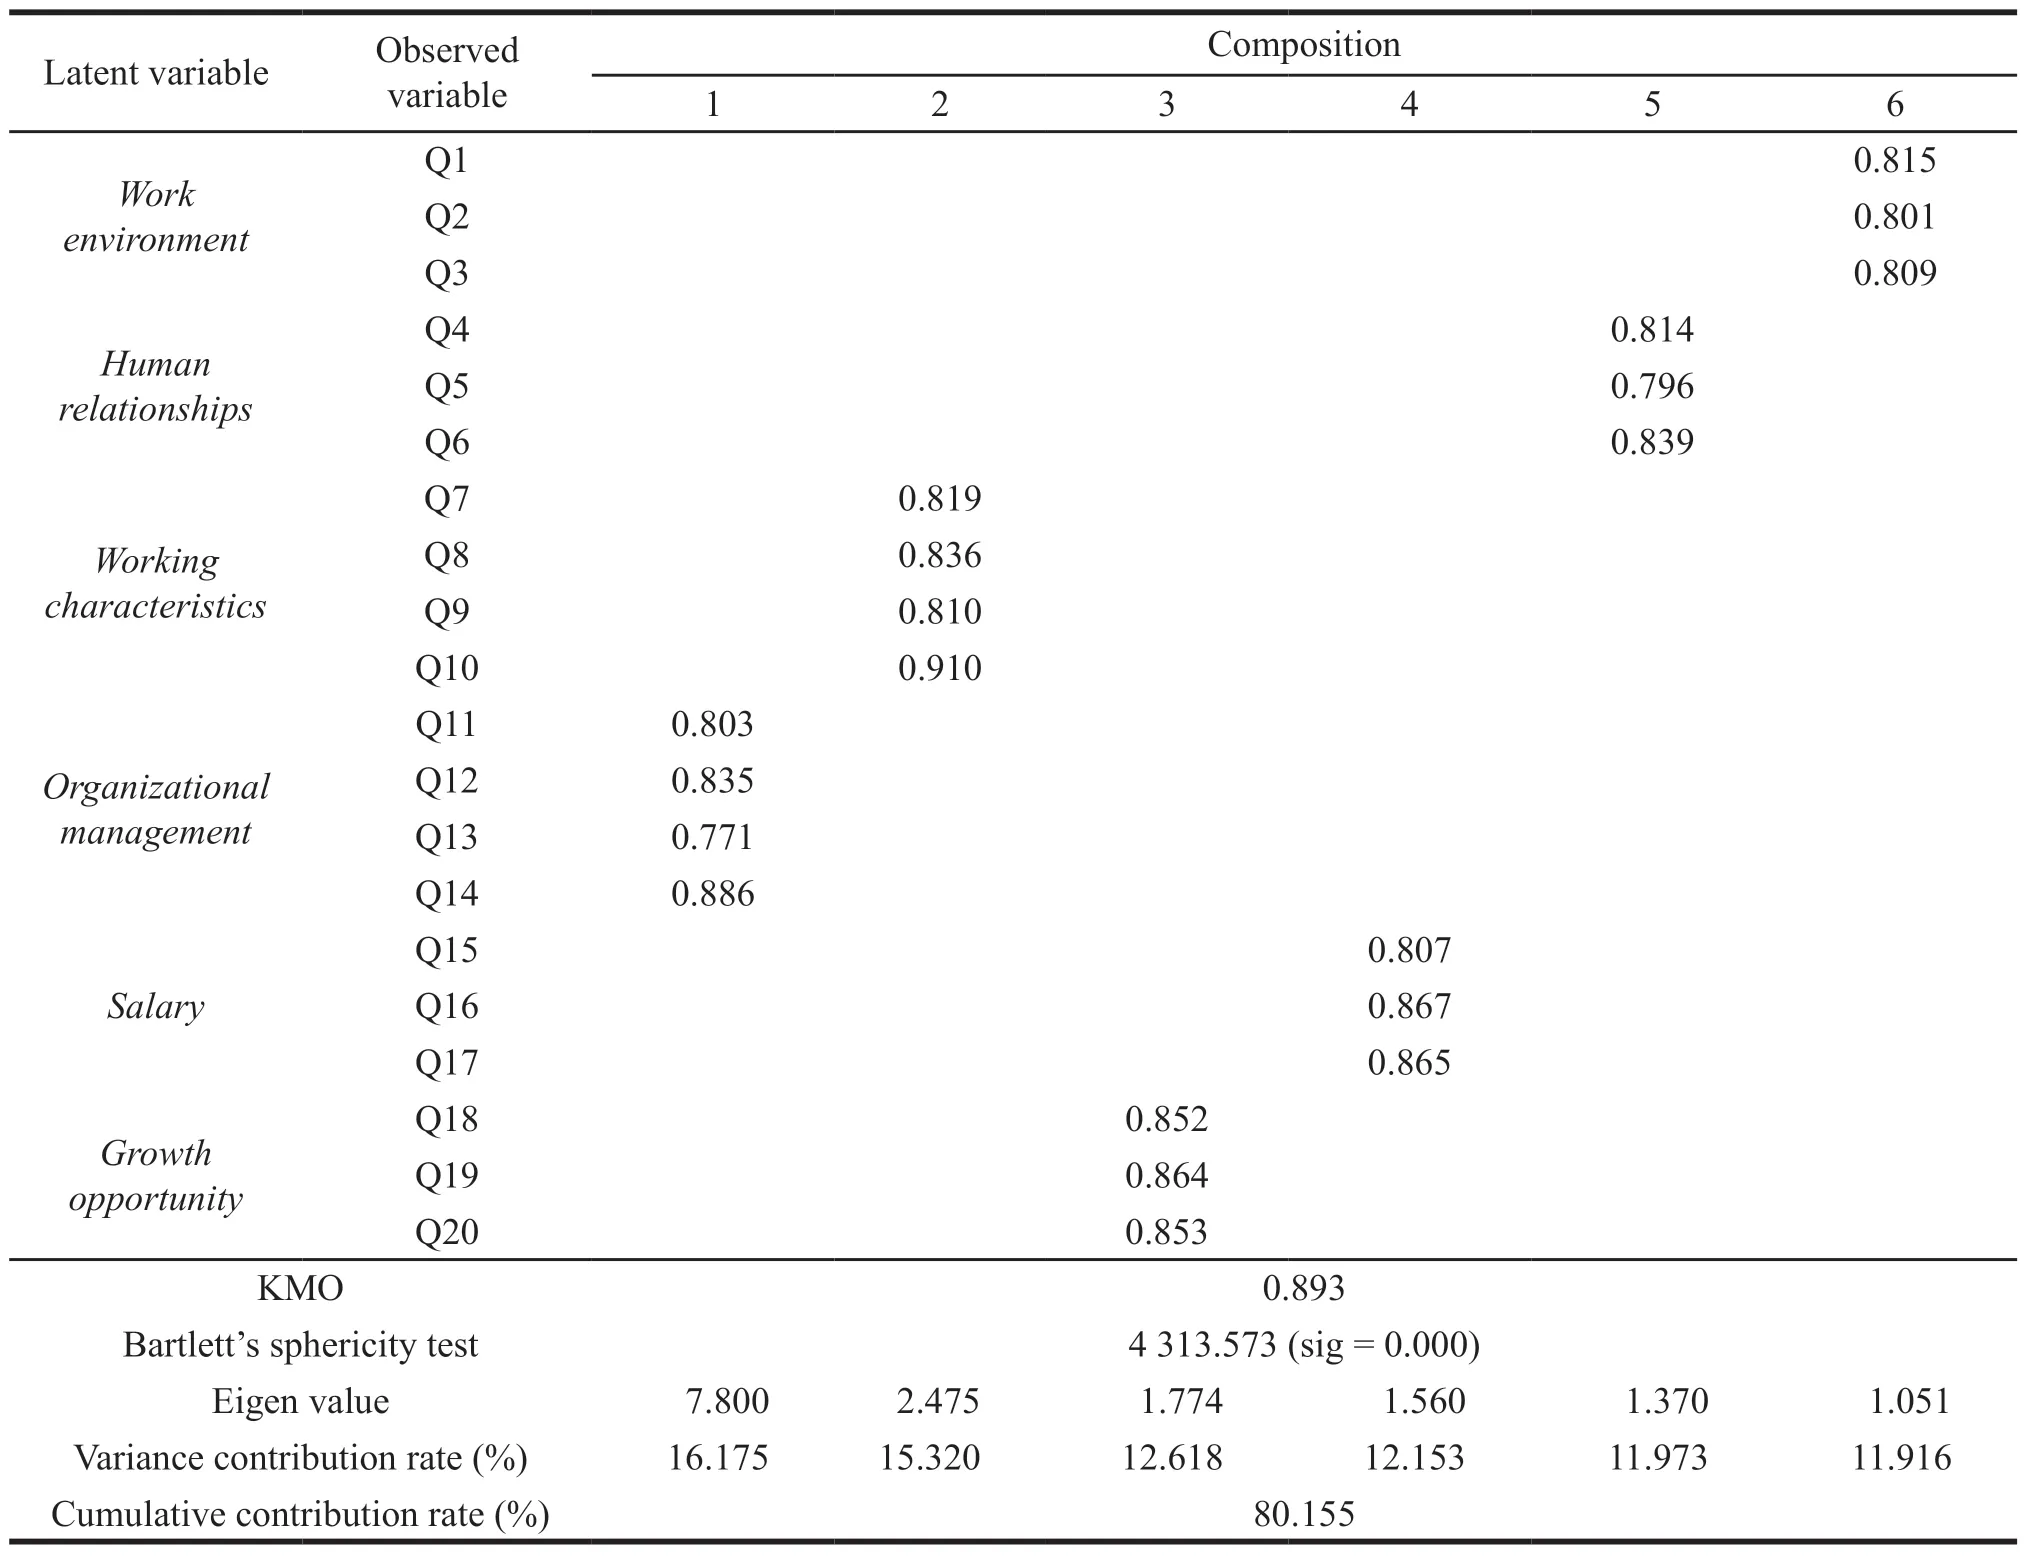
Table 4 Scale validity test
Confirmatory factor analysis is a statistical analysis of the survey data.This method is designed to test whether the relationship between a factor and the corresponding observational variable is consistent with the investigator’s theory.Swedish statisticians put forward the systematic theory and method of asserted factor analysis for the first time.The basic idea of this article is that researchers make assumptions and inferences based on theory and knowledge first,andthen a model of the relationship between a set of variables is constructed.The aim of this study is to test the consistency of theory with theoretical hypothesis data,and then it can ultimately develop into the theory[10].
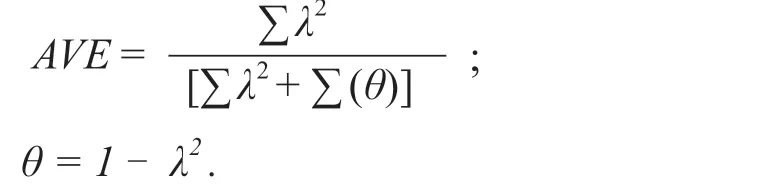
In this study,the convergence values and differential values for each potential variable are calculated by analyzing the confirmative factors.In general,the observed standard load is greater than 0.5,so the scale can be considered as good construction value.The combined reliability (CR) is also one of the measures of scale quality,reflecting whether all the observed variables can consistently explain the latent variable.In general,when the credibility of the CR is greater than 0.7,it suggests that all the observational variables for each latent variable can be consistently explained.The following formula consists of the normalization factor for each observed variableλand the measurement error for observed variableθ.
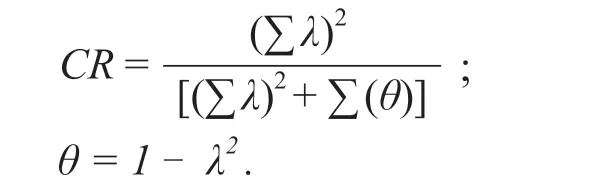
The mean error is extracted to measure the effective convergence and discriminative values of the hidden variables,which mainly explains that the degree of fluctuation of the hidden variables is caused by the measurement error.It is generally believed that the greater the extraction of the average deviation,the smaller the relative error.According to previous studies,the scale has good convergence validity if the extracted latent average error is greater than 0.5 and the square root of the extracted latent average error is greater than the correlation coefficient between latency and other latencies.This suggests that all observed variables for each potential variable can be explained consistently.The formula is shown in the following table,whereλis the standardized factor load of each observed variable and the measurement error of the observed variableθ[11].
Confirmatory factor analysis (CFA) of this scale is conducted by using AMOS21.0.The main evaluation indicators and criteria of the overall model adaptation degree were shown in Table 5,and the confirmatory factor model is established based on the results of exploratory factor analysis (Fig.1).The suitability of confirmatory factor model is judged by the model fitting index (Table 6).If it meets the standard,the model built in this paper can effectively measure relevant latent variables.

Table 5 Main evaluation indicators and criteria of the overall model adaptation degree
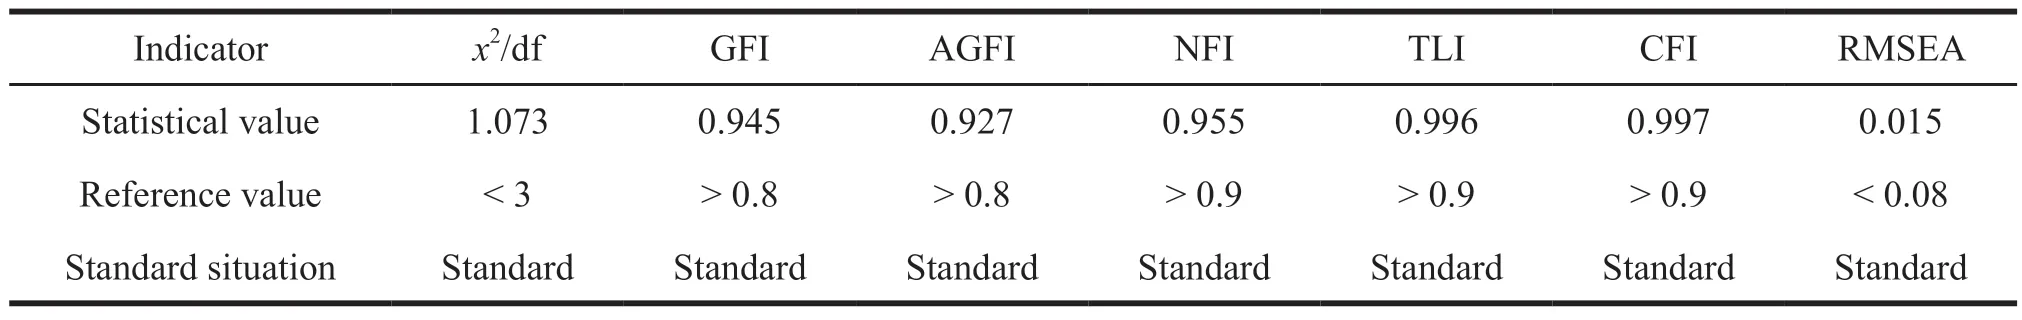
Table 6 Model fitting index

Fig.1 Valmatory factor model (standardization)
It can be seen from Table 6 that thex2/df is 1.073,less than 3,GFI is 0.945,greater than 0.8,AGFI is 0.955,greater than 0.8,NFI is 0.955,greater than 0.9,CFI and TFI are greater than 0.015 and less than 0.08.According to the standard of model fitting index,it meets all the requirements.
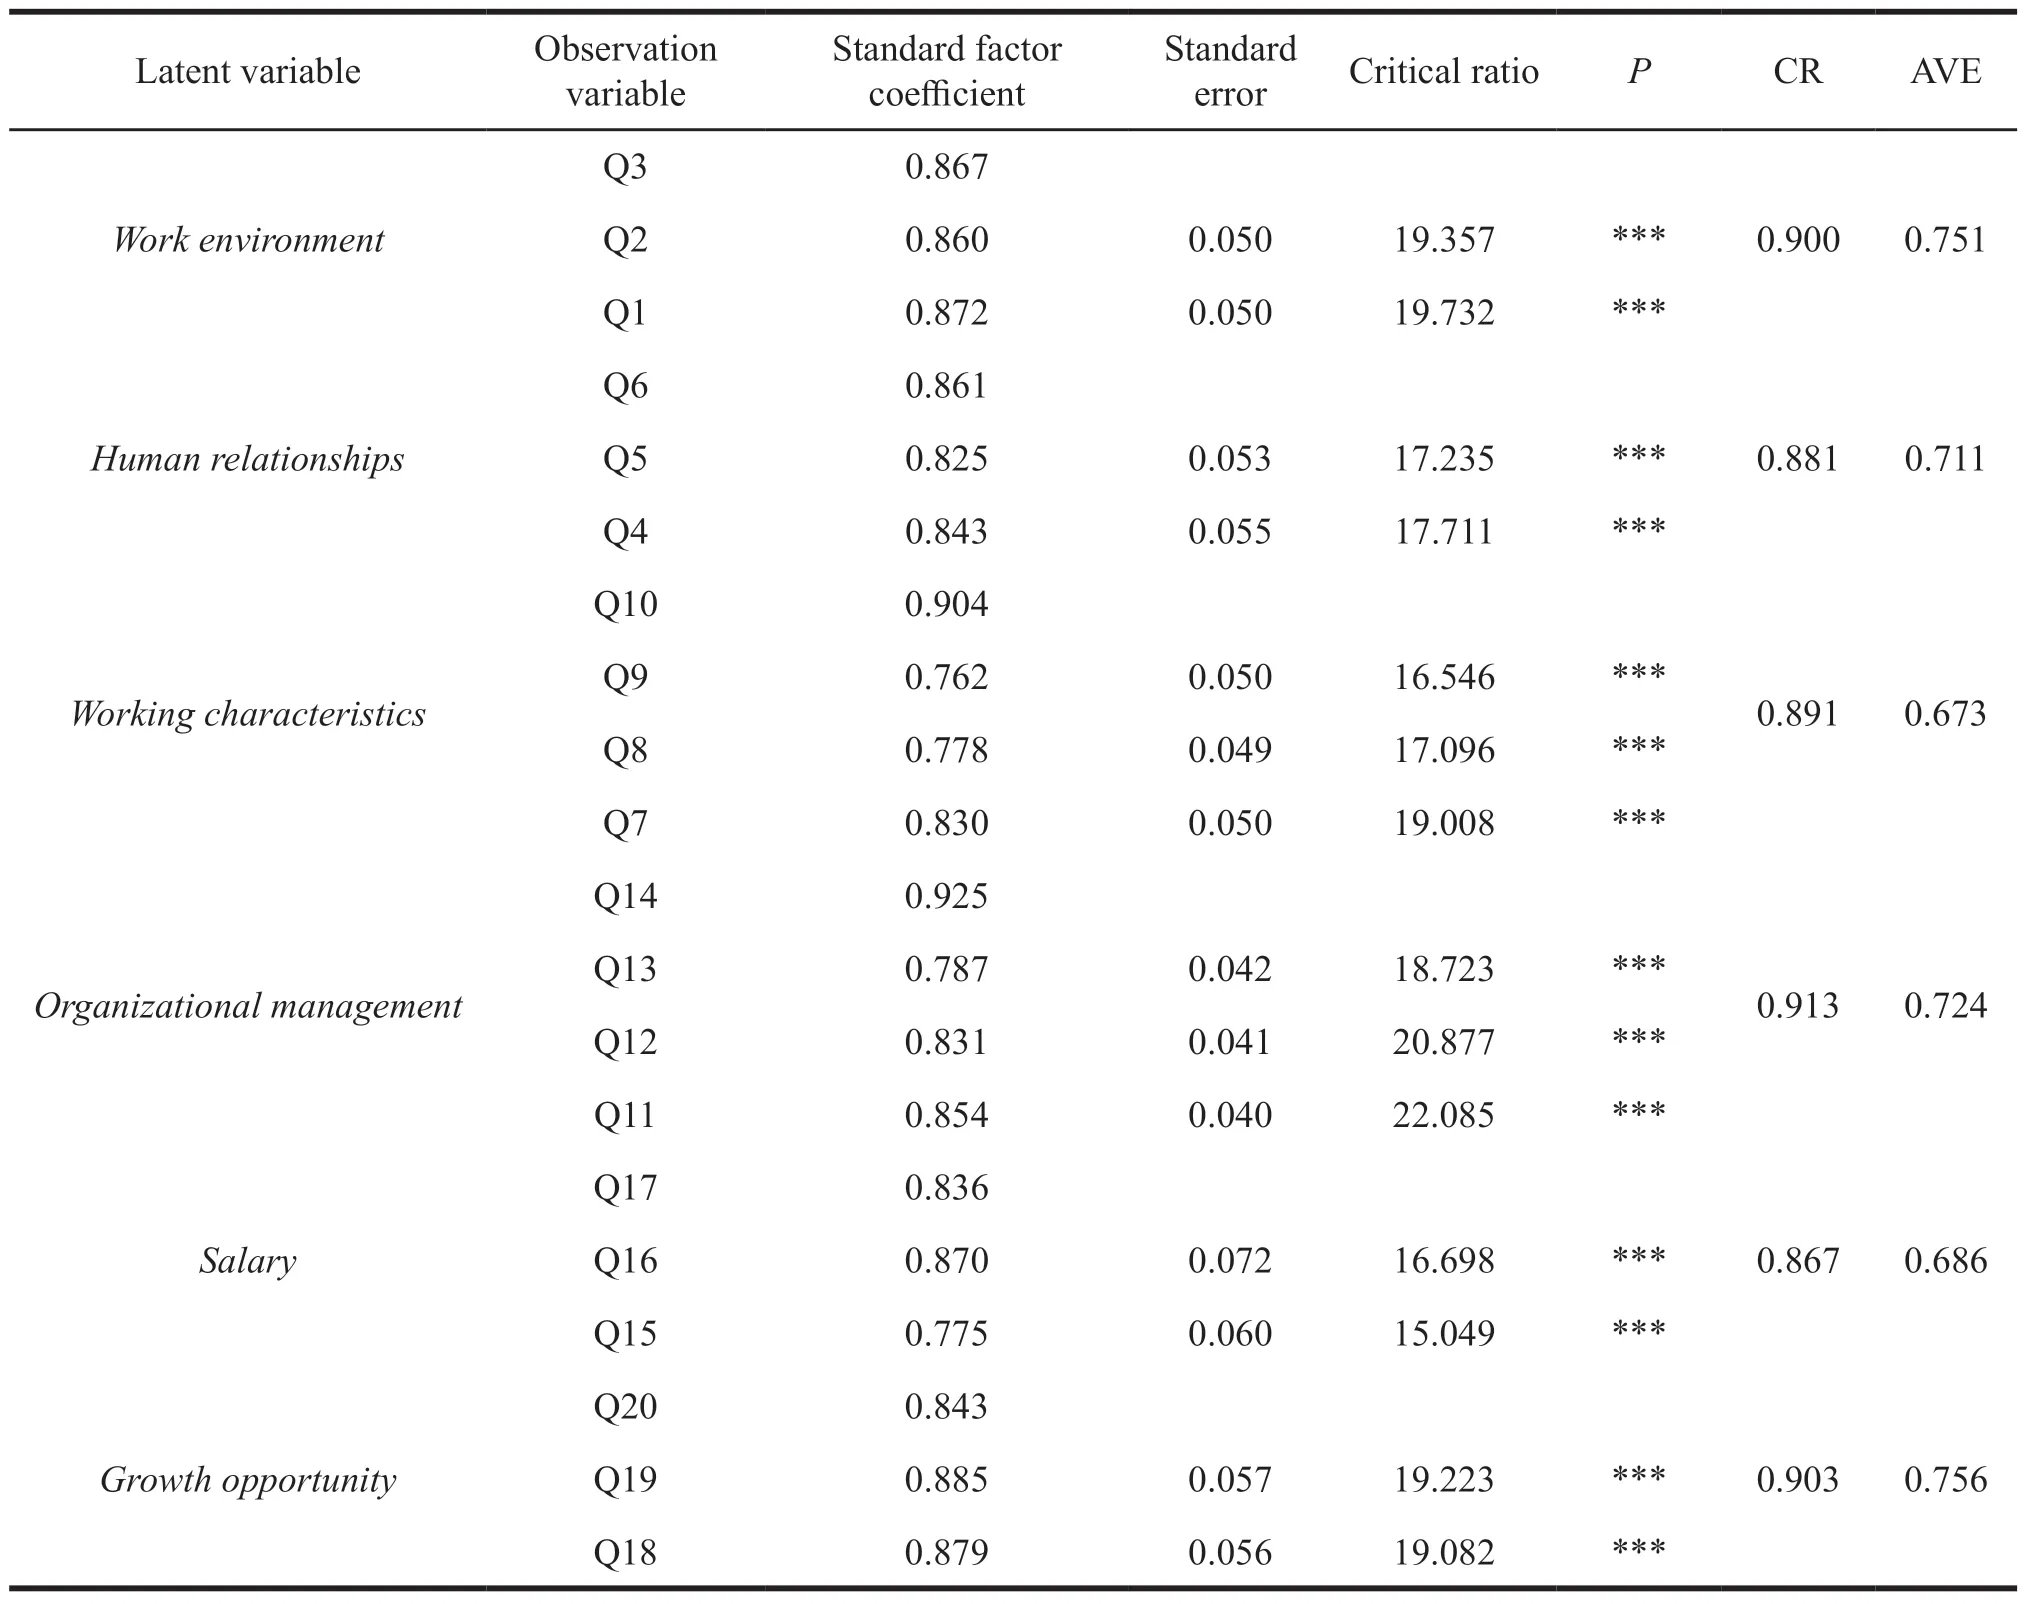
Table 7 Results of the convergence validity analysis
Continued Table 7
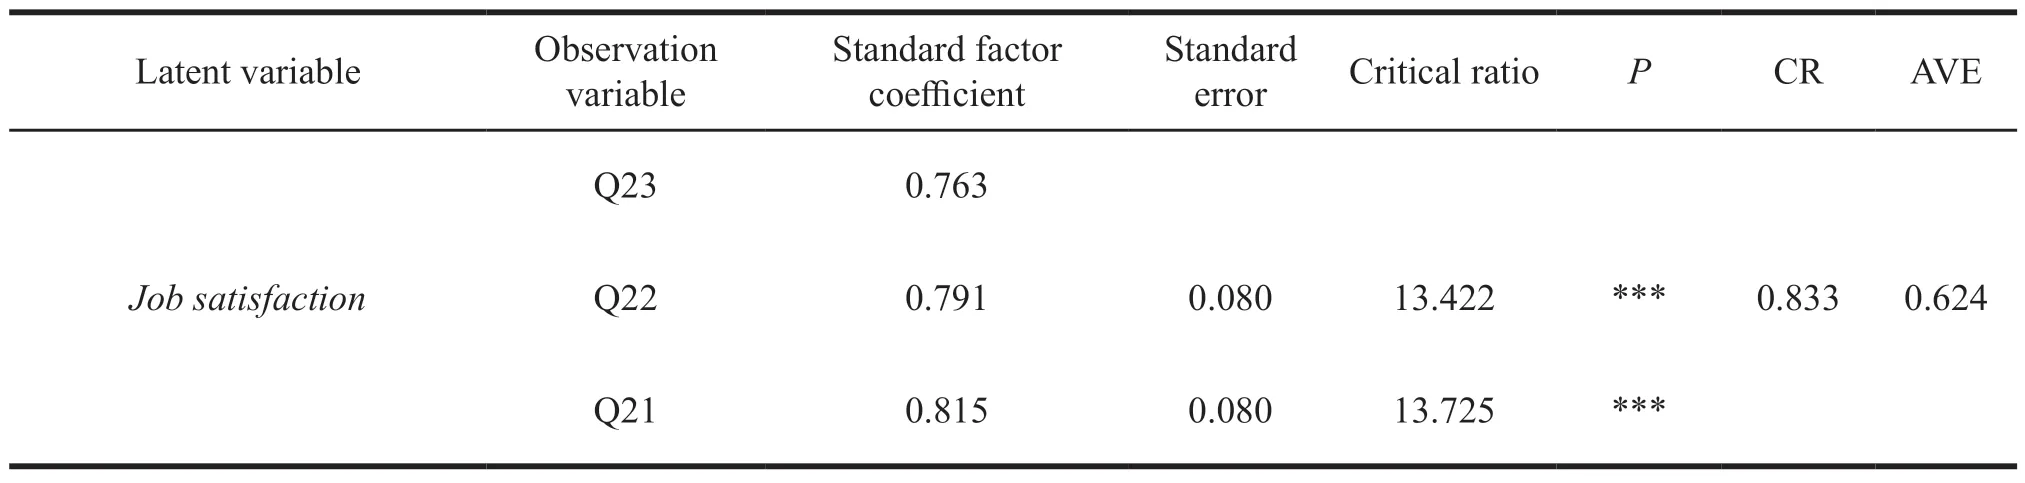
Convergence validity refers to how closely the new scale is related to other variables and other measures of the same construct.In this study,the convergence validity is tested by CR and mean average variance extracted (AVE).CR is usually greater than 0.7,and AVE is greater than 0.5,indicating it reaches the standard.
The observation variable,standard factor coefficient,CR,and AVE for each variable are shown in Table 7.The load value of each question factor is between 0.762-0.904,indicating that the convergence validity is high.The CR of each dimension is greater than 0.7,indicating it reaches the standard.The AVE is greater than 0.5,meaning it reaches the standard.And the significance probability isP< 0.001,indicating there is a significant relationship between the 7 latent variables and each measurement index variable,and the structural model of the convergence of the scale is good.

Table 8 Discrimination validity analysis test
According to Table 8,the AVE of each dimension is greater than 0.5,and the square root of the AVE is greater than the correlation coefficient between each dimension,so the scale has a good discrimination validity.
2.3 Model fitting test for structural equations
The main path results of the model are shown in Fig.2.According to the structural equation model adaptation test index,the ratio of chi-square freedom NC should be between 1-3.Residual sum of squares and the root square of RMSEA (residual mean square error of approximation) values should be between 0.05-0.08 (Table 9).If the value is below 0.05,indicating it is good.Adapter index GFI values are generally considered to be greater than 0.9,and it is acceptable if the value is above 0.8.Value-added adapter index CFI value shall be greater than 0.9.Non-standard quasi-adaptation index TLI value shall be above 0.9.It is generally believed that the sample number should be greater than 200.
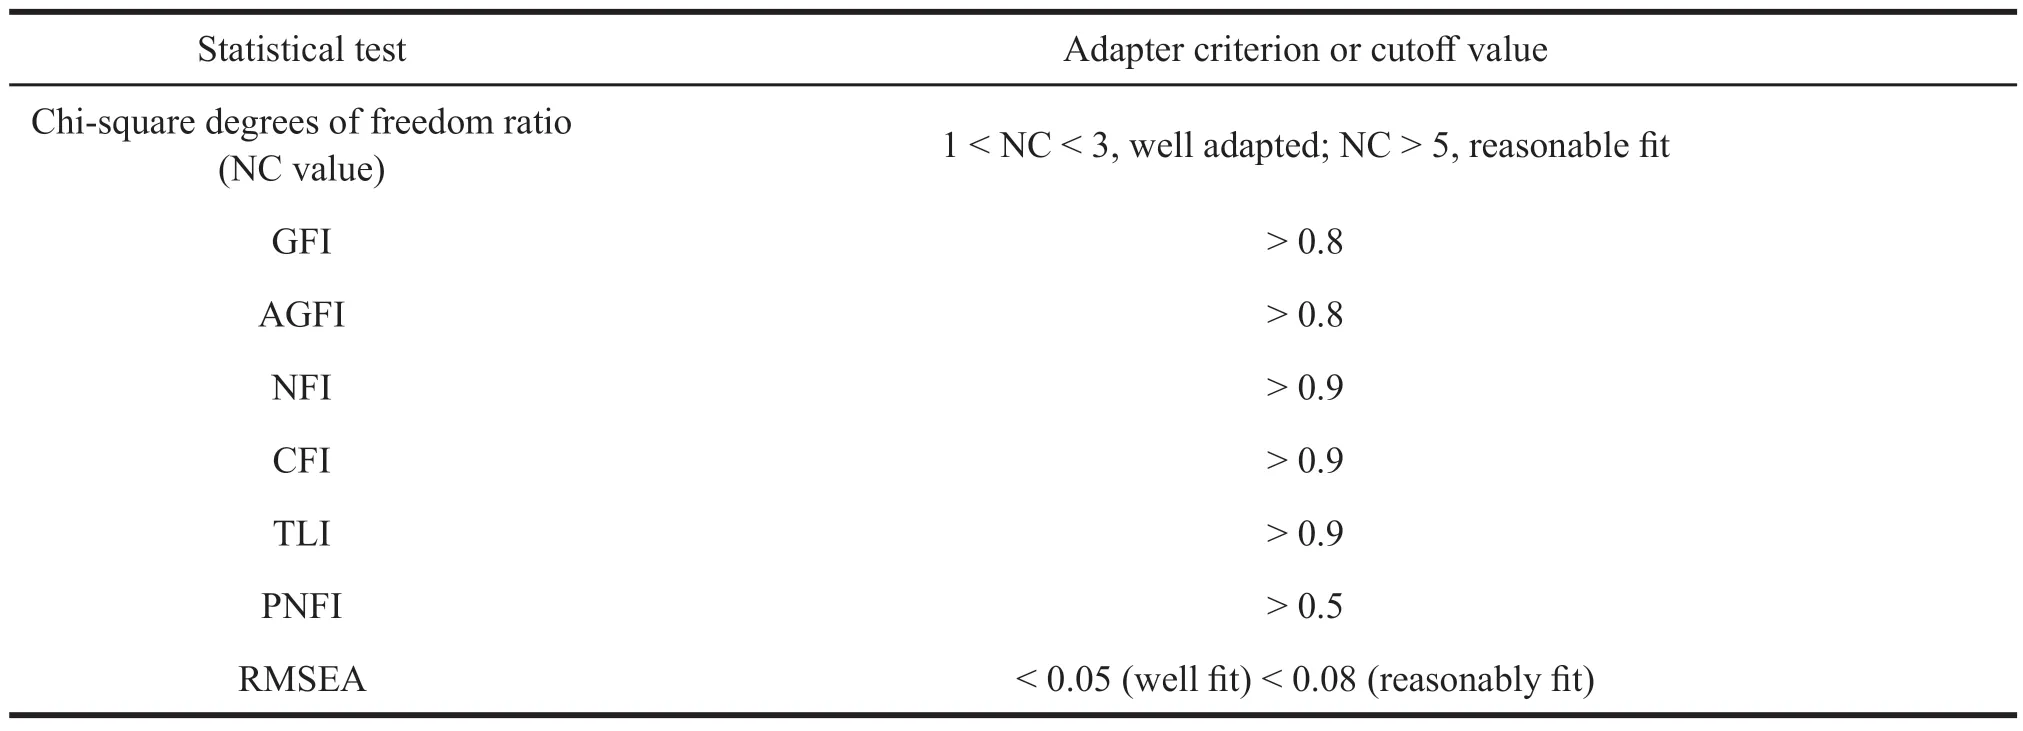
Table 9 Main evaluation indicators and criteria of the overall model adaptation degree
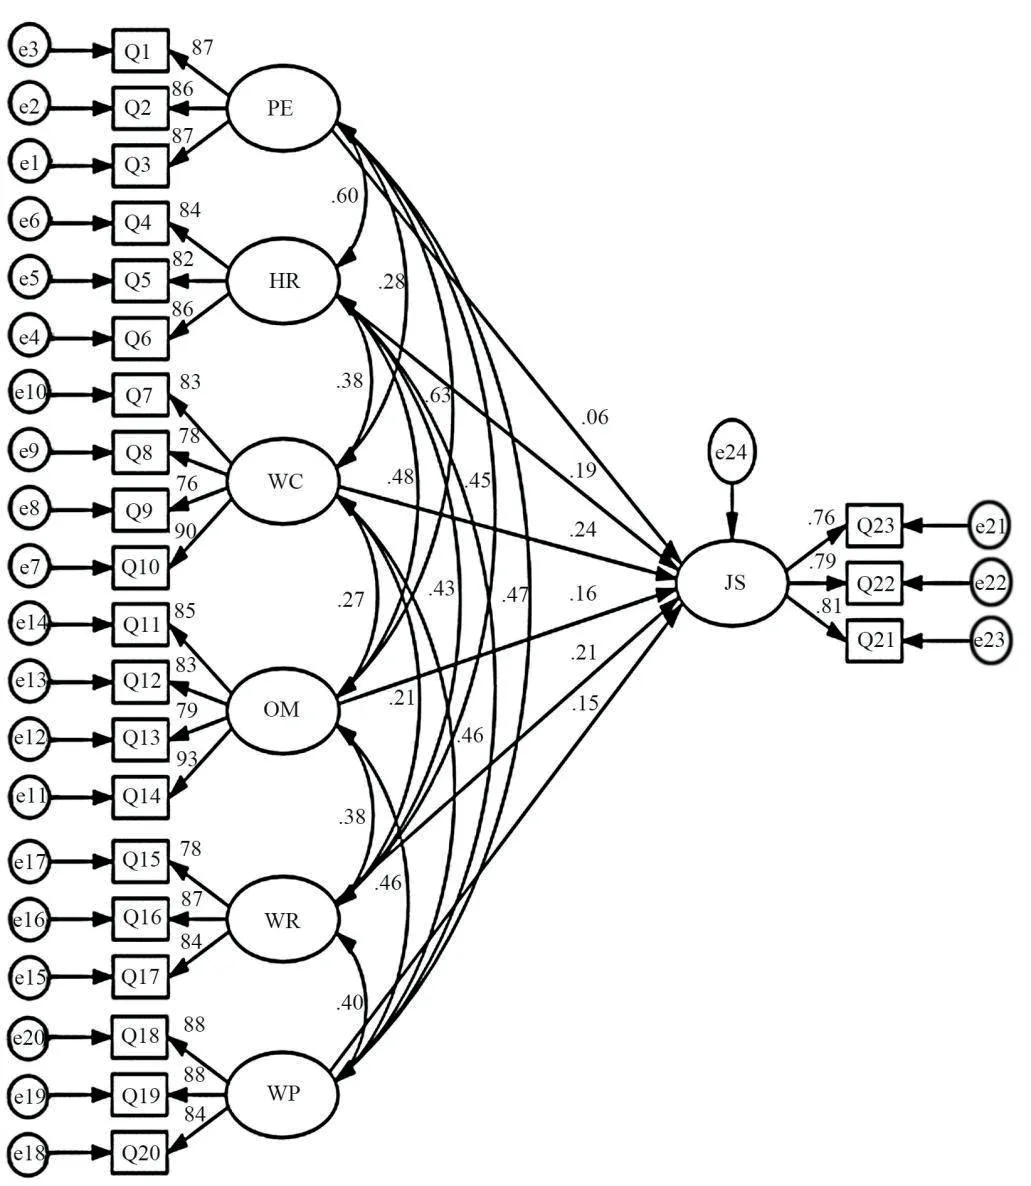
Fig.2 Results of structural equation model diagram (standardization)
The model operation is shown in Table 10:x²/df=1.073,which is less than 3.GFI=0.945,AGFI=0.927,and they are both greater than 0.8.NFI=0.955,TLI=0.996,CFI=0.997,and they are all greater than 0.9.RMSEA=0.015 means the fitting criteria meet the requirement,so the path of the model is analyzed.
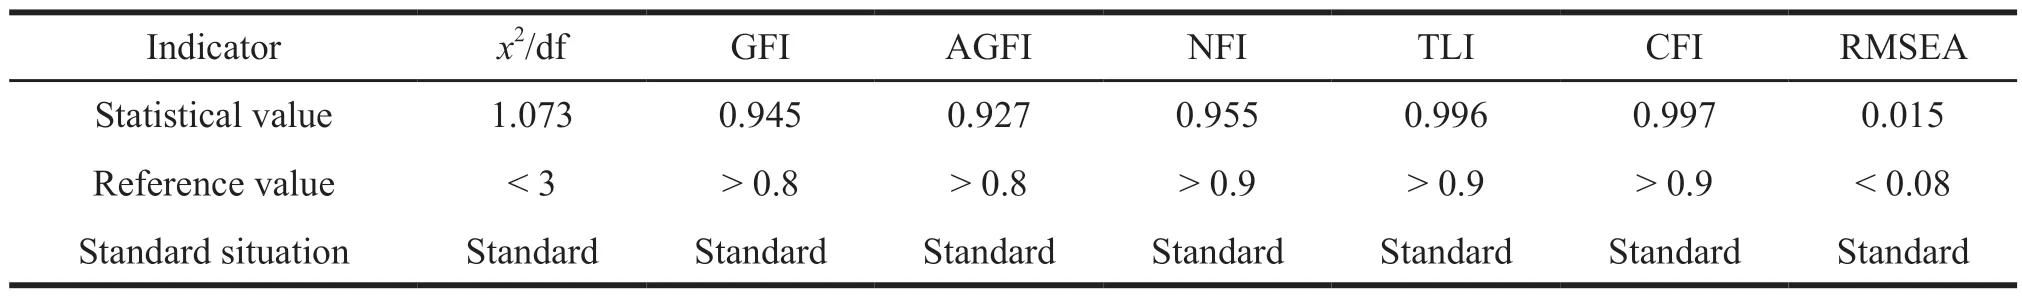
Table 10 Structural equation model fitting indicators
In this study,the Amos21.0 software is used to analyze the paths of the structural equation model to obtain the values of the path coefficient and the CR values of the structural equation model.The path coefficient reflects the influence and level between the variables.Critical value can assess whether the regression coefficient is significant.It is widely accepted that CR values should be greater than or equal to 1.96,suggesting there is a significant difference in the sense of 0.05.Regression normalization coefficients and error parameter estimation for the structural equation model is shown in Table 11[12].

Table 11 Tests of the path coefficient for the structural equation model

Table 12 Difference tests between the different genders in each variable
2.4 Relationship hypothesis test
(1) Hypothetical verification of the relationship between work environment and job satisfaction.
The path coefficient of the practice environment on work satisfaction is a 0.059,CR value is 0.741,and the corresponding significance isP=0.459 <0.05.Therefore,work environment has no significant positive impact on job satisfaction,so the assumption does not hold.
(2) Hypothetical verification of the relationship between interpersonal relationship and job satisfaction.
The path coefficient for job satisfaction is 0.186,CR value is 2.532,and the corresponding significance isP=0.011 < 0.05.Therefore,interpersonal relationship has a significant positive effect on job satisfaction,so the assumption holds.
(3) Hypothetical verification of the relationship between work characteristics and job satisfaction.
The path coefficient of job satisfaction is 0.245,CR value is 4.275,corresponding to significanceP=0.000 < 0.05.Therefore,the job characteristics have significant positive effects on job satisfaction,so the assumption holds.
(4) Hypothetical verification of the relationship between organizational management and job satisfaction.
The path coefficient of organizational management on job satisfaction is 0.160,and CR value is 2.304,corresponding to significanceP=0.021 < 0.05.Therefore,therefore,organizational management has a significant positive impact on job satisfaction,so the assumption holds.
(5) Hypothetical verification of the relationship between salary and job satisfaction.
The path coefficient of salary on job satisfaction is 0.214,CR value is 3.408,corresponding to the significanceP=0.000 < 0.05.So,salary has a significant positive effect on job satisfaction,so the assumption holds.
(6) Hypothetical verification of the relationship between growth opportunity and job satisfaction.
The path coefficient of the growth opportunity on the job satisfaction is 0.153,CR value is 2.397,and the corresponding significance isP=0.017 < 0.05,respectively.Therefore,the growth opportunity has a significant positive impact on job satisfaction,so the assumption holds.
2.5 t-test analysis
The procedure oft-test is to test the significance of the difference between two different means.Thet-test can be carried out when the variances of the two populations are equal.Thet-test value varies depending on the equal variance.That is,thet-test must be based on the results of equality of variances.
Therefore,SPSS is used to perform thet-test of the mean equation.Meanwhile,the Levene test of the variance equation should be made.In the column of the Levene test of the variance equation,if Sig is greater than 0.05,it indicates the equality of variance test has no significant difference.So,the results of thet-test below considers data assuming equal variance,i.e.,the results of thet-test in the case of homogeneity of variance.In thet-test of the mean equation,the Sig is less than 0.05.In the column of the Levene test of the variance equation,if the Sig is less than 0.05,indicating a significant difference in the homogeneity of variance test,that is,the uneven two variances (unequal variances),so the result table of the attachedt-test depends on the data assuming unequal variance,i.e.,the results of thet-test with uneven variance.In thet-test t of the mean equation,the Sig is less than 0.05.
The results oft-test analysis from Table 12 show that for men,the mean of working characteristics,organizational management and growth opportunity are 3.14,3.22,and 3.36,respectively.Meanwhile,for females,working characteristics,organizational management,and growth opportunity are 3.14,3.44,and 3.58,respectively.Therefore,there is no significant difference between men and women.When Sig > 0.05,there is no significant difference in working characteristics,organizational management and growth opportunity for both genders.

Table 13 Difference tests between marital status in each variable
For men,work environment,human relationships,salary and job satisfaction are 3.32,3.03,2.93,and 2.90,respectively,while the work environment,human relationships,salary,and job satisfaction of female are 3.74,3.51,3.42,and 3.47,respectively.So,the results show that there is a significant difference when the average value of men is lower than that of women.When Sig < 0.05,there is a significant difference in work environment,relationships,salary and job satisfaction for both genders.And women are higher than men.
As shown in Table 13,thet-test analysis results of the variables in different marriages show that the average values of unmarried people in work environment and human relationships are 3.84 and 3.63,respectively and married are 3.67 and 3.42,respectively.Therefore,there is no significant difference between the average values of unmarried and married.When Sig > 0.05,there is no significant difference in job,organizational management and growth opportunity for both genders.
The average values of unmarried in working characteristics,organizational management,salary,growth opportunity and job satisfaction are 3.51,3.82,3.60,3.87,and 3.64,respectively.The average values of married in working characteristics,organizational management,salary,growth opportunity and job satisfaction are 3.05,3.32,3.32,3.49,and 3.36,respectively.So,the results show there is a significant difference when the average values of unmarried is higher than that of married.When Sig < 0.05,there is a significant difference in working characteristics,organizational management,salary,growth opportunity,and job satisfaction for different marriage status,and unmarried is higher than married.
2.6 One-way ANOVA
One-way ANOVA is used for the comparison between multiple samples.Its statistical inference can judge whether the average value of each sample is equal.
Through one-way ANOVA,the differences in work environment,human relationships,working characteristics,organizational management,salary,growth opportunity and job satisfaction of different ages are tested,as shown in Table 14.Therefore,there are no significant differences in work environment and growth opportunity of the research subjects of different ages (P> 0.05).
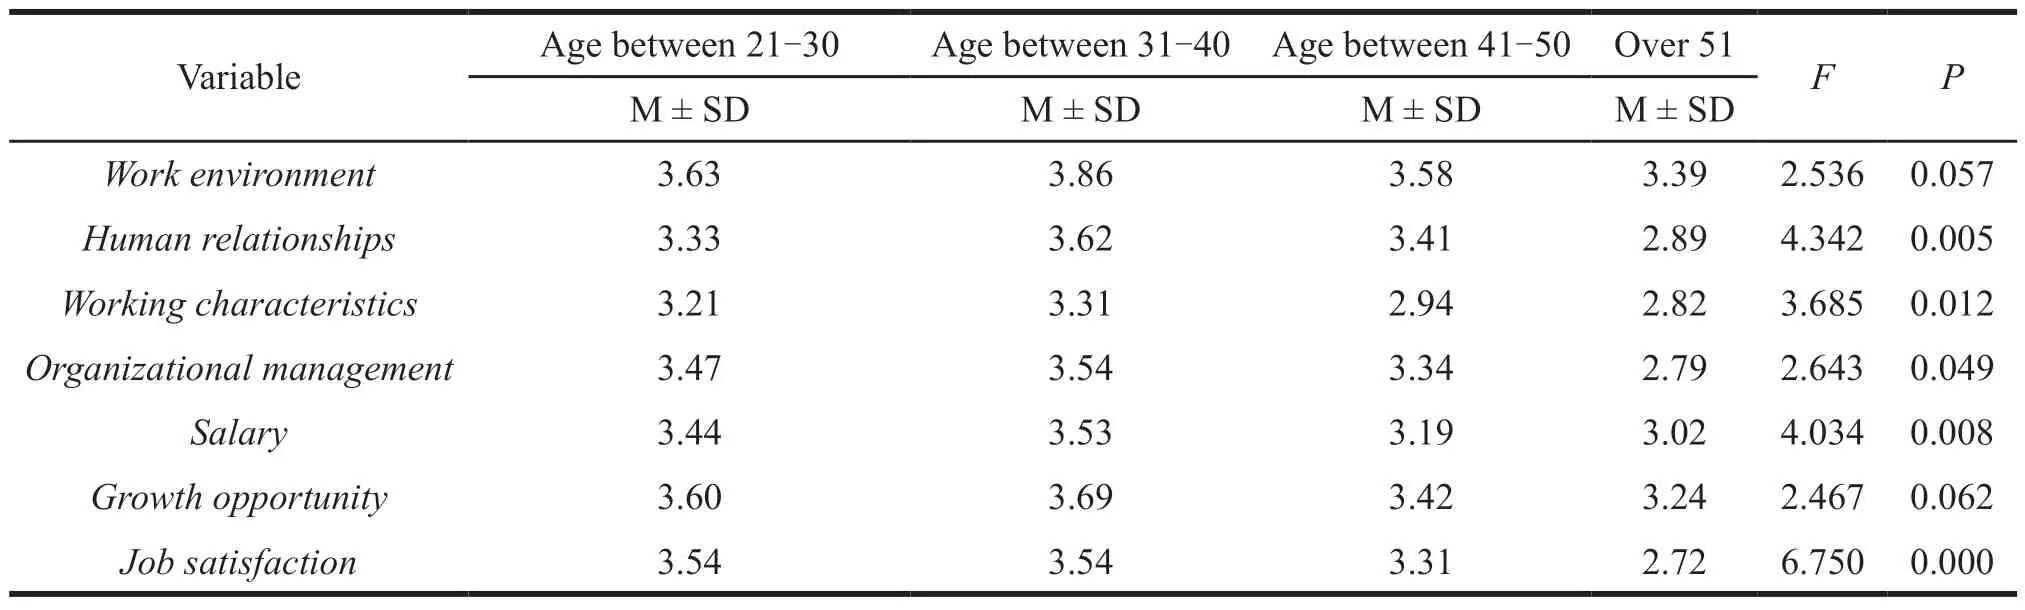
Table 14 Difference tests for different ages at each variable
Ages surveyed differ significantly in human relationships,working characteristics,organizational management,salary,and job satisfaction (P< 0.05).The average values show they have the strongest effect on the age group of 31-40.
Through one-way ANOVA,the differences in work environment,human relationships,working characteristics,organizational management,salary,growth opportunity and job satisfaction of the research subjects with various degrees are tested,as shown in Table 15.Therefore,there are no significant differences in work characteristics and salary between subjects (P> 0.05).
However,there are significant differences in work environment,human relationships,organizational management,growth opportunity and job satisfaction for subjects with various degrees (P<0.05).From the average values,the lower the degree,the strongest impact.
Through one-way ANOVA,the results of the research subjects with different working years in work environment,human relationships,working characteristics,organizational management,salary,growth opportunity and job satisfaction are obtained,as shown in Table 16.Therefore,there are no significant differences between human relationships,salary and growth opportunity for different working years (P>0.05).
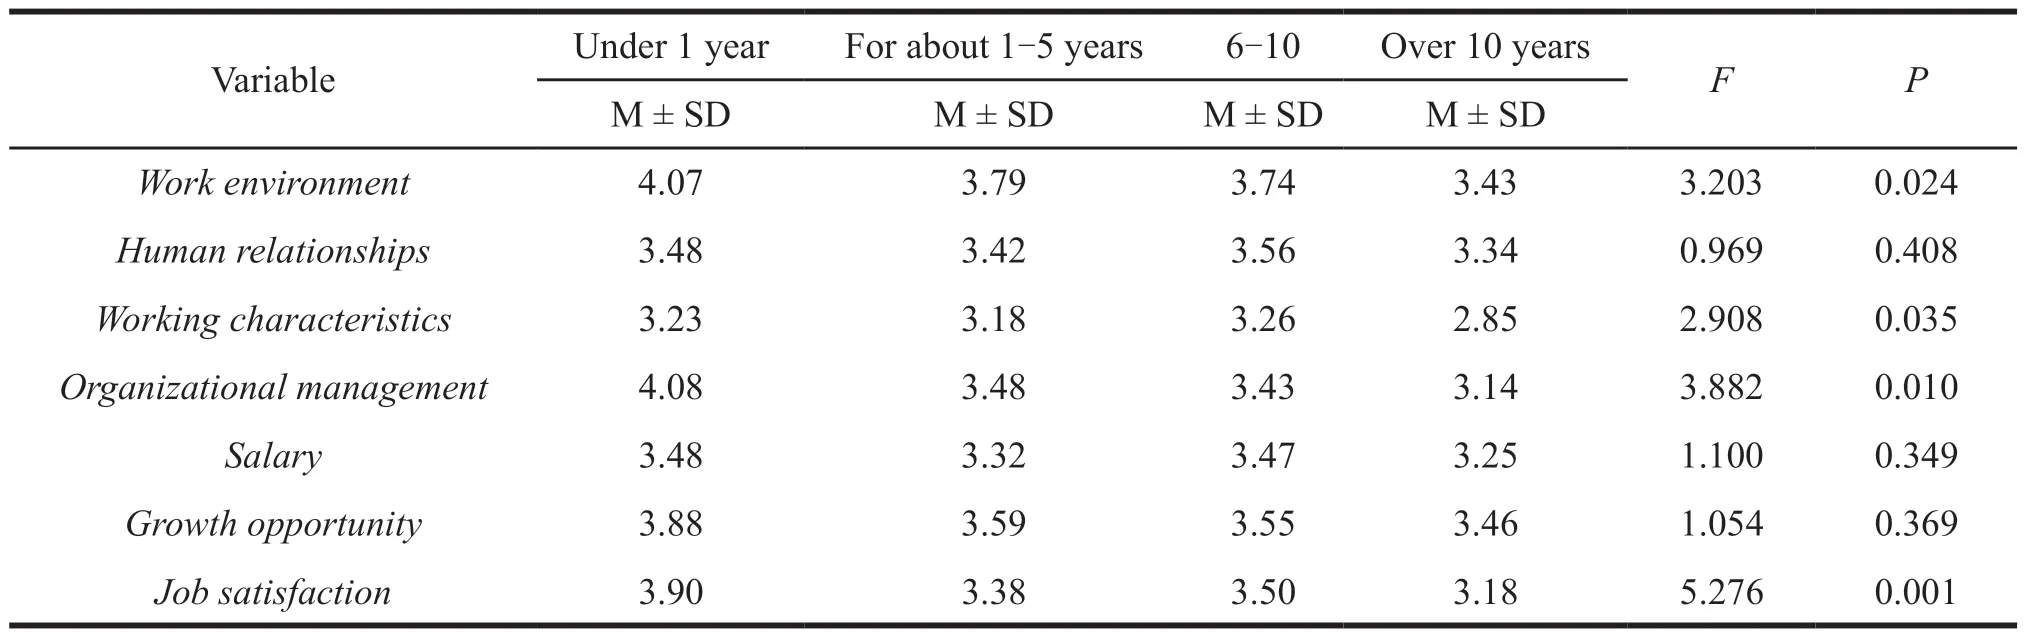
Table 16 Tests of different working years
There are significant differences for research subjects with different working years in work environment,working characteristics,organizational management and job satisfaction (P< 0.05).The average values show that the shorter the working life,the stronger the effect.
3 Factors and suggestions affecting job satisfaction of licensed pharmacists in retail pharmacies
3.1 Related factors affecting job satisfaction of licensed pharmacists
According to the survey data,on the whole,licensed pharmacists in R retail pharmacy are satisfied with their work.However,men who are over 51 years old and married with high education and over 10 years working experience have lower satisfaction.This paper analyzes six key factors related to job satisfaction of licensed pharmacists in R retail pharmacy,including working characteristics,salary,human relationships,organizational management and growth opportunity.
3.2 Suggestions to improve job satisfaction of licensed pharmacists
The working characteristics have the greatest impact on job satisfaction of licensed pharmacists.As the most critical professional of the drugstore,their work features indicate that they have great responsibility.Due to job requirement,licensed pharmacists have the average daily working time of more than 10 hours,resulting in irregular work and rest,which eventually leads to a reduction in their job satisfaction.In view of this situation,managers should take some measures,such as reducing their workload,standardizing the work system,strengthening licensed pharmacists professional skills and improving work efficiency.Besides,these pharmacies can take advantages of modern technology to relieve work pressure of pharmacists[9].
The second factor that influences job satisfaction of licensed pharmacists is salary.Low salary is not conducive to the enthusiasm of licensed pharmacists in their work.The small increase in salary can easily lead to psychological imbalance and make pharmacists feel depressed.In the long term,this will reduce job satisfaction of licensed pharmacists and eventually lead to talent loss.According to Maslow’s theory,licensed pharmacists cannot devote themselves to self-realization without meeting their high-level needs.Therefore,when formulating the compensation standards,pharmacies need to reasonably allocate the remuneration of licensed pharmacists,appropriately improve the income to mobilize the enthusiasm of employees,so as to enhance the competitiveness of retail pharmacies.
Human relationships are an important factor in job satisfaction.Harmonious human relationship can effectively improve licensed pharmacists’ ability to serve consumers,which can also stimulate them to establish a good professional image to improve their job satisfaction and ensure the high quality of pharmaceutical service.Poor relationships will not only bring different degrees of psychological trauma to licensed pharmacists,but also reduce their work efficiency.In this study,we find that men and over 51 years old licensed pharmacists have the lowest satisfaction with human relationship.Although the proportion is small,managers still need to pay attention to it.By organizing regular activities,they can increase the communication between internal members and improve team building.Besides,training licensed pharmacists on communication skills with customers can create a good working atmosphere.
Organizational management also affects job satisfaction of licensed pharmacists.Driven by the new medical reform,many retail pharmacies get rid of the previous performance management model dominated by economic benefits and turn to the pharmaceutical service-based business model.Licensed pharmacists are the main force of the pharmacy team to directly provide pharmaceutical services for consumers.Therefore,managers should pay attention to the important group of ideological dynamics under the new situation,grasp their demand,and establish a set of corresponding incentive mechanism.While giving full play to their enthusiasm,licensed pharmacists can realize their professional development and increase both pharmacy economic and social benefit[13].
Growth opportunity is also one of the factors affecting job satisfaction of licensed pharmacists.Licensed pharmacists,as the backbone of retail pharmacies,can play a mainstay role in the future development of pharmacies.According to the survey,the highly educated licensed pharmacists in R retail pharmacy have low job satisfaction,and most of them are women.With the national introduction of the second and third child policies,women are facing such problems as marriage,childbirth,and career development.They have concerns about their growth opportunity.Therefore,managers in retail pharmacies should take this factor into consideration.By supporting continuing education,organizing regular vocational skills training,constantly improving the comprehensive quality of licensed pharmacists,they can realize self-value.At the same time,smooth promotion channels can also encourage licensed pharmacists to be full of confidence in their work.
3.3 Deficiencies of this study
This study has some deficiencies due to the size of samples and time limit.Since the economic development in China is uneven,there are also differences in job satisfaction of licensed pharmacists in different regions.Samples are from the R retail pharmacy,making the sample survey results unfit for all the retail pharmacies in other regions.The corresponding suggestions are from the perspective of drugstore managers and individual licensed pharmacists,which are not involved in the government and the public.In the future research,we should carry out extensive horizontal and longitudinal investigation,combined the new medical reform policies and the COVID-19 pandemic with the management of licensed pharmacists,thus studying the changes of job satisfaction in retail pharmacies.
杂志排行
亚洲社会药学杂志的其它文章
- Information for Authors
- Reflections on the Participation of Social Organizations in the Prevention of COVlD-19
- Current Situation and Suggestions on the Development of Diagnosis Related Group (DRG) Policy in China
- A Systematic Review of Economic Evaluation of CDK4/6 Inhibitors in HR+/HER2-Advanced Breast Cancer
- Economic Evaluation of Gastroscopy for Detecting Gastric Cancer in Chinese Natural Population
- Research on the Extraction Techniques of Ginseng Based on Patent Analysis