Attosecond spectroscopy for filming the ultrafast movies of atoms,molecules and solids
2022-12-28LixinHe何立新XiaosongZhu祝晓松WeiCao曹伟PengfeiLan兰鹏飞andPeixiangLu陆培祥
Lixin He(何立新) Xiaosong Zhu(祝晓松) Wei Cao(曹伟)Pengfei Lan(兰鹏飞) and Peixiang Lu(陆培祥)
1Wuhan National Laboratory for Optoelectronics and School of Physics,Huazhong University of Science and Technology,Wuhan 430074,China
2Optical Valley Laboratory,Hubei 430074,China
Keywords: strong-field physics,attosecond science,high harmonic generation,ultrafast spectroscopy
1. Introduction
The past three decades have witnessed both the growth ofChinese Physics B,dating back toActa Physica Sinica(Overseas Edition)since 1992, and that of the attosecond science.The latter springs up since the discovery of a highly nonlinear phenomenon well known as the high harmonic generation(HHG)in the late 1980s,[1,2]which occurs when gaseous atom and molecules are irradiated by intense laser with electric field comparable to the Coulomb field of the atomic and molecular core on the outmost electron. A follow-up key milestone is the proposal of the semiclassical rescattering model –also known as the three-step model involving the ionization,acceleration in the continuum and rescattering to the parent core of an active electron in the strong driving field.[3,4]This picture not only well explains the non-pertubative features of HHG,for example the plateau structure and the cutoff of the high harmonic spectrum, but also implies an unique coherent selfprobing of the core by the ionized electron from the same core.The self-probing method promises an unprecedented combined attosecond temporal and Angstrom spatial resolution,and it also manifests itself in various other strong-field phenomena besides HHG including high-order above-threshold ionization, nonsequential double ionization, etc. Ultrafast spectral techniques such as high harmonic spectroscopy,laser induced electron diffraction,and photoelectron holography are developed ever since, greatly booming the field attosecond science. In this review, however, we focus on the applications based on HHG. For other topics, we refer readers to Refs. [5–7]. Another direct application of HHG is the production of attosecond light source. The first ultrashort laser pulse breaking through the attosecond barrier was produced in 2001 in the form of either attosecond pulse chain[8]or isolated attosecond pulse (IAP)[9]–this is the third milestone of attosecond science. The attoscond pulses serve as an powerful tool to observe ultrafast dynamics in the sub-femtosecond time scale,via a pump–probe scheme.
The rest of the paper is organized as follows: We first review the progress of works aiming at producing short and strong attosecond pulses as well as extending the spectral range to the soft x-ray range in Section 2. In Section 3,spectroscopy techniques making use of the attosecond pulses via the pump–probe scheme are introduced. Typical high harmonic spectroscopy methods based on the self-probing scheme,enabling people imaging molecular orbitals and filming ultrafast molecular dynamics,are introduced in Section 4.Finally,we conclude in Section 5.
2. Attosecond pulse generation
To image or film an ultrafast movement, for example a bullet going through an apple, a shutter with shorter time scale than the interested event is necessary. Deep into the microscopic world, the movements of atoms and molecules are much faster than a bullet. The ultrafast shutter can be realized by ultrafast laser pulses. In chemical reactions,typical molecular processes are in the femtosecond time scale. Zewail and colleagues made it possible to view the ultrafast processes utilizing laser pulses just tens of femtoseconds in duration. This new technology enables people to better understand chemical reactions and, on the other hand, to gain more control over the chemical reaction. Nowadays, the developed technology called the femtosecond spectroscopy has been applied all over the world by scientists over various of communities such as physics,chemistry,biology,life science,etc.
To gain a deeper insight into the microscopic world, it is necessary to detect the motion of electrons, which is typically in the attosecond time scale. For instance, the time period of an electron in the first Bohr orbit of hydrogen is about 152 as. Thus,even shorter pulses with attosecond duration are required. Up to now, the most promising way to produce attosecond pulses is based on HHG,as it provides an broadband coherent emission in the spectral domain naturally supporting extremely short emission in the temporal domain.
2.1. Approaching to the short duration
The break through into the attosecond scale was achieved in 2001.[8,9]Paulet al.[8]obtained ultrashort pulses with full width at half maximum (FWHM) of 250 based on the HHG from argon gas irradiated by an 800-nm Ti:sapphire laser. Since the pulse duration of the driving laser is 40 fs,namely,the driving pulse contains a number of optical cycles,a train of the 250-as pulses is produced. To obtain an IAP requires breaking the periodicity of the driving process. In the same year,Hentschelet al.[9]produced IAP with duration 650±150 as, utilizing a 7-fs few-cycle driving laser. Three years later, 250-as IAP was produced with a 5-fs few-cycle driver with stabilized carrier-envelope phase(CEP).[10]
Apart from utilizing few-cycle drivers to break the timeperiodicity in HHG, a variety of other methods have been proposed, known as the ionization gating,[11]polarization gating,[12–14]two-color gating,[15–17](generalized)double optical gating,[18–20]etc. With these new ideas,the record of the shortest pulse is constantly refreshed, see Fig. 1 and Table 1.In 2006, Sansoneet al.[21]combined the idea of polarization gating with the use of a 5-fs CEP-stabilized few-cycle driving laser and produced 130-as IAP.Breaking through the sub-100-as barrier came in 2008. Goulielmakiset al.[22]generated 80-as IAP with a 720-nm,3.3-fs(nearly single-cycle)driving pulse. In 2012, Zhaoet al.[23]produced 67-as IAP based on the double optical gating technique. In their work, the high harmonic radiation was tailored by utilizing the phase mismatch to remove the the high-energy part spectrum with unfavorable chirp,allowing the positive attochirp of the remaining spectrum to be compensated by the negative dispersion of a zirconium foil.
In the above-mentioned works,near-infrared fundamental driving pulses from Ti:sapphire laser were employed. Shorter pulse duration in the temporal domain is promised when broader high harmonic spectrum can be obtained. This can be achieved by using drivers with long wavelength according to the cutoff law of HHG.[3,4]With two-cycle 1.8-µm midinfrared (MIR) driving lasers, Liet al.[24]and Gaumnitzet al.[25]generated 53-as and 43-as IAPs in 2017, respectively.These shortest records are approaching the atomic unit of time(∼24 as).
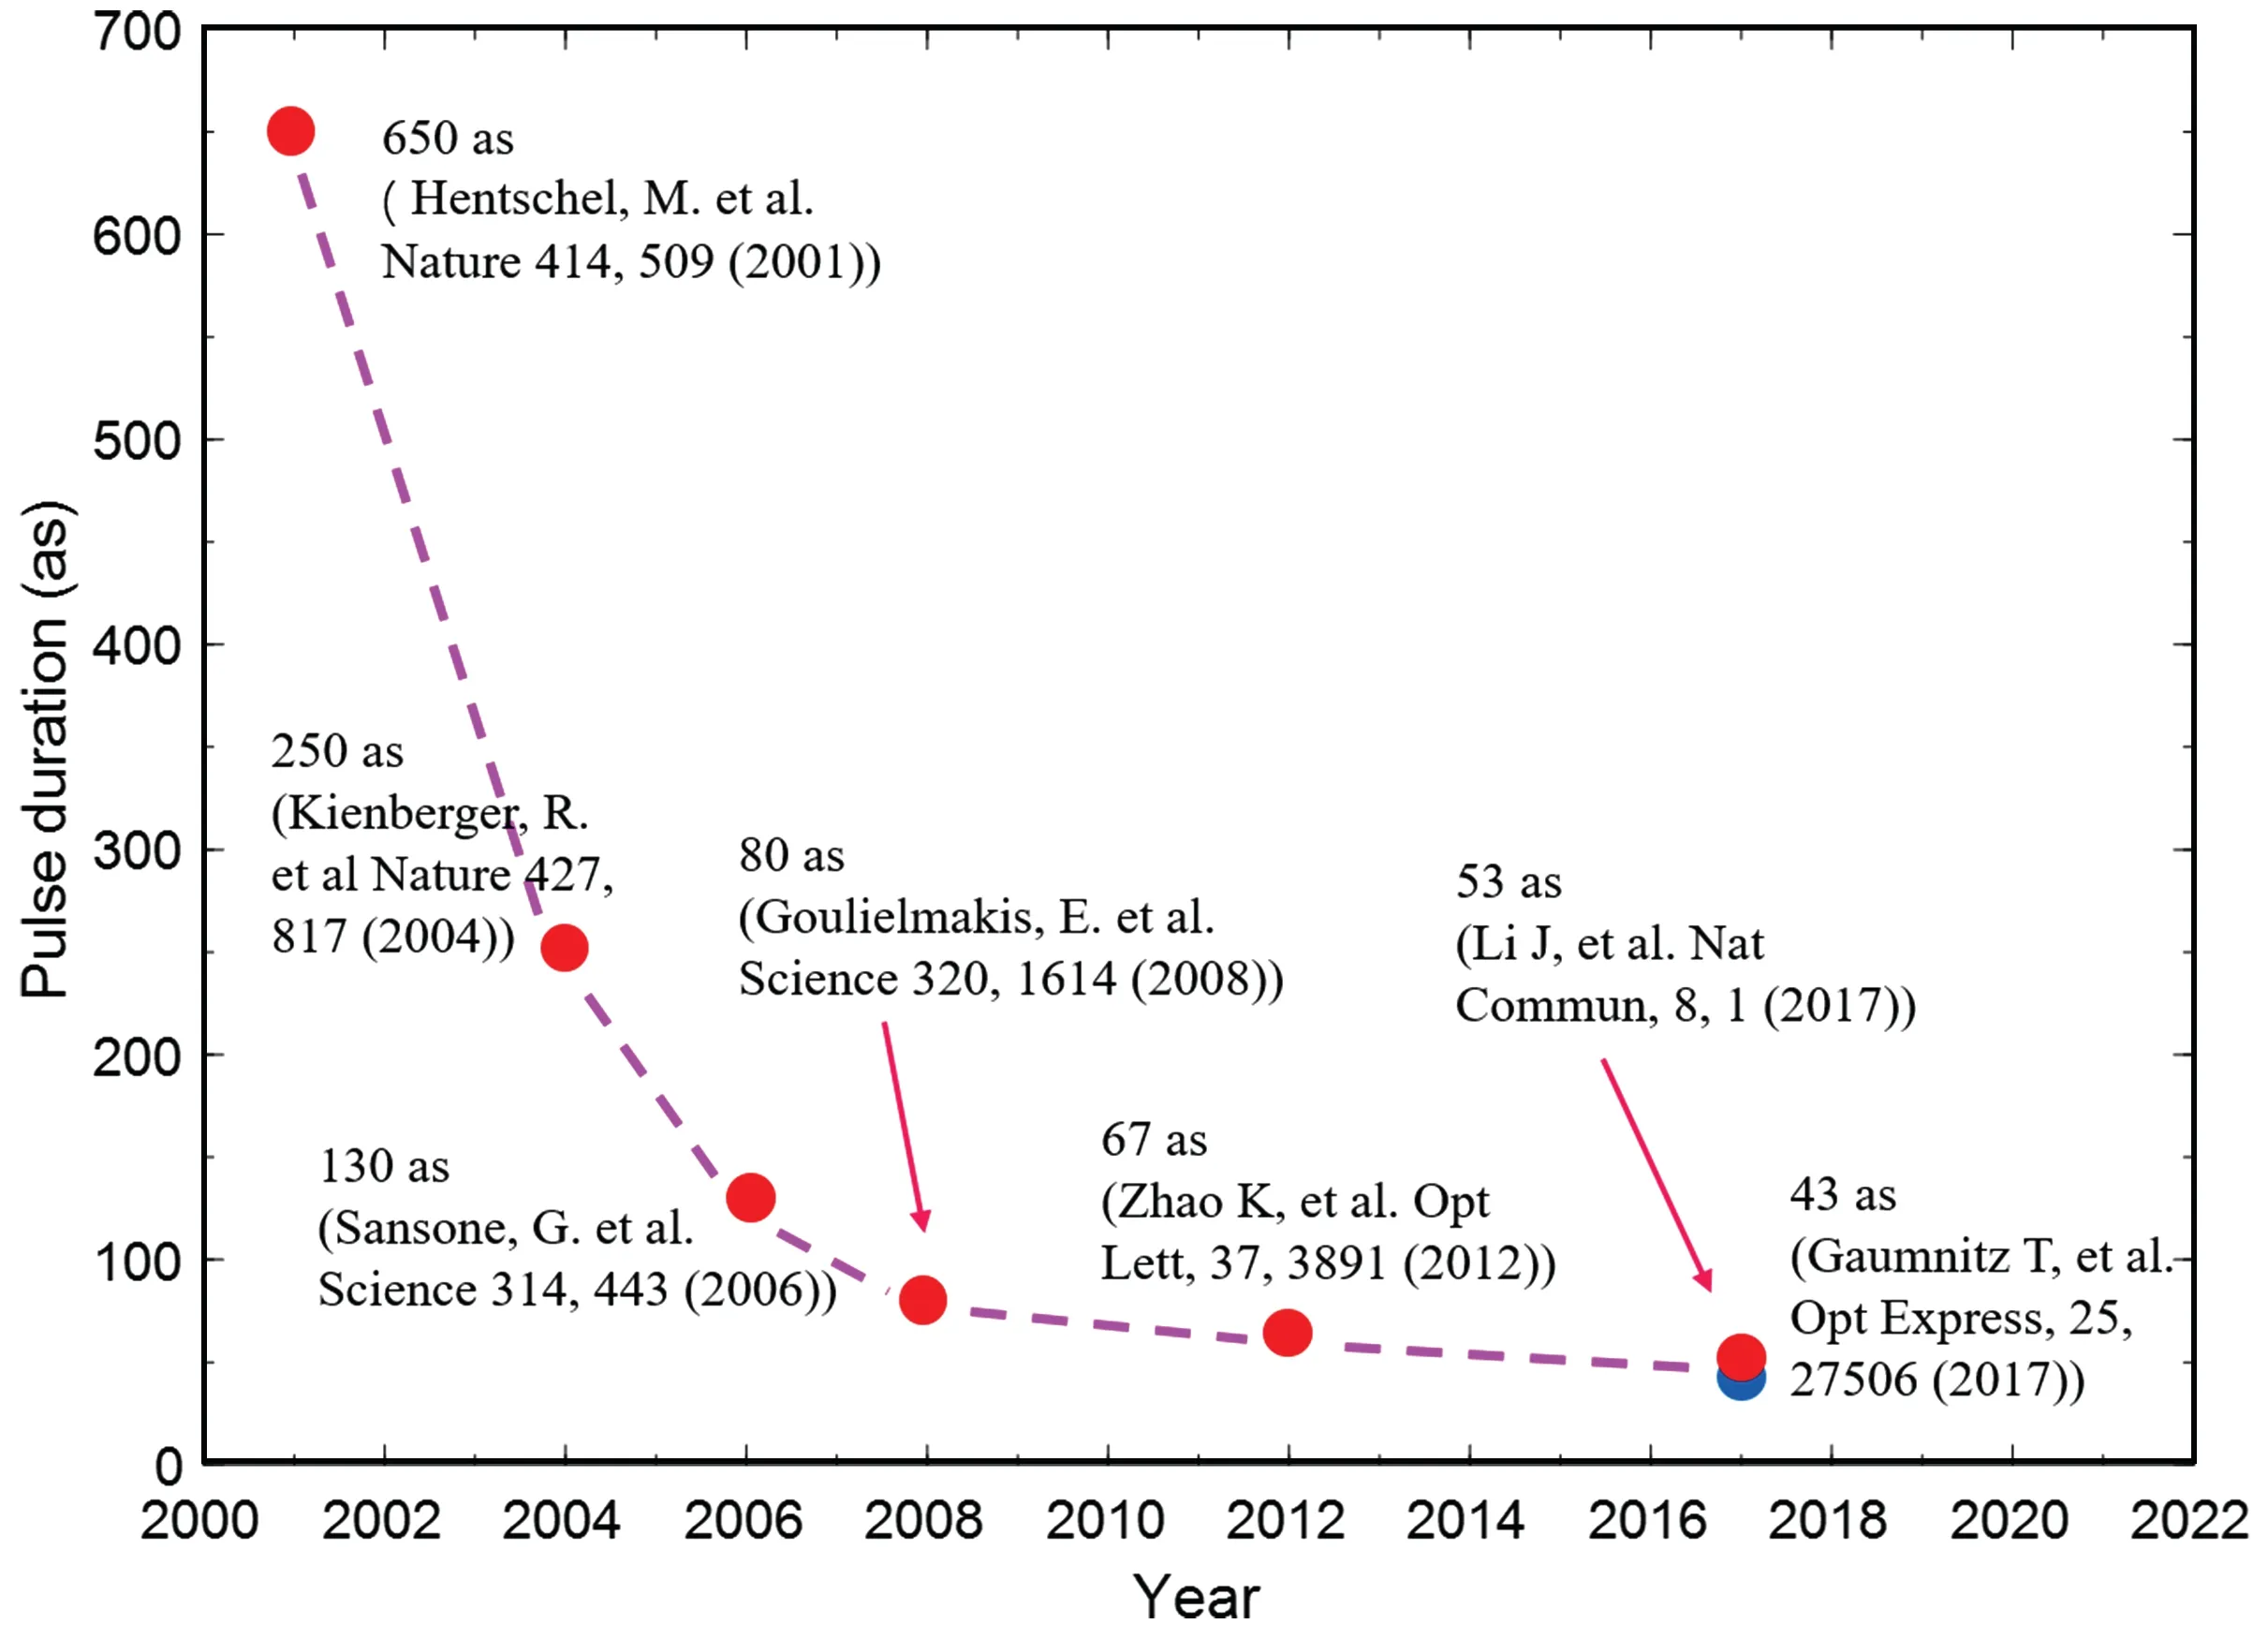
Fig.1. Representative results in the progress of pulse duration of attosecond pulses.

Table 1. Summary of maximum photon energy and pulse duration of generated IAP together with corresponding laser parameters and choice of gas medium in representative works.
2.2. Approaching to the high photon energy
While pursuing shorter attosecond pulses, efforts have also been devoted to increasing the photon energy of the attosecond light source, namely, extending the spectral range of the high harmonic radiation. According to the three-step model, the maximum photon energy of high harmonics satisfiesEcutoff=3.17Up+Ip, whereIpis the ionization potential of the target atom andUpis the ponderomotive energy which is proportional toIλ2, withIandλbeing the intensity and wavelength of the driving laser. Thus, the maximum photon energy increases with the ionization potential, laser intensity and wavelength. The maximum photon energy obtained in the typical works introduced in Subsection 2.1 is summarized in Table 1 too.Benefiting from the use of MIR drivers with much longer wavelength, the spectral ranges were dramatically extended in Refs. [24,25]. In Ref. [24], the spectrum of the radiation surpasses the carbonK-absorption edge(284 eV)and reaches the water window.
The “water window” is a spectral range of particular interest,corresponding to the photoenergy 280 eV to 530 eV or wavelength 4.4 nm to 2.34 nm. The spectral window owes its name to the fact that the water window radiation is not absorbed by oxygen (withK-edge 540 eV) in water while it is absorbed by carbon and nitrogen (withK-edge 284 eV and 401 eV, respectively) in organics. This provides an ideal tool for studying organic molecules and biological specimens in their natural aqueous environment. A lot of efforts have been done to obtain water window attosecond light sources.In 2015,Silvaet al.[26]generated IAP with central photon energy close to 300 eV based on spatiotemporal isolation of high harmonics driven by 1850-nm MIR pulses.The pulse duration is below 400 as and the bandwidth of the high harmonic spectrum supports a 30-as pulse duration. In the following year,the same group[27]produced IAP with photon energy covering 250 eV to 500 eV in the condition of high-pressure phase matching.
In 2018, Johnsonet al.[28]generated high harmonics capable of supporting attosecond pulses up to the photon energy of 600 eV with a overdriving scheme. In this scheme, very strong MIR driving laser–with intensity of 2×10¹⁵W/cm2–strongly ionizes the medium and creates plasma that reshapes the driving field. The rapid reshaping leads to strong gradients in intensity and phase,both in space and time,and to transient subcycle phase matching.
2.3. Approaching to the high pulse energy
Another important objective is to increase the pulse energy, so that the attosecond pulses are strong enough to trigger observable ultrafast phenomena. As introduced in the above subsection, most early works producing IAP utilize CEP-stabilized few-cycle or even single-cycle driving pulses.The energy of these pulses is generally in the milli-Joule level.Considering that the conversion efficiency of HHG is only 10−5to 10−6,the energies of the generated attosecond pulses are in the nano-Joule to pico-Joule level,[9,22]see Fig.2. The pulse energy achieved in Ref. [21] based on the polarization gating is in the pico-Joule level too. Approaches based on other schemes such as ionization gating[29,30]and double optical gating[18]can be more efficient and the obtained pulse energy was increased by more than one order of magnitude.However,the pulse energy was still in the nano-Joule level.

Fig.2. Representative results in the progress of pulse energy of attosecond pulses. This is a recast of the figure in Ref.[31].
To date, it turns out that the most promising scheme to generate efficient IAP is two-color or multi-color gating.[15–17]In 2013, Takahashiet al.[31]increased the pulse energy up to the micro-Joule level using tera-Watt two-color driver, and 10 µJ quasi-IAP and 1.3 µJ IAP were obtained. The peak power of the IAP can be evaluated to be 2.6 GW,which even surpasses that from a compact extreme-ultraviolet(XUV)free electron laser (FEL). The pulse durations of the quasi-IAP and IAP were 375 as and 500 as, respectively. To compress the pulse duration while keeping the high efficiency, Xueet al.[32]synthesized a 50-mJ three-color driver and, with this driver, generated shot-to-shot continuum harmonic spectrum with pulse energy above 0.24 µJ and peak power beyond 1 GW. A later experimental characterization showed that the pulse duration was 226 as.[33]
As the water window IAP is of particular interest, it is also critical to increase the water window pulse energy. A major challenge is that the HHG efficiency exponentially drops with the increase of the driving wavelength as∼λ−αwith 5<α<6. The values in some typical works are summarized in Fig. 3. In detail, high-order harmonics up to 350 eV were obtained with a photon flux of∼105photons/s(1%bandwidth)in Ref.[34]. In Ref.[27],soft x-ray continuum covering the entire water window from 200 eV to 550 eV was obtained. The photon fluxes at 284 eV were about 2.8×10⁷photons/s/10%bandwidth and 1.8×10⁶photons/s/10%bandwith for neon and helium, respectively. This resulted in pulse energies, defined in the water window between the carbonKshell edge and the cutoff, about 2.9 pJ and 0.9 pJ, respectively. In Ref.[35],high-order harmonics with cutoff extending up to 550 eV were obtained. The generated flux is about 8.0×10⁴photons/shot in the entire water window. At the carbonK-edge, this corresponds to 4.9×10³photons/short/1%bandwiths and pulse energy of 0.22 pJ. The HHG yield can be increased by the overdriving scheme.[28]The highest measured total flux across the water window was about 0.20 pJ per pulse(4.0×10⁶photons/s)in helium and 2.0 pJ per pulse(4.0×10⁷photons/s) in neon. However, the maximum pulse energy is still in the pico-Joule level. Recently, Fuet al.[36]drove the HHG with tera-Watt MIR laser in a meter-long loose focusing geometry. The gas cell was designed as a double structure to maintain a low gas pressure, so that optimum phase matching can be achieved over the long laser–gas interaction distance. The HHG yield was two orders of magnitude higher compared to that in previous works and the pulse energy was increased to the nano-Joule level−10 nJ for 150–300 eV and 3.53 nJ in the water window.
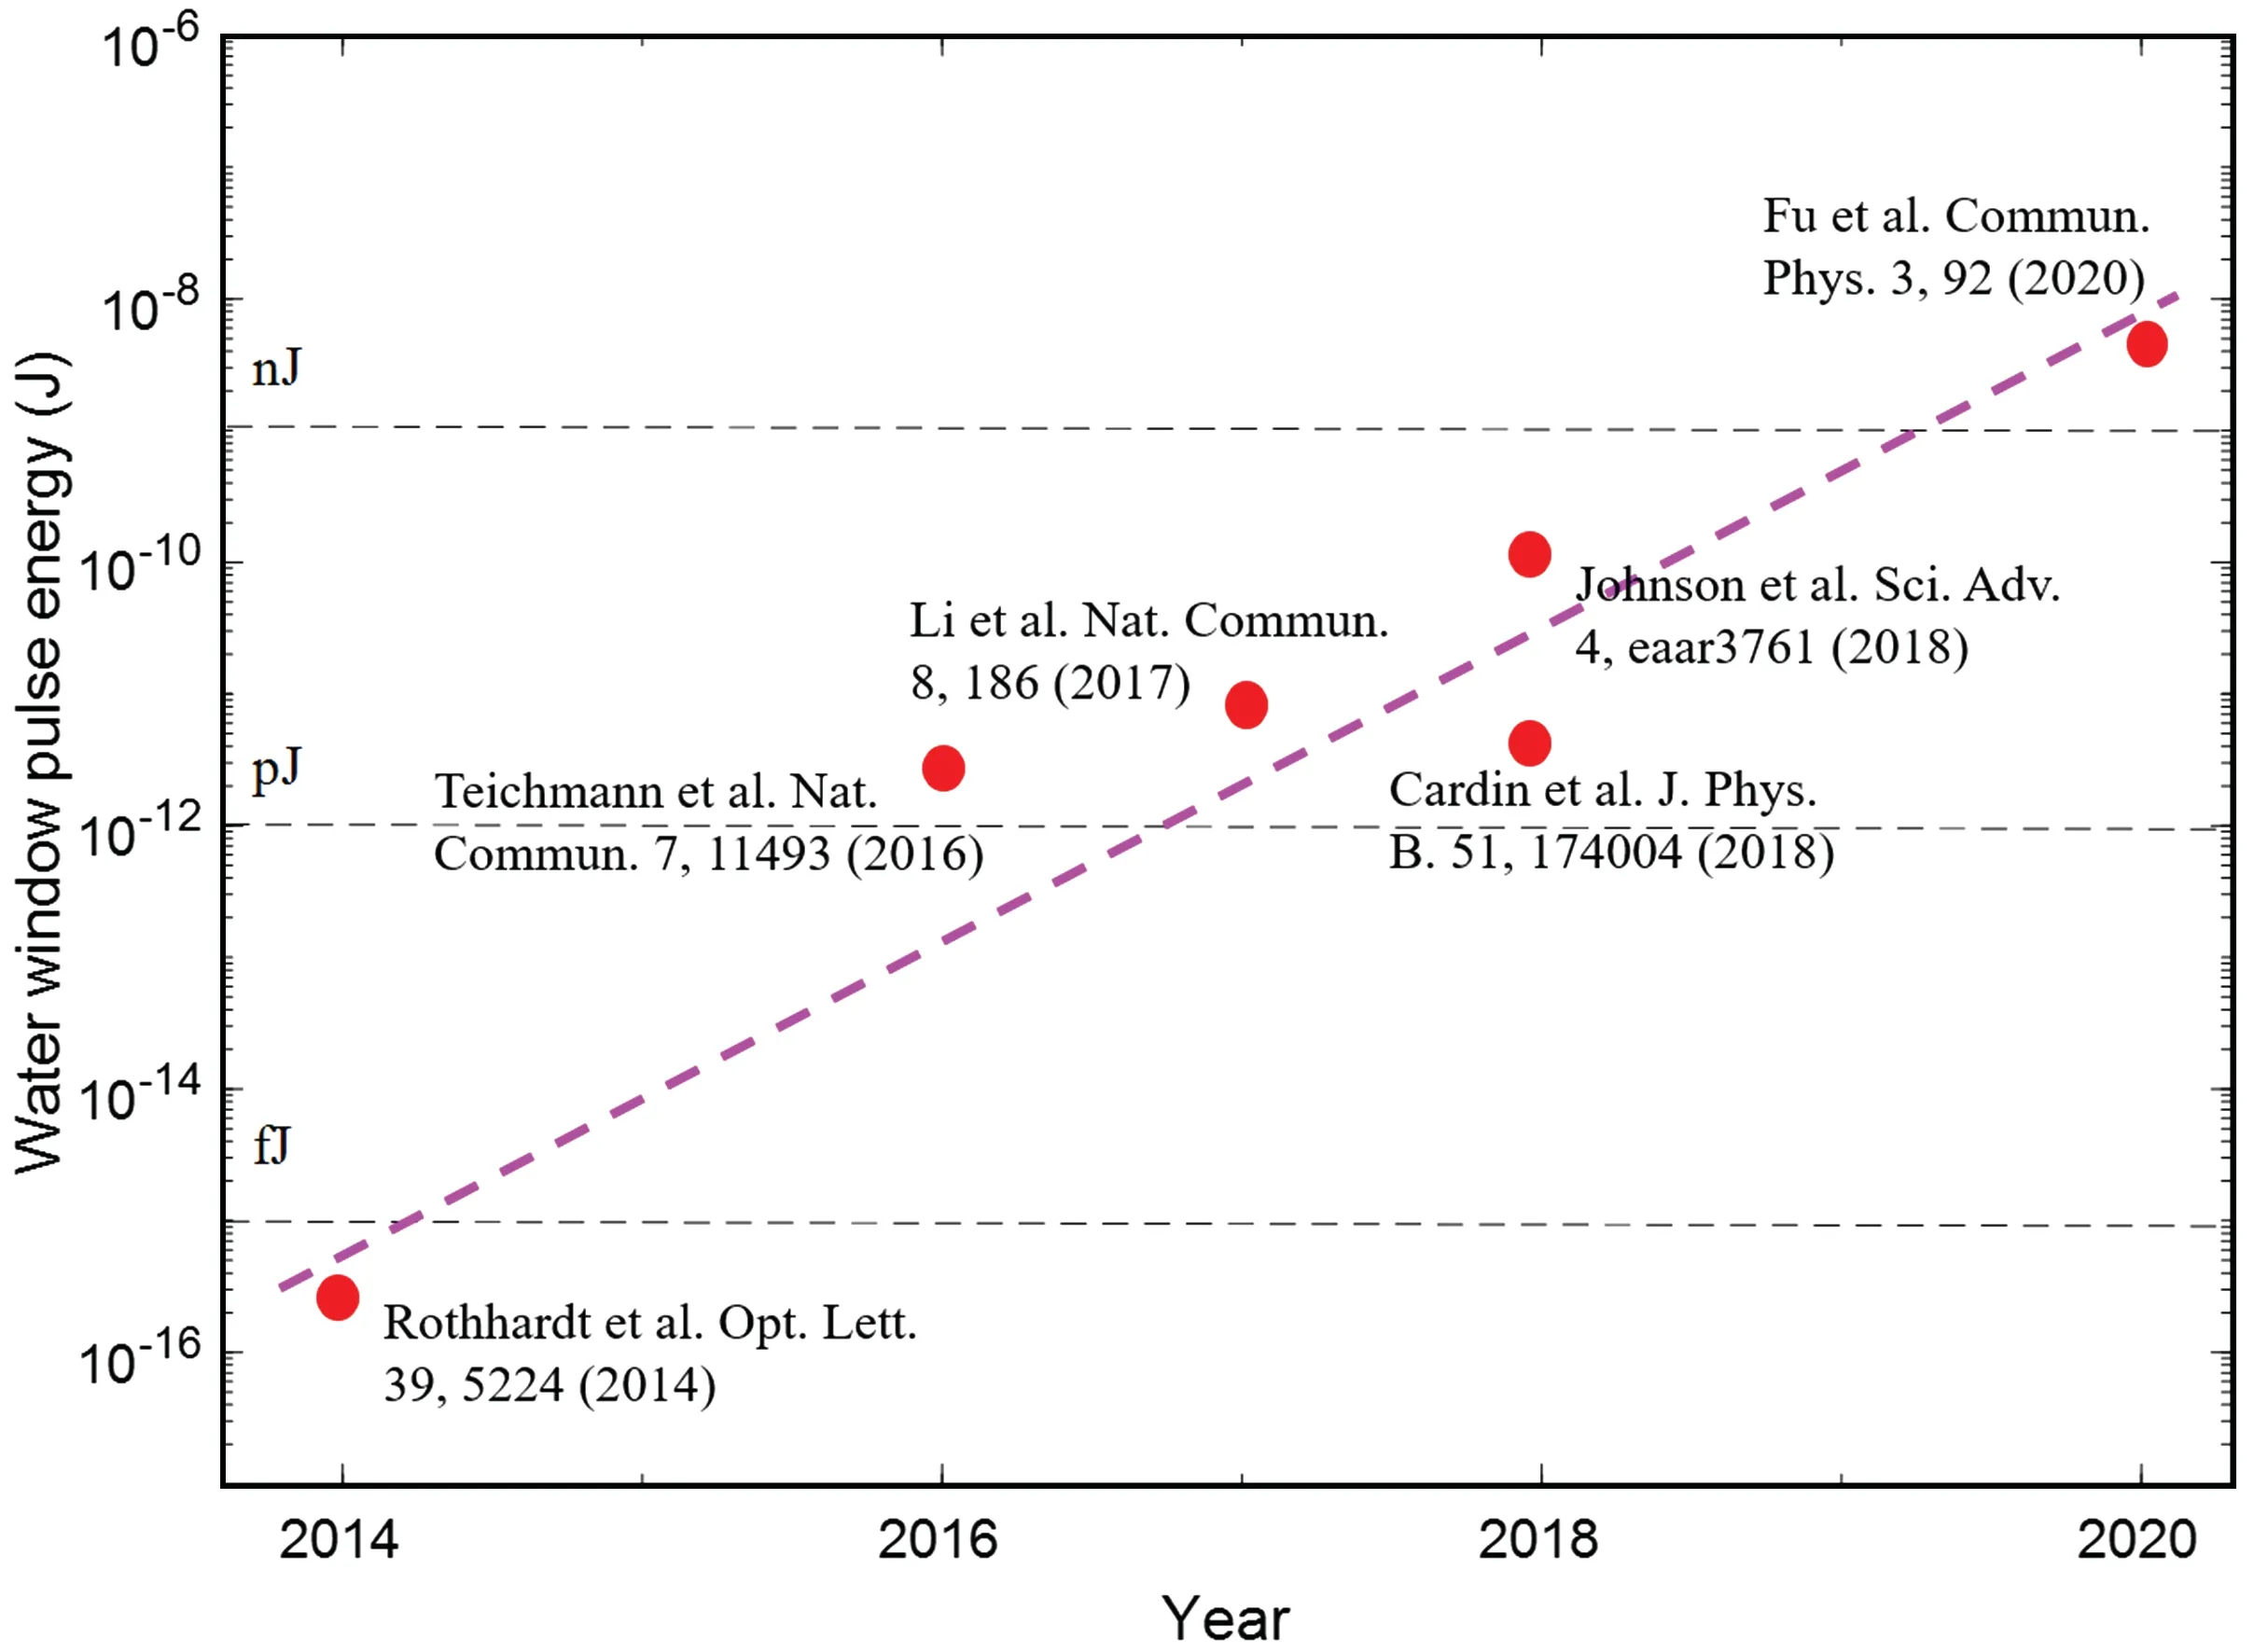
Fig. 3. Representative results in the progress of pulse energy of water window attosecond pulses. This is a recast of the figure in Ref. [36].More detailed information about the results is summarized in the text.
2.4. Approaching to the high average power
Besides the high pulse energy, namely, peak power, of the IAP,a high average power of the attosecond light source is critical for some applications,such as the ultrafast XUV or xray absorption spectroscopy and photoelectron spectroscopy.One effective way is to employ novel MIR femtosecond light source with high repetition rate.[37,38]Most traditional works as mentioned above produce attosecond light sources based on Ti:sapphire chirped pulse amplification (CPA). The repetition rates of the drivers are generally 10 Hz to 1 kHz. In contrast,the Yb-based CPA can deliver multi-mini-Joule subpicosecond infrared laser pulses at 100 kHz to a few MHz.Meanwhile,the average power can be improved up to the kilo-Watt level.
Before being used to drive HHG, the sub-picosecond pulses from the Yb-CPA need to be post-compressed. The most widely applied technique is broadening the pulse spectrum in a gas-filled hollow-core-fiber followed by dispersion compensation with chirped mirrors.[39]Other postcompression techniques based on multipass cell[40]and multipass thin plate[41]have been developed too. The infrared pulses can be post-compressed to several tens of femtoseconds to a few femtoseconds,with the average power up to hundreds of Watts. These pulses are ideal drivers to generate attosecond pulses with high average power.
An alternative way to generate short femtosecond pulses with high repetition rate and average power is to develop optical parametric CPA(OPCPA)[42,43]pumped by the Yb-CPA.The CEP-stability of the amplified pulses is preserved during parametric amplification as long as the intensity of the pump pulses does not change substantially from pulse-to-pulse.[44]This method has been used to produce sub-10-fs laser pulses at 100 kHz to a few MHz and consequently attosecond light source with high average power.[45,46]Besides, MIR laser pulses capable of extending the photon energy of high harmonics and attosecond pulses can be obtained with OPCPA using different nonlinear materials. It is even expected to produce femtosecond laser pulses with average power more than 3 kW in a concept design,[48]which will provide a powerful driver that dramatically boosts the average power of attosecond light source. Another way to achieve high average power is to employ cavity-enhanced HHG,which can increase the repetition rate to tens of MHz with limited single-pulse energy.[47]
3. Pump–probe based attosecond spectroscopy
Attosecond time-resolved techniques are developed on the basis of traditional femtosecond pump–probe schemes,in which the pump pulse and the probe pulse interact successively with matter to capture dynamic information, thus the whole process is a nonlinear process. Laser driven high harmonics from noble gases are still the main attosecond source.Although this light source has good temporal and spatial coherence, its conversion efficiency is low. Its conversion efficiency drops from 10−4to 10−7from VUV to soft x-ray.[49]The pulse energy of attosecond pulses generated by conventional femtosecond lasers is typically on the order of nano-Joule or even pico-Joule. Therefore, direct extension of the pump–probe scheme from femtosecond to attosecond time scale is challenging. Although the existing experimental conditions have achieved a single attosecond pulse of micro-Joule level by using high harmonics,[31]it relies on large scale laser facilities with extremely high power, and the corresponding pump–probe experiments often suffer from the complex cooling scheme,difficult beam control and low repetition rate,limiting its applications. There is an urgent need to develop new techniques to solve the relevant scientific problems. How to develop novel attosecond spectroscopies on the basis of conventional femtosecond laser system has become the active research direction in ultrafast science. This section reviews the development of attosecond pump–probe schemes based on attosecond pulses and introduces the principle and application of several representative attosecond spectroscopies.
3.1. Attosecond photoelectron spectroscopy
In the attosecond time-resolved measurements, the final products of the interaction include photons,electrons and ions.The charged particles can be collected and analyzed using devices such as time of flight, velocity map imaging or reaction microscope,from which the time evolution information of the photo-induced processes can be obtained. The most wellknown attosecond photoelectron spectroscopies are attosecond streak camera and reconstruction of attosecond beatings by interferences of two-photon transitions(RABBITT).
3.1.1. Attosecond streak camera
Streak camera is a diagnostic instrument similar to the oscilloscope.It uses the spatial deflection of the electron beam to image the intensity envelope of the signal to be measured. Its time accuracy is limited by the scanning speed of the streaking electric field, which is usually in the order of hundreds of femtoseconds. To capture faster processes requires the development of streak camera with higher temporal resolution.The concept of attosecond streak camera was first proposed by Itataniet al. in 2002.[51]The principle is similar to that of a traditional streak camera. Attosecond photoelectron is generated by photoionization when the attosecond pulse interacts with the medium. The VIS-NIR laser field is used as the streaking field to deflect the photoelectron momentum. The pulse width of attosecond pulse as well as the interaction dynamics are encoded in the photoelectron spectrum. Based on classical Newtonian mechanics,the final state velocity(atomic units)of photoelectrons is[51]
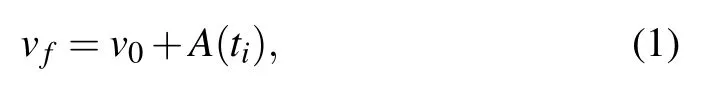
wheretirepresents the time corresponding to the attosecond pulse peak (i.e., the moment when the photoelectron is generated),v0represents the initial velocity of the photoelectron,whose magnitude is determined by the photon energy of the attosecond pulse, andA(ti) represents the vector potential of the streaking field.
By changing the relative delay between the attosecond pulse and the streaking field(with attosecond time accuracy),two-dimensional photoelectron spectrogram can be obtained.It contains more information than photoelectron spectrum at a single delay, and can be used for the accurate measurement of a series of ultrafast processes such as photoionization delay,[52–62]temporal phase of attosecond pulse,[22,63–66]and excited state relaxation dynamics.[22,62–67]It is one of the most commonly used ultrafast detection techniques with attosecond time resolution nowadays. Figure 4 is a typical attosecond streak camera spectrogram. According to Eq.(1),the centroid of the photoelectron spectrum under a given delayφidirectly reflects the vector potentialA(ti) of the streaking field at that time, so the time domain waveform of the streaking field can be read directly from the two-dimensional photoelectron spectrum,which is also the earliest peta-Hertz oscilloscope.[68,69]
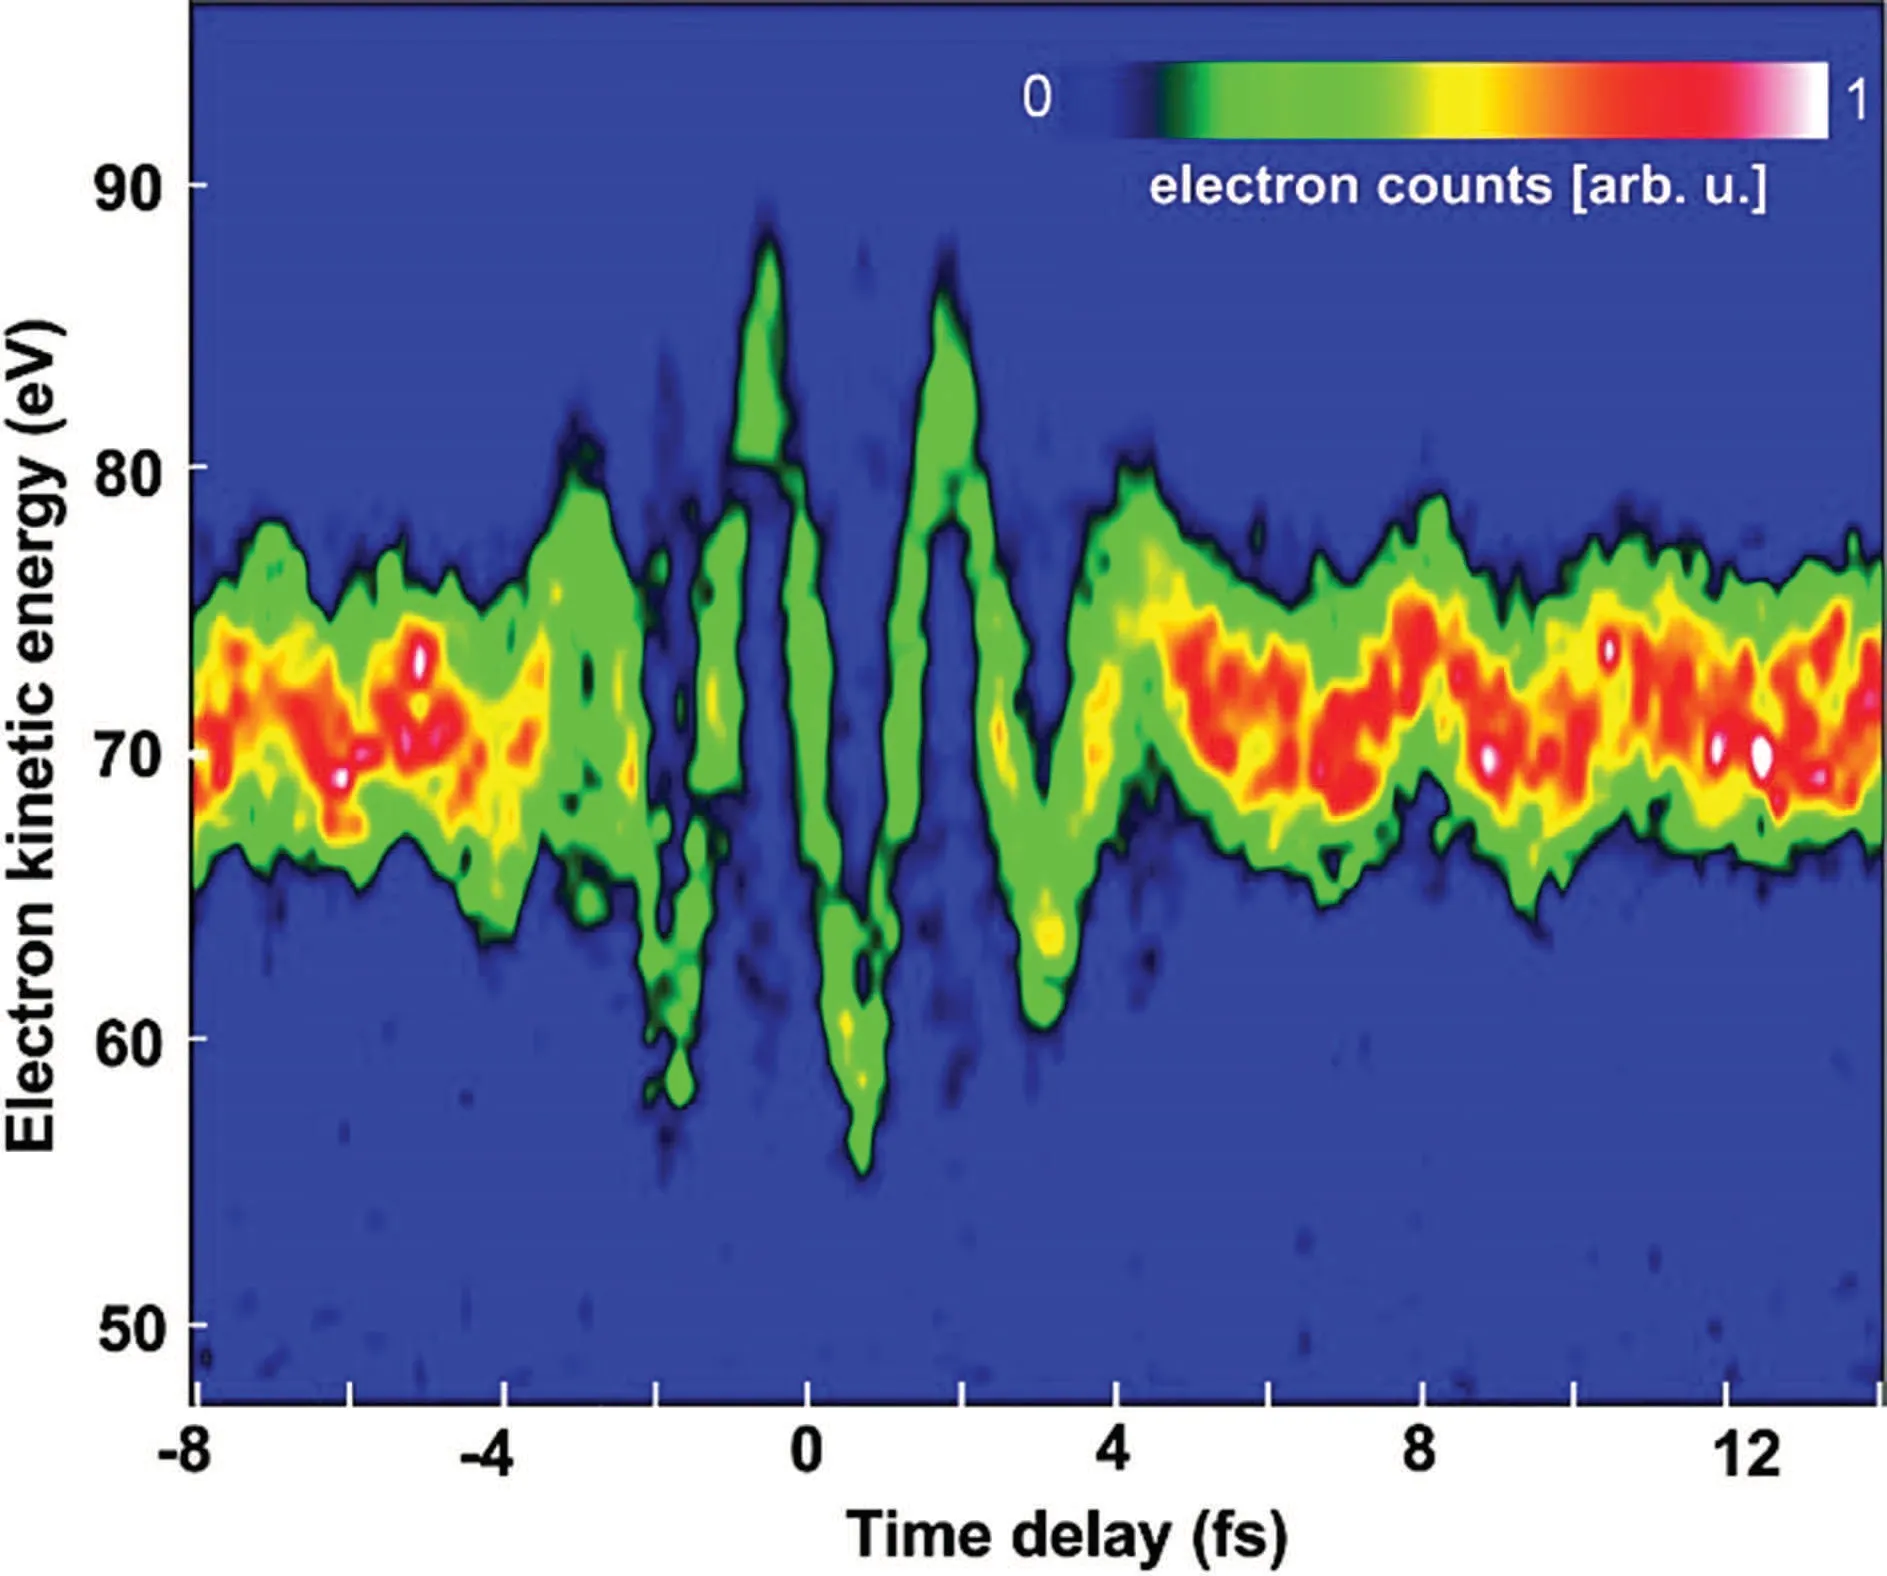
Fig.4. Two-dimensional photoelectron spectrogram measured with attosecond streak camera.[68]
In 2005, Mairesseet al. first proposed a scheme for accurate reconstruction of attosecond pulses using frequencyresolved optical gates.[63]Under the framework of strong field approximation, the transition probability amplitude of photoelectrons with final state momentumVis
whereWis the kinetic energy for the electron in the final state,dpis the transition matrix elements from the ground state to the continuum state|p〉. Assuming thatΦ(t) is independent of the final state momentum(the central momentum approximation), the electron momentum spectrum can eventually be approximated as

In this formula,the functionG(t)=eiΦ(t)dp(t). Equation(3)is mathematically identical to that of a frequency resolved optical gating(FROG)measurement,[70]which is used to measure optical pulses. Therefore,the phase information of the streaking field and attosecond pulses can be completely recovered using a matured reconstruction algorithm. This scheme has also become the most commonly used attosecond pulse measurement scheme.
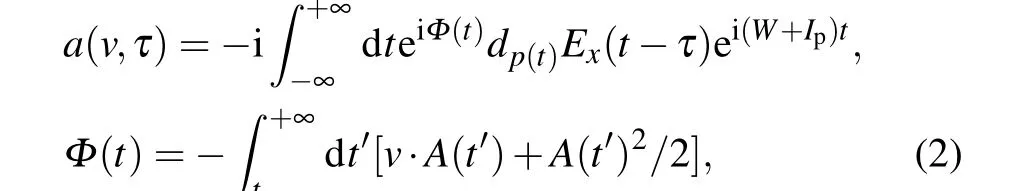
In addition to reconstructing waveforms of light field,the attosecond streak camera is also used to detect time delays during photoionization. Equation (1) shows that when the Coulomb interaction is ignored,the oscillation of the photoelectron momentum coincides with the vector potential of the streaking field. In fact, the photoionization process requires Coulomb interaction to satisfy both momentum conservation and energy conservation. The Coulomb interaction will have impact on the synchronization between the photoelectron spectrum and the streaking field, and the introduced Wigner delay[71]will make the oscillation phase of the photoelectron spectrum lag behind the vector potential of the streaking field.This delayed phase can be used to characterize the attosecond time scale difference of electron emission times from different shells during XUV photoionization. In 2007, Cavalieriet al.studied the photoelectric effect on solid surface using attosecond streak camera technique,and measured the ionization time difference between the conduction band electrons and the 4f inner shell electron of tungsten metal to be hundreds of attoseconds,quantitatively revealing the time scale of the occurrence of the photoelectric effect for solids.[52]In 2010,Schultzet al. experimentally studied the photoionization of 2s and 2p shells of a Ne atom by attosecond streak camera.[53]As shown in Fig.5,the single attosecond pulse with a central photon energy of 90 eV potoionizes the Ne atom and creates two sets of stripes in the photoelectron spectrum,corresponding to the ionization of 2s and 2p electrons. Accurate analysis of the relative phase between the two stripes shows that there is about 20 as time difference between the two shells’electronic photoionization. It provides important benchmark results for the quantitative study of photoionization and other basic atomic physical processes.
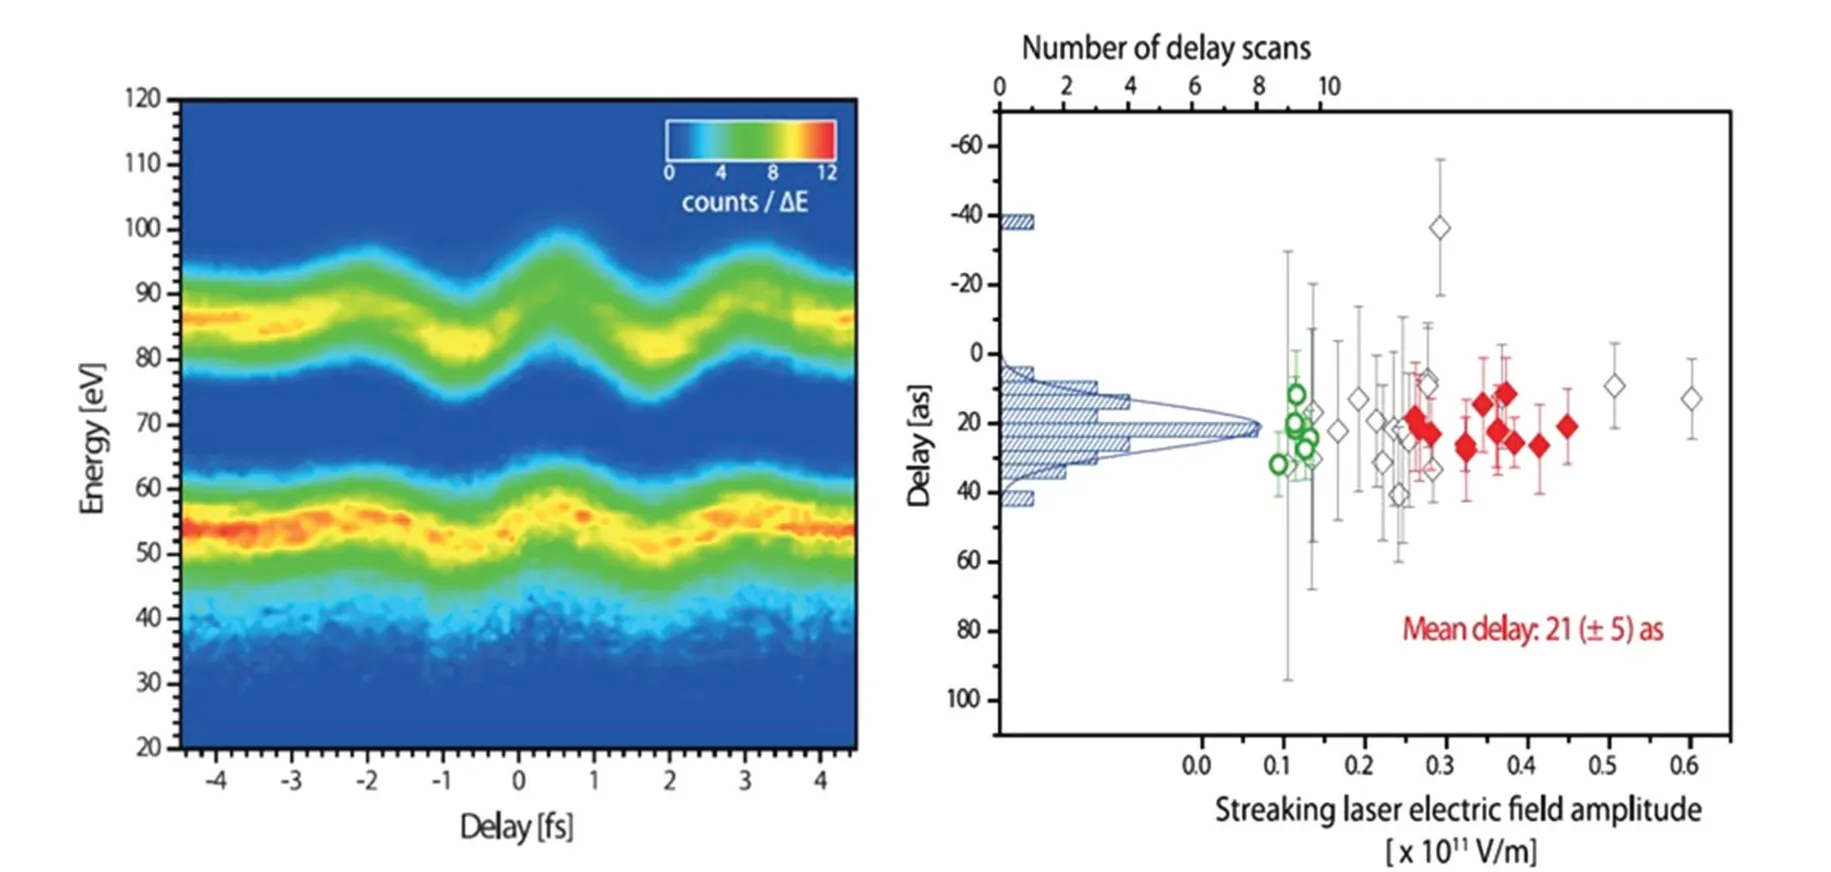
Fig.5. Photoemission delay between 2s and 2p electron in Ne measured with attosecond streak camera spectroscopy.[53]
Attosecond streak camera is also used to indirectly diagnose the dynamic conductivity of materials. In 2016, Garget al. studied the dynamic conductivity of glass induced by high intensity single-cycle laser with attosecond streak camera technique. Driven by a strong laser,the nonlinear effect in the medium can induce an instantaneous current. The appearance of this current can change the conductive characteristics of the medium, and it is accompanied by the generation of high harmonic radiation. Garget al. reconstructed the radiation signal of extreme ultraviolet attosecond pulse from glass by using attosecond streak camera, and the dynamic conductivity with a changing frequency up to several beta-Hertz was measured.[72]This is a proof of principle experiment of highspeed optical switching devices,which provides an important scheme for the development of high-speed optoelectronic devices.
3.1.2. RABBITT
RABBITT technology is similar to attosecond streak camera and is also an attosecond photoelectron spectroscopy.The difference is that the XUV light source used for photoionization is an attosecond pulse train rather than an isolated attosecond pulse. Each attosecond pulse in the pulse sequence can generate a set of streaking photoelectron spectrum. The coherent superposition of the multiple photoelectron spectra gives the final photoelectron spectrogram. The experimental principle of this scheme is shown in Fig. 6.[8,50]High-order harmonic attosecond pulse train generated at the first gas jet combines with a delayed near-infrared laser pulse and interacts with the second gas jet.When the intensity of the near-infrared laser is not too high, the highest order nonlinear process is two-photon process.Thus,the photoelectron spectrum is composed of the main peak and the sideband:the main peak structure in the photoelectron spectrum is formed by the ionization by a single high harmonic photon of different orders, and theqth-order sideband in the photoelectron spectrum is formed by the absorption of a high-order harmonic photon of the orderQ+1(Q−1)and the simultaneous release(absorption)of a near-infrared photon. According to the second order timedependent perturbation theory, the intensity of theqth sideband is proportional to cos(2ϕIR+ϕq+1−ϕq−1+∆ϕatomic).[73]ϕIRis the relative phase between high-order harmonic pulse chain and the near-infrared laser field, ∆ϕatomicis the dipole transition phase related to the atomic structure, andϕqis the phase of theqth-order high-order harmonic. The sideband yield oscillates sinusoidally with delay, and the phase of oscillation depends on the high-order harmonic group dispersion,the near-infrared laser field intensity,and the photoelectric ionization Wigner delay associated with ∆ϕatomic. The effect of high harmonic group delay and near infrared laser field on measurement can be eliminated by taking phase difference of oscillation of different sidebands, and the relative delay of photoionization from different harmonics can be accurately measured. As you can see, compared with the attosecond streak camera measurement, RABBITT is an interferometric technique and thus retains both attosecond time resolution and decent energy resolution. This interference technique was originally used to measure the averaged pulse width of a single pulse in attosecond pulse sequences. Its important application was discovered in the measurement of photoionization delay. After the ionization delay of Ne atom was successfully measured using isolated attosecond pulses,Klunderet al. also measured the ionization delay between photoionization from 3s and 3p orbitals of an Ar atom using RABBITT.[74]One advantage of RABBITT is that the energy-resolved photoionization delay can be measured in a single experiment. Figure 7 shows the energy-resolved photoionization delay in a noble gas(He,Ne,Ar)measured using RABBITT.[75]When the photon energy is low, the photoelectron is produced near the threshold,and the Coulomb interaction preserves for a longer time, leading to a relatively larger delay difference. With the increase of the photon energy, the influence of Coulomb effect becomes smaller and the introduced photoionization delay becomes smaller. In 2017,Guenotet al. studied the photoionization process of 2s and 2p orbitals of Ne again using RABBITT.[76]The good energy resolution of this technique is used to separate the ionization processes of different channels in energy, and the channel resolved ionization delay is realized, which explains why the previously measured results by attosecond streak camera are abnormally large.

Fig.6. Experimental setup and principle of RABBITT.[8,50]

Fig.7. Energy-resolved photoemission delay between noble gas atoms measured with RABBITT.[75]
RABBITT is not only used to study the basic photoionization process of atoms,but also used to reveal the photoionization dynamics and transport process of electrons in complex systems such as molecules, solids and liquids.[77–81]In 2016,Taoet al. combined RABBITT technology with angleresolved photoelectron spectroscopy (ARPES) to study the lifetime of the excited state in Ni(111).[78]Photoelectrons are generated by the interaction of attosecond pulse sequences covering 17–66 eV of photon energy with Ni. Due to the good monochromaticity of all harmonics (frequency width is about 100 meV),the contribution of the initial electronic states from different conduction bands can be distinguished from the photoelectron spectrum. With the help of the RABBITT technique, the authors analyzed the oscillating phase of the sideband photoelectron yield with the delay, and found that there is an abnormal phase transition point near 20 eV,which can be attributed to the participation of a resonant excited state. The measured ionization delay (about 200 as) corresponds to the lifetime of the excited state. They also found that the lifetime is sensitively dependent on the photoelectron emission angle and revealed the influence of solid band structure on photoionization delay.
3.2. Attosecond transient absorption spectroscopy
The above ultrafast measurements based on attosecond light sources extract dynamic information on extreme time scales by collecting and analyzing charged particles. Another measurement scheme is attosecond spectroscopy, which uses an x-ray spectrometer to analyze the transmission or scattering spectrum of the photons. Representative schemes include attosecond transient absorption spectroscopy, attosecond wavemixing spectroscopy,attosecond transient spectroscopy reflectivity spectroscopy,etc. The significance of ultrafast nonlinear spectroscopy in the XUV regime has been discussed in several theoretical works many years ago.[82–85]Corresponding experiments have sprung up recently. In 2015,Bencivengaet al. realized time-resolved four-wave mixing process in XUV for the first time by using free electron laser.[86]As a tabletop XUV light source with good coherence, high harmonics have been gradually applied to ultrafast measurement in recent years. Attosecond transient absorption spectroscopy is the most common ultrafast spectroscopy based on high harmonics. The experimental apparatus is shown in Fig.8.
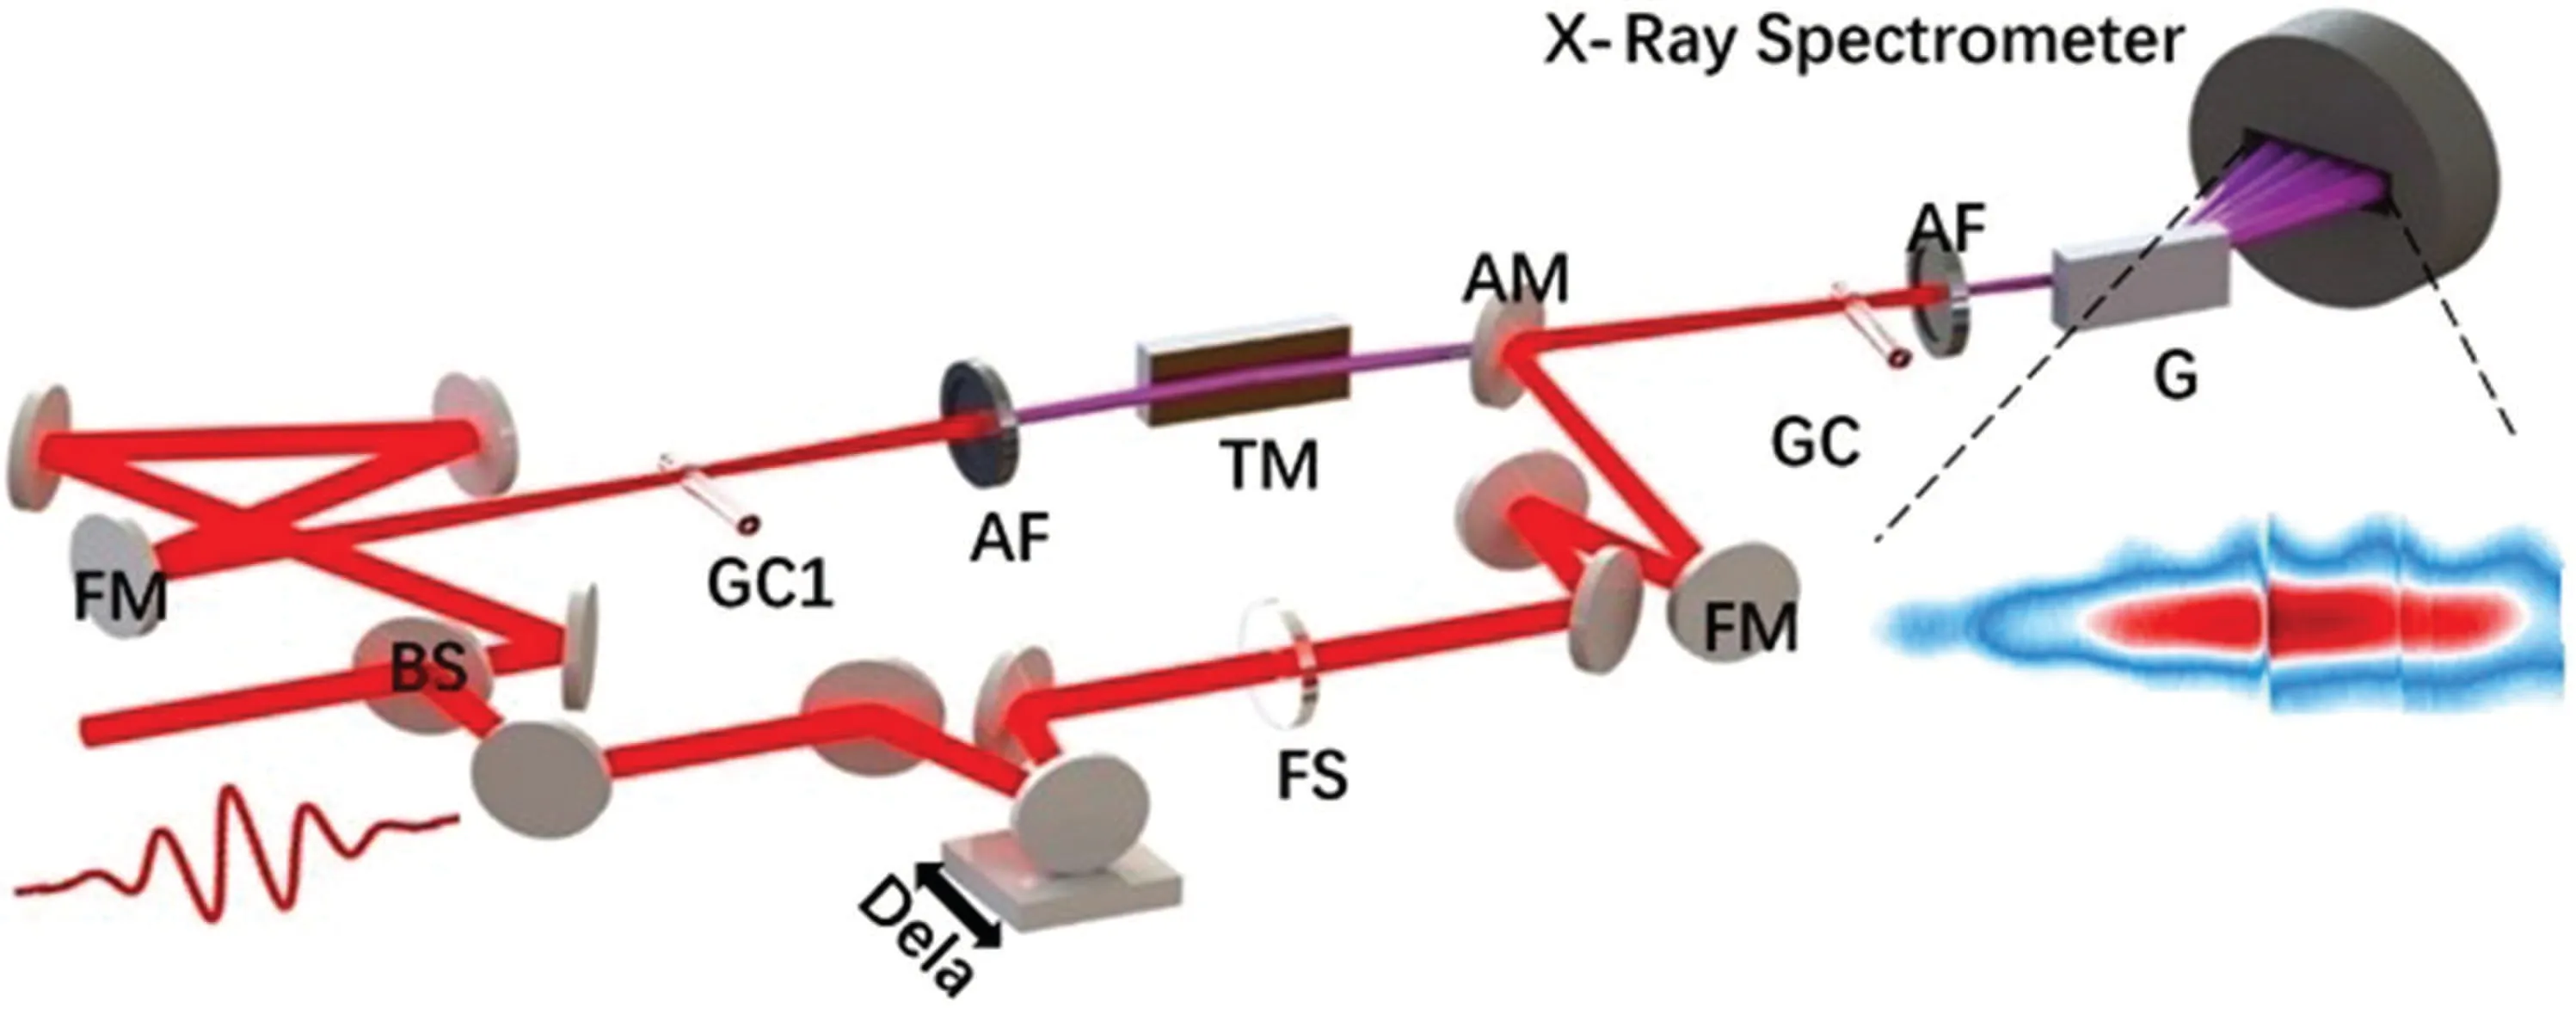
Fig. 8. Experimental setup of the attosecond transient absorption spectroscopy.[87]
The attosecond transient absorption spectrum can be divided into two categories according to the time sequence of the pulses. One is that the strong optical pulse interacts with the target producing metastable products,and then the delayed attosecond pulse is used to diagnose the time evolving process of the products. Because extreme ultraviolet/x-ray attosecond pulses can excite the inner shell electrons of the product to be measured, the corresponding absorption peak positions have element specificity,configuration specificity and charge specificity. Therefore,atoms with different elements,valence states and electronic configurations can be accurately calibrated in the absorption spectra,which can be used for real-time tracking of complex wave packet dynamics and photochemical reaction components. In 2009, Goulielmakiset al. for the first time observed several femtosecond scale motions of the valence electron of the singly charged krypton ion using attosecond transient absorption spectroscopy.[88]The experimental principle is shown in Fig.9.
Fig.9. Principle of valence electron motion detection using core-excited attosecond transient absorption spectroscopy.[88]
When the outermost electron of krypton atom is stripped by strong pulse laser, krypton ion forms two configurations of 4p1/2and 4p3/2due to the spin–orbital coupling. The coherence between the configurations forms the radial electron wave packet. The period of the wave packet is determined by the energy difference between the two configurations, and isT=1/∆E ≈7 fs. When a delayed attosecond pulse with a central photon energy of about 80 eV irradiates on krypton ion,the inner shell d electrons of the two configurations are excited to the highly excited state 3according to the transition selection rule,and the corresponding absorption peaks appear in the spectra due to the absorption of extreme ultraviolet photons. The intensity of the absorption peak oscillates rapidly with the delay, reflecting the good time coherence between the configurations of 4p1/2and 4p3/2in krypton ions at the initial stage of strong field ionization. Subsequently, a number of experimental groups have extended the attosecond transient absorption spectroscopy based on inner shell excitation to solids and carried out a large number of application studies.They include the detection of the dynamic process of tunneling ionization in silicon crystals,[89]the dynamic Franz–Keldysh effect in polycrystalline diamond,[90]the ultrafast phase transition process induced by light of VO2[91]and the ultrafast coherent demagnetization process induced by light of ferromagnetic alloy.[92]In 2017, scientists extended transient absorption spectroscopy based on high harmonics to the water window for the first time,and experimentally studied the adiabatic process of photochemical reactions of carbon molecules using ultrafast spectroscopy.[93,94]All of these studies benefit from the generation of broadband attosecond light sources,[95]which provides a key technical basis for expanding applications in more fields in the future.
In another class of attosecond transient absorption spectroscopy, the attosecond pulse firstly induces the single photon excitation to form free induction decay(FID),and then the time-delayed optical femtosecond laser pulse perturbs the induced dipole,thus changing the characteristic structure of the absorption spectrum. This transient absorption spectroscopy based on the perturbed free induction decay provides“fingerprint” information for the relaxation process, and can measure relevant physical quantities such as wave packet beat frequency[96–100]and excited state lifetime.[101–103]In 2010,Wanget al. used this technique for the first time to directly measure the relaxation process of the auto-ionized state of argon atom in time domain.[101]After the highly excited state of Ar atom 3s3p6np is excited by an attosecond pulse, a series of absorption peaks with certain linewidth will appear in the transmitted extreme ultraviolet spectrum due to the process of auto-ionization. Then a strong few-cycle near-infrared pulse rapidly truncates the dipole oscillation associated with the excited state by means of ionization or resonant transition, thus changing the absorption line-profiles. This change in absorption profile is observable only in the presence of an excited state and can therefore be used to measure the lifetime of the excited state in the time domain (see Fig. 10).In addition,such attosecond transient absorption spectroscopy has also been applied to the exploration of photo-induced states[104–107]and dynamic Stark effects[108–110]in atomic and molecular systems. The technique has also been extended to solids such as semiconductor gallium nitride and alumina with chromium dopant(Cr:Al2O3).[111,112]With this technique,the electric dipole oscillation with peta-Hertz frequency can be detected. These studies lay the essential groundwork for exploring the band states in solid-state materials and the controllable time dependence resulting from the material band engineering,and demonstrate the potential of developing peta-Hertz digital electronics in the future.
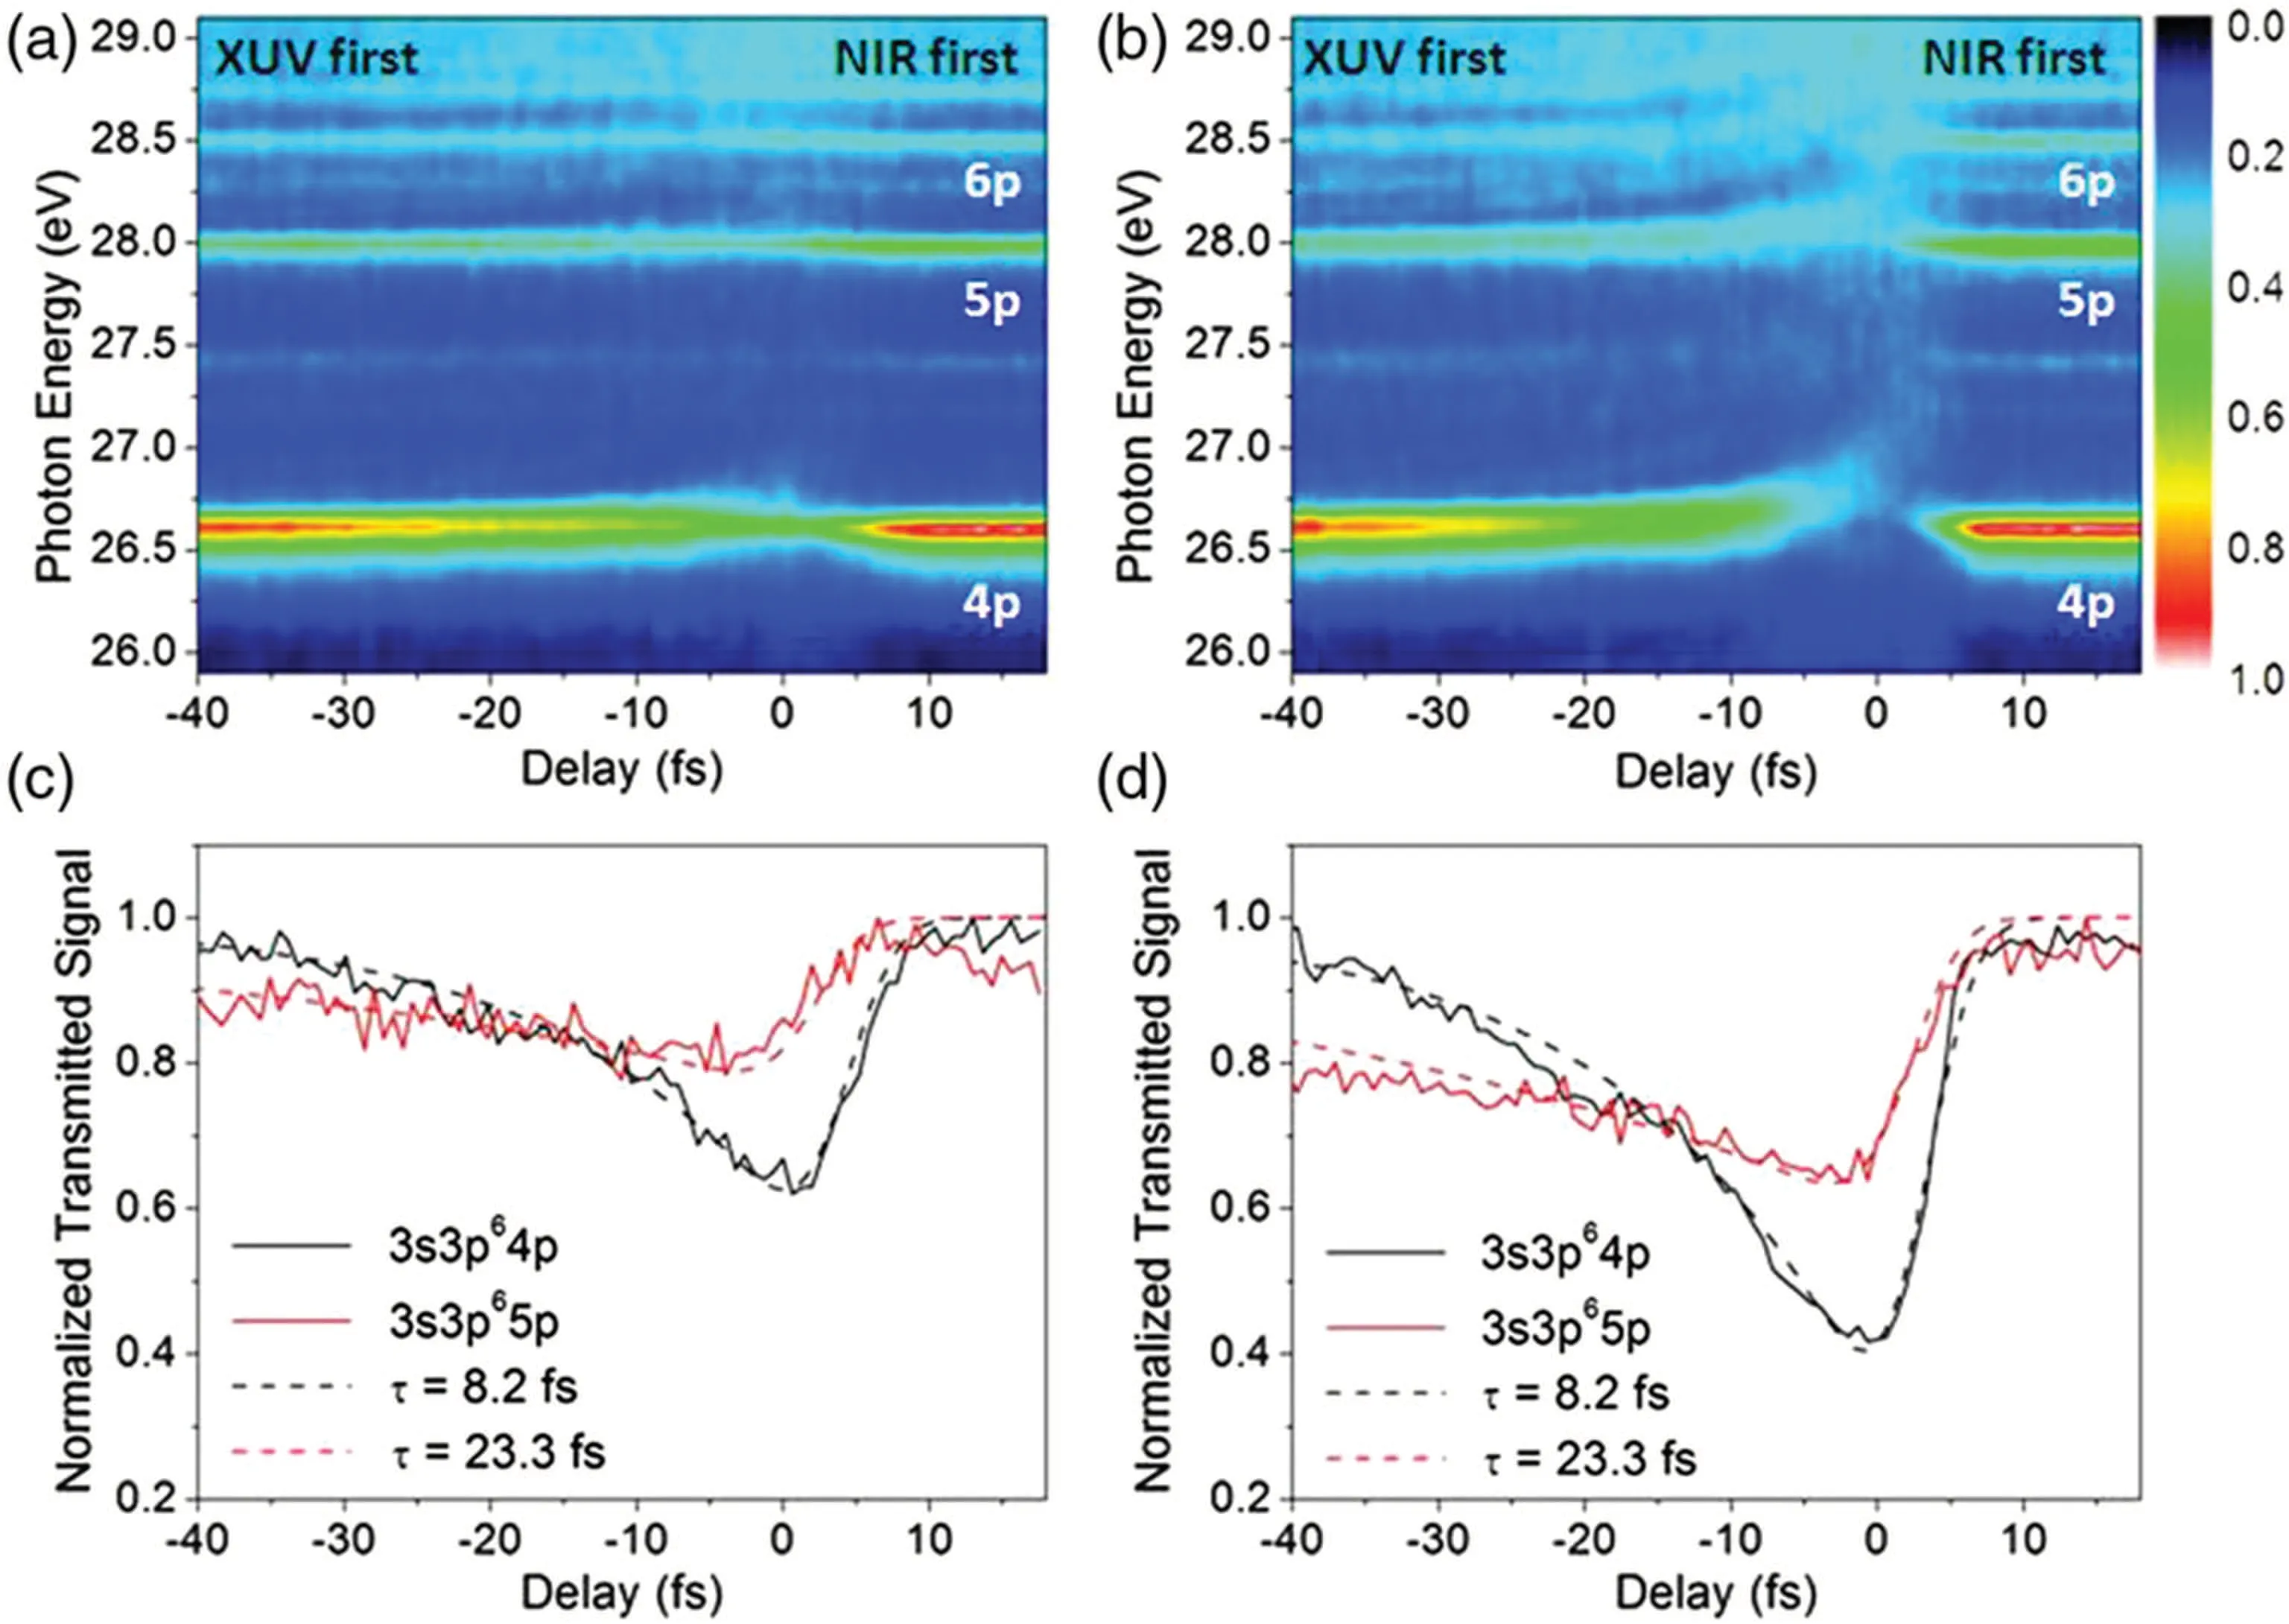
Fig.10. Lifetime measurement of autoionizing states in Ar using attosecond transient absorption spectroscopy.[101]
Experimental work on attosecond transient absorption spectroscopy in China has also been initially carried out.[87,113]Miet al. invented a peta-Hertz optical oscilloscope[113]based on attosecond transient absorption spectroscopy.The principle of this scheme is shown in Fig.11.Helium atoms undergo ac Stark effect (AT splitting or Stark Shift) when they are subjected to a strong driving laser. Attosecond pulses synchronized with the driving laser are used to detect the energy level structure of the atoms.The introduction of a third,weaker,perturbed laser(the signal to be measured)causes the energy level of the laser-dressed atom to shift by an amplitude proportional to the electric field of the signal pulse.Thus the electric field waveform of the signal light can be read directly from the absorption spectrum.This method avoids the problems of optical component dispersion and plasma-induced waveforms distortion,and can directly measure the waveforms of peta-Hertz optical pulses with an accuracy of about 100 as in the time domain.

Fig.11. Measuring the temporal waveform of an optical pulse using attosecond transient absorption spectroscopy.[113]
3.3. Attosecond transient wave-mixing spectroscopy
The characteristic absorption spectrum in attosecond transient absorption spectroscopy is composed of multiple radiation components(incident light,linear process and nonlinear process). The nonlinear process includes dynamic Stark effect, excited state depletion, population transfer and Rabi cycling. The coupling of these different physical processes makes it very difficult to extract accurate dynamic information. At the same time, the accuracy measurement of the relaxation process of quantum state is restricted by the experimental energy resolution because the absorption spectrum is sensitive to the photon energy. In order to study the XUVinduced dynamic process more accurately and effectively, it is necessary to separate the signal corresponding to a single nonlinear process and measure the transient mixing spectrum with back ground-free signal. As an ultrafast nonlinear spectroscopy,transient multi-wave mixing has been widely used in the generation of wavelength tunable coherence light source,detection of ultrafast dynamics of microscopic system, imaging microscopic system structures and other fields. The wavelength of the electromagnetic field used determines the spatial resolution of structural imaging and the time resolution of dynamic evolution tracing. With the rapid development of laser technology, the technology has been expanded from the traditional microwave regime to the visible and infrared regime.Extending this technique to shorter wavelengths will help us to study autoionization processes,molecular predissociation,inner shell electron transitions, charge migration in molecules,and UV-induced phase transitions in crystals that occur at more extreme spatio-temporal and energy scales. In recent years,with the development of attosecond light sources,nonlinear mixing spectroscopy with high time resolution in XUV has been explored. In 2016,Caoet al. studied the mixing process of high-order harmonic and near-infrared laser pulses in argon atoms.[114]It is found that the nonlinear mixing signals in XUV can be induced effectively in atoms when the weak high harmonic XUV light is synchronized with a high intensity near infrared laser. A metal film is used to filter out the high harmonics background signal in a specific regime, and the interference of the linear absorption and dynamic Stark effect is eliminated. The nonlinear signal without background signal is obtained. This signal corresponds to the four-wave mixing process of absorbing one XUV photon and two NIR photons and can be used to reveal the XUV-induced electron wave packet coherence. Based on this discovery, the same group also proposed a non-collinear optical path configuration to separate different mixing processes spatially.[115,116]When there is a small angle between the transmission directions of XUV attosecond pulse and NIR pulse (usually about 1◦), the phase matching condition can separate XUV signals generated by different multi-photon processes in space, and different nonlinear processes can be independently diagnosed through a simple spatial filtering process. It provides a potential scheme for the development of extreme ultraviolet multidimensional spectroscopy. Subsequent experimental and theoretical works further explored the application of this method in coherent detection and excited state lifetime measurement.[117–119]
3.4. Perturbed high harmonic spectroscopy
The high harmonic spectroscopy diagnoses photoinduced ultrafast processes by analyzing the high harmonic spectrum driven by a single intense laser beam. If an additional femtosecond laser beam (its frequency is generally in the visible band) is introduced in the process of high harmonic generation, the relative phase of the two interference arms in the process of high harmonic generation will be perturbed, thus affecting the energy, divergence angle and other properties of the high harmonics. For example, Zhenget al. demonstrated a scheme, by adding a weak second harmonic laser field to the driving laser field, to realize the continuous adjustment of the intrinsic chirp of HHG from negative to positive via simply adjusting the relative time delay between the two-color pulses.[120]If we can establish the quantitative relationship between the changes of these high harmonic properties and the physical quantities to be measured, we can extract rich dynamic information with attosecond time precision.In 2006, Dudovichet al. disturbed the attosecond pulse generation process by using a weak second harmonic field, and finally achieved all-optical measurement of attosecond pulse train.[121]The principle of the scheme is as follows: the nearinfrared pulse laser interacts with the atom.Due to the symmetry of the electric field,only odd harmonics are generated. At this time,introducing a weak second harmonic field will break the symmetry of the driving field and lead to even harmonics.The time information of the attosecond pulse radiation can be extracted from the oscillating phase of the even harmonics,and the time domain structure of the attosecond pulse can be reconstructed by means of one-to-one correspondence between the radiation time and the photon energy of high harmonic. In 2013,Kimet al.demonstrated an all-optical scheme to characterize attosecond pulses in the space–time domain.[122]In this scheme,the perturbation signal pulse intersects with the driving light at a small angle,and the divergence angle of high harmonics sensitively depends on the delay of the perturbing signal pulse. The spatiotemporal phase of the attosecond pulses in the far field can be completely measured using a spatiotemporal frequency-resolved optical gate (FROG) technique. In the same year, the group also used the perturbed harmonic generation spectroscopy based on non-collinear scheme to diagnose the waveform of femtosecond optical pulses. The noncollinear femtosecond pulse can change the far-field space deflection angle of attosecond pulse,which is correlated with the electric field of the space–time perturbation pulse radiated by the attosecond pulse. Therefore,the time-domain information of the femtosecond pulses can be directly extracted from the delay-dependent emitting angle of the attosecond pulses.[123]Wyattet al.and Carpeggianiet al. adopted different perturbed high-order harmonic spectroscopies to achieve accurate diagnosis of NIR pulse time-domain waveforms.[124,125]
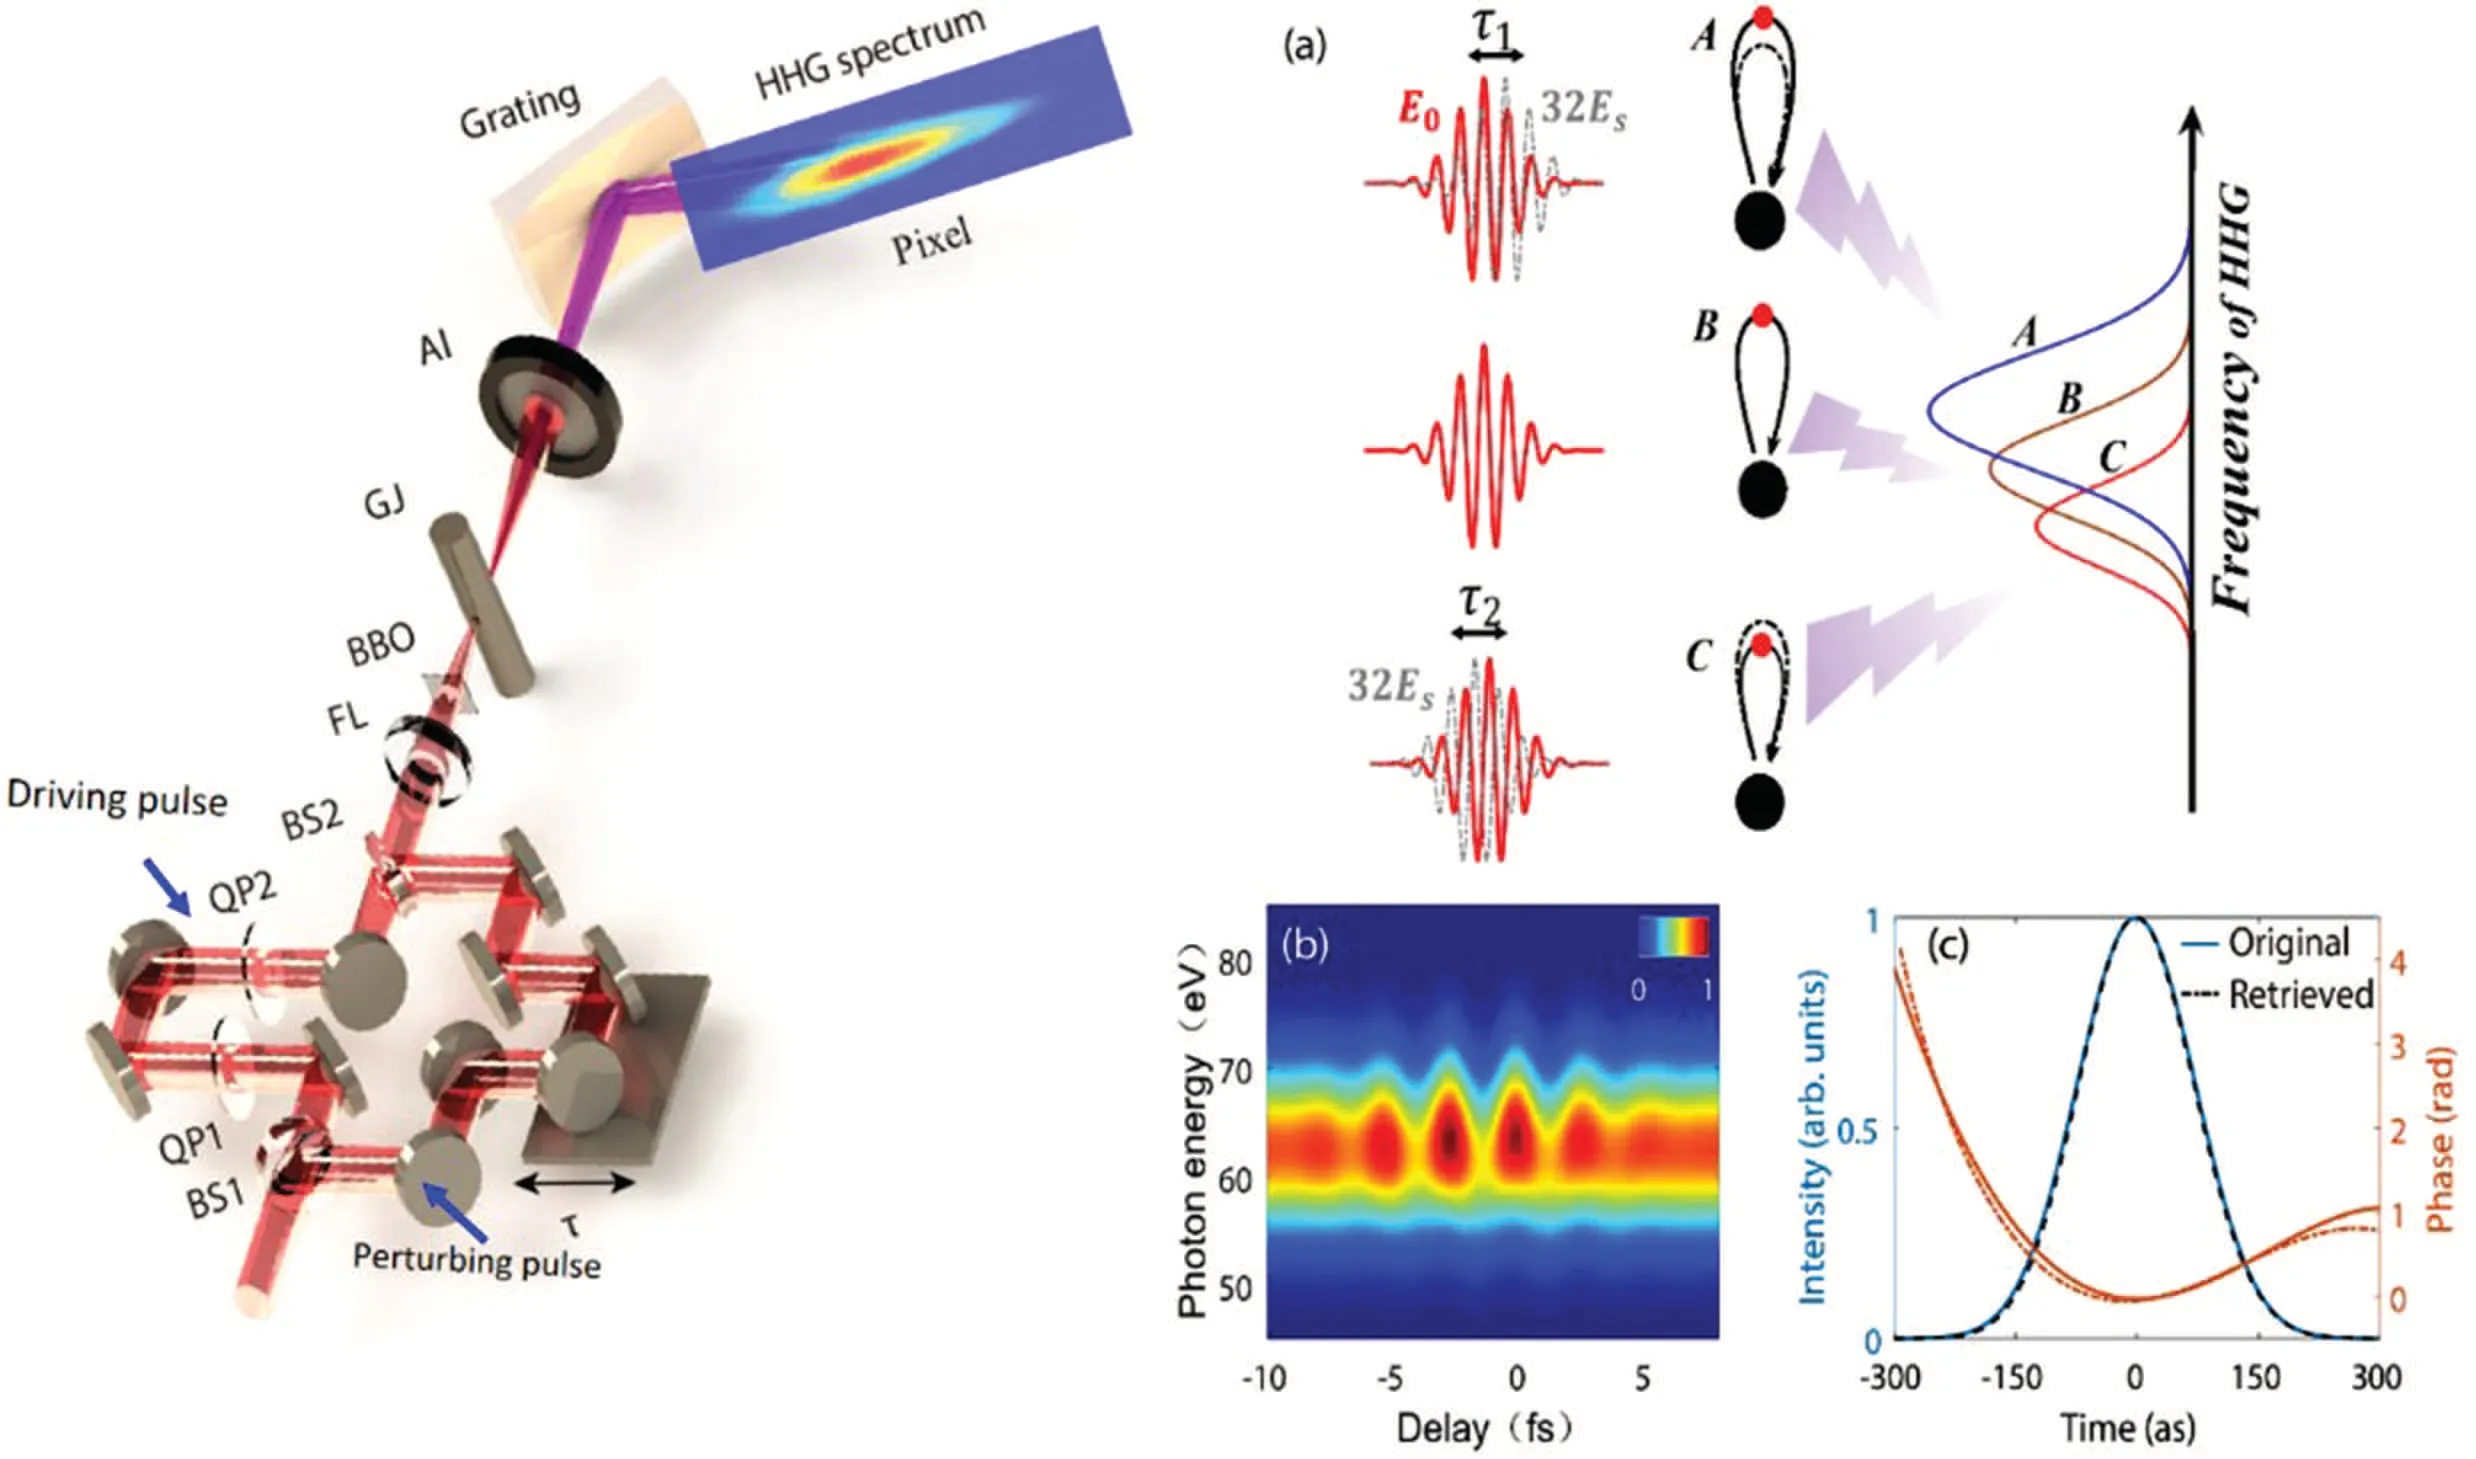
Fig.12. Principle and experimental setup of all-optical FROG for isolated attosecond pulse characterization.[126]
In 2020, Yanget al. proposed an all-optical diagnosis scheme for isolated attosecond pulses based on perturbed high harmonic spectroscopy.[126]The few cycle femtosecond pulse acts as a driving light and interacts with atoms to generate attosecond pulses. When another perturbed pulse with the same frequency as the driving field is introduced (the intensity is about 10−3of that of the driving pulse),the perturbed electric field will change the trajectory of the free electron and its accumulated phase so that the spectrum of the single attosecond pulse will be blue shifted or red shifted(as shown in Fig.12).When the intensity of the perturbation field is weak and only a single attosecond pulse is generated,the electric dipole moment can be written as

whered0(t) represents the electric dipole moment of the higher harmonic when only the driving field exists, andσrepresents the additional phase introduced by the perturbation field. Equation(4)is mathematically identical to a FROG trace,so the measured two-dimensional spectrum can be used to directly retrieved0(t),the time-domain structure of the isolated attosecond pulses. Compared with the traditional measurement scheme based on attosecond streak camera,[63]this scheme is a simple all-optical measurement method and therefore has a wider range of application.
In addition to its application in high time resolution measurement,high harmonic spectrum control schemes have also been extended to the precise measurement in time-energy domain recently. In 2020, Yanget al. invented an all-optical attosecond time-domain interferometer[127](Fig. 13). In this scheme, an attosecond pulse train driven by a strong laser is used as time interference slits,and a weak perturbation field is introduced to accurately control the time-domain wavefront of the interferometer,thus affecting the spectrum of the final high harmonics. Under the strong field approximation model, the frequency shift of a single harmonic can be expressed as[127]

HereE0andω0represent the amplitude and frequency of the driving field,Esis the electric field of the signal field, and∆is the interval of attosecond time slits. Equation (5) establishes the quantitative relationship between the harmonic frequency shift and the time domain waveform of the signal field,which can be used to measure the relevant physical quantities with high accuracy. The scheme has good energy resolution while retaining attosecond time resolution. Using the ultrahigh time resolution of this technology, Yanget al. successfully achieved the accurate measurement of the time-domain waveform of an arbitrary polarization laser field (middle column in Fig. 13). At the same time, using the unique energy resolution of the interferometer, the authors also carried out precise detection of the structural information of the particles. The two-dimensional spectrum in the upper right corner of Fig.13 shows the experimental results of argon,where the abscissa represents the spectral distribution of different order harmonics with the delay axis, and the reciprocal of its minimum position represents the time interval between two adjacent attosecond time slits. It is found that the attosecond time slits interval produced form neon is constant, while the attosecond time slits interval produced by argon has a slight jump around 45 eV.This is because the argon atom has more electron shells.The interference between different orbits(similar to the Cooper minimum in photoionization) results in a specific time-domain structure of the attosecond slits, which can be successfully detected by this interferometer.
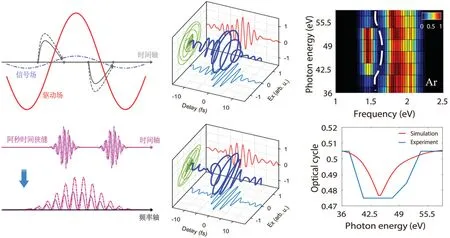
Fig.13. Principle and applications of all-optical time-domain attosecond interferometry.[127]
4. Recollision based self-probing high harmonic spectroscopy
HHG from atoms and molecules can be well understood by the semiclassical description known as three-step model.[4,128]This three-step process can be analogous to a pump–probe protocol,[7,129]where laser-induced ionization can be considered as a pump that triggers the electron dynamics in the ion,while the recolliding electron acts as a probe of the system that maps the information onto the properties of the high harmonic emission,e.g.,the harmonic intensity,polarization and ellipticity.
Compared to atoms, molecules have more complex geometric structures that will affect the electronic transitions in the HHG process. At the recombination step, the returning electron wave packet records the molecular information onto the harmonic spectrum, manifesting as some distinctive features in the HHG spectra. For instance, the well-known twocenter minimum in molecular HHG due to the destructive interference between emissions from the two atoms that are spatially separated within the molecule,was first predicted in theory by Lein in H2[130]and H+2[131]and verified by latter experiments on HHG from aligned CO2molecule.[132,133]This self-probing character of high harmonic spectroscopy (HHS)has opened up an avenues for studying molecular structure and dynamics with ultrahigh temporal and spatial resolutions and has received extensive interest in the past 20 years.
In this section,we review the applications of HHS in ultrafast molecule detection,including the molecular orbital tomography(MOT),the probe of sub-femtosecond nuclear motion, and the reconstruction and laser control of attosecond charge migration in molecules.
4.1. Molecular orbital tomography
Laser control of molecular alignment[134,135]in experiment provides an avenue to accessing the molecular structure and dynamics in molecular frame. With the molecules aligned at different angles, the generated harmonics will contain the information about the transition dipole matrix elements. This angle scan is similar to the CT scan in medicine, from which an image of the bound state wavefunction of the molecule can be reconstructed from the angular projections. Reconstructing molecular bound state wavefunction from the angleresolved HHG is also termed as molecular orbital tomography(MOT).[136]
The basic principle of MOT is based on the factorization of HHG in frequency domain,[7,128,137]i.e.,D(ω,θ)=aion(ω,θ)aacc(ω,θ)d(k),(6)whereθis the molecular alignment angle with respect to the driving-field polarization.aion(ω,θ) is the tunnel ionization amplitude,aacc(ω,θ)represents the propagation amplitude of the recolliding electron wave packet in the continuum, andd(k)=〈ψ0(r)|r|ψc(r)〉is the transition dipole matrix element between the initial orbitalψ0(r)and the continuum wave functionψc(r). In experiment,to extract the transition dipoled(k)from the measured harmonic signals, one should determine the prefactors in Eq. (1) first. This can be achieved by measuring the harmonic emission from a reference atom that has the same ionization potential with the molecule.By measuring the amplitudes and phases of the harmonics generated from the molecule and reference atom, the molecular transition dipoled(k)then can be obtained by

Here,Amo,Aref,φmo, andφrefare the amplitudes and phases of the harmonics generated from the molecule and reference atom, respectively. The scaling factorη(θ) stands for the angle-dependent tunnel ionization amplitude in the molecule,which can be calculated according to the molecular ADK model.[138–140]The harmonic amplitudesAmoandArefcan be directly obtained from the measured harmonic signals. The recombination dipole matrix elementdref(k) of the reference atom can be known from theory. Under the plane-wave approximation,the continuum wave functionψc(r)can be written asψc(r) = eikr. Withdmo(k) determined,rψ0(r) and hanceψ0(r) can be reconstructed by performing the inverse Fourier transform ofdmo(k).
MOT was first demonstrated by Itataniet al. in 2004,[136]where the highest occupied molecular orbital(HOMO)of N2was reconstructed by measuring the harmonic spectra with the driving laser polarization rotated from 0◦to 90◦in steps of 5◦with respect to the molecular axis and also the spectrum from the reference atom Ar under identical laser conditions(see Fig.14(a)).The reconstructed orbital(both amplitude and phase) is in reasonable agreement with theab initiocalculation (see Figs. 14(b) and 14(c)). Note that in Ref. [136], the relative phases of the generated harmonics, which are crucial for the reconstruction, are given by the first-principles calculations. In 2010,Haessleret al.[141]have performed MOT on N2but with the harmonic phases measured by the RABITT technique. Based on the symmetries of the orbitals of N2,the HOMO and HOMO-1 were simultaneously imaged from the real and imaginary parts of the emission dipole moment. Even so, it is still a formidable challenge to measure the full phase map of molecular HHG as a function of the harmonic orders and also the molecular alignment angles. In 2011, Vozziet al.[142]developed a phase retrieval algorithm to determine the angular dependence of the harmonic phases from the measurement and demonstrated the retrieval of the HOMO orbital of CO2by applying a generalized molecular orbital tomographic procedure.Furthermore,in 2017,Zhaiet al.[143]demonstrated a diffractive MOT method to retrieve the molecular orbital from the amplitude-only measurements without any phase information.
Since it was proposed, MOT has attracted wide interest but also provoked a spirited controversy.[137,144,145]The root of this controversy arises from the basic assumptions and the interpretation of the results. For example, MOT mostly uses the plane-wave approximation treating the ionized electron as plane waves.Under this approximation,the transition dipole is given in the form of Fourier transform of the HOMO weighted by the dipole operator and the molecular orbital can be directly reconstructed by performing the inverse Fourier transform of the dipole moment. However, the plane-wave approximation has a priori inadequate the low-energy region from several tens to 100 eV where the HHG experiments are usually performed.It has been demonstrated that the Coulomb potential of the parent ion will distort the continuum wave function and further influence the features of the generated harmonics.[146–148]Then the accuracy of MOT would be markedly affected.[149]To overcome the defect of the plane-wave approximation, Liet al.[150]developed a Coulomb-corrected method to retrieve the molecular orbital by directly utilizing the molecular continuum wavefunction. By using a two-center Coulomb(TCC)wave[151]as the continuum wave function, the HOMO of N2was well reproduced in theory. This method was later applied to experimental data,[152]which was demonstrated to effectively eliminate the artificial structures induced by the planewave approximation(see Fig.15).
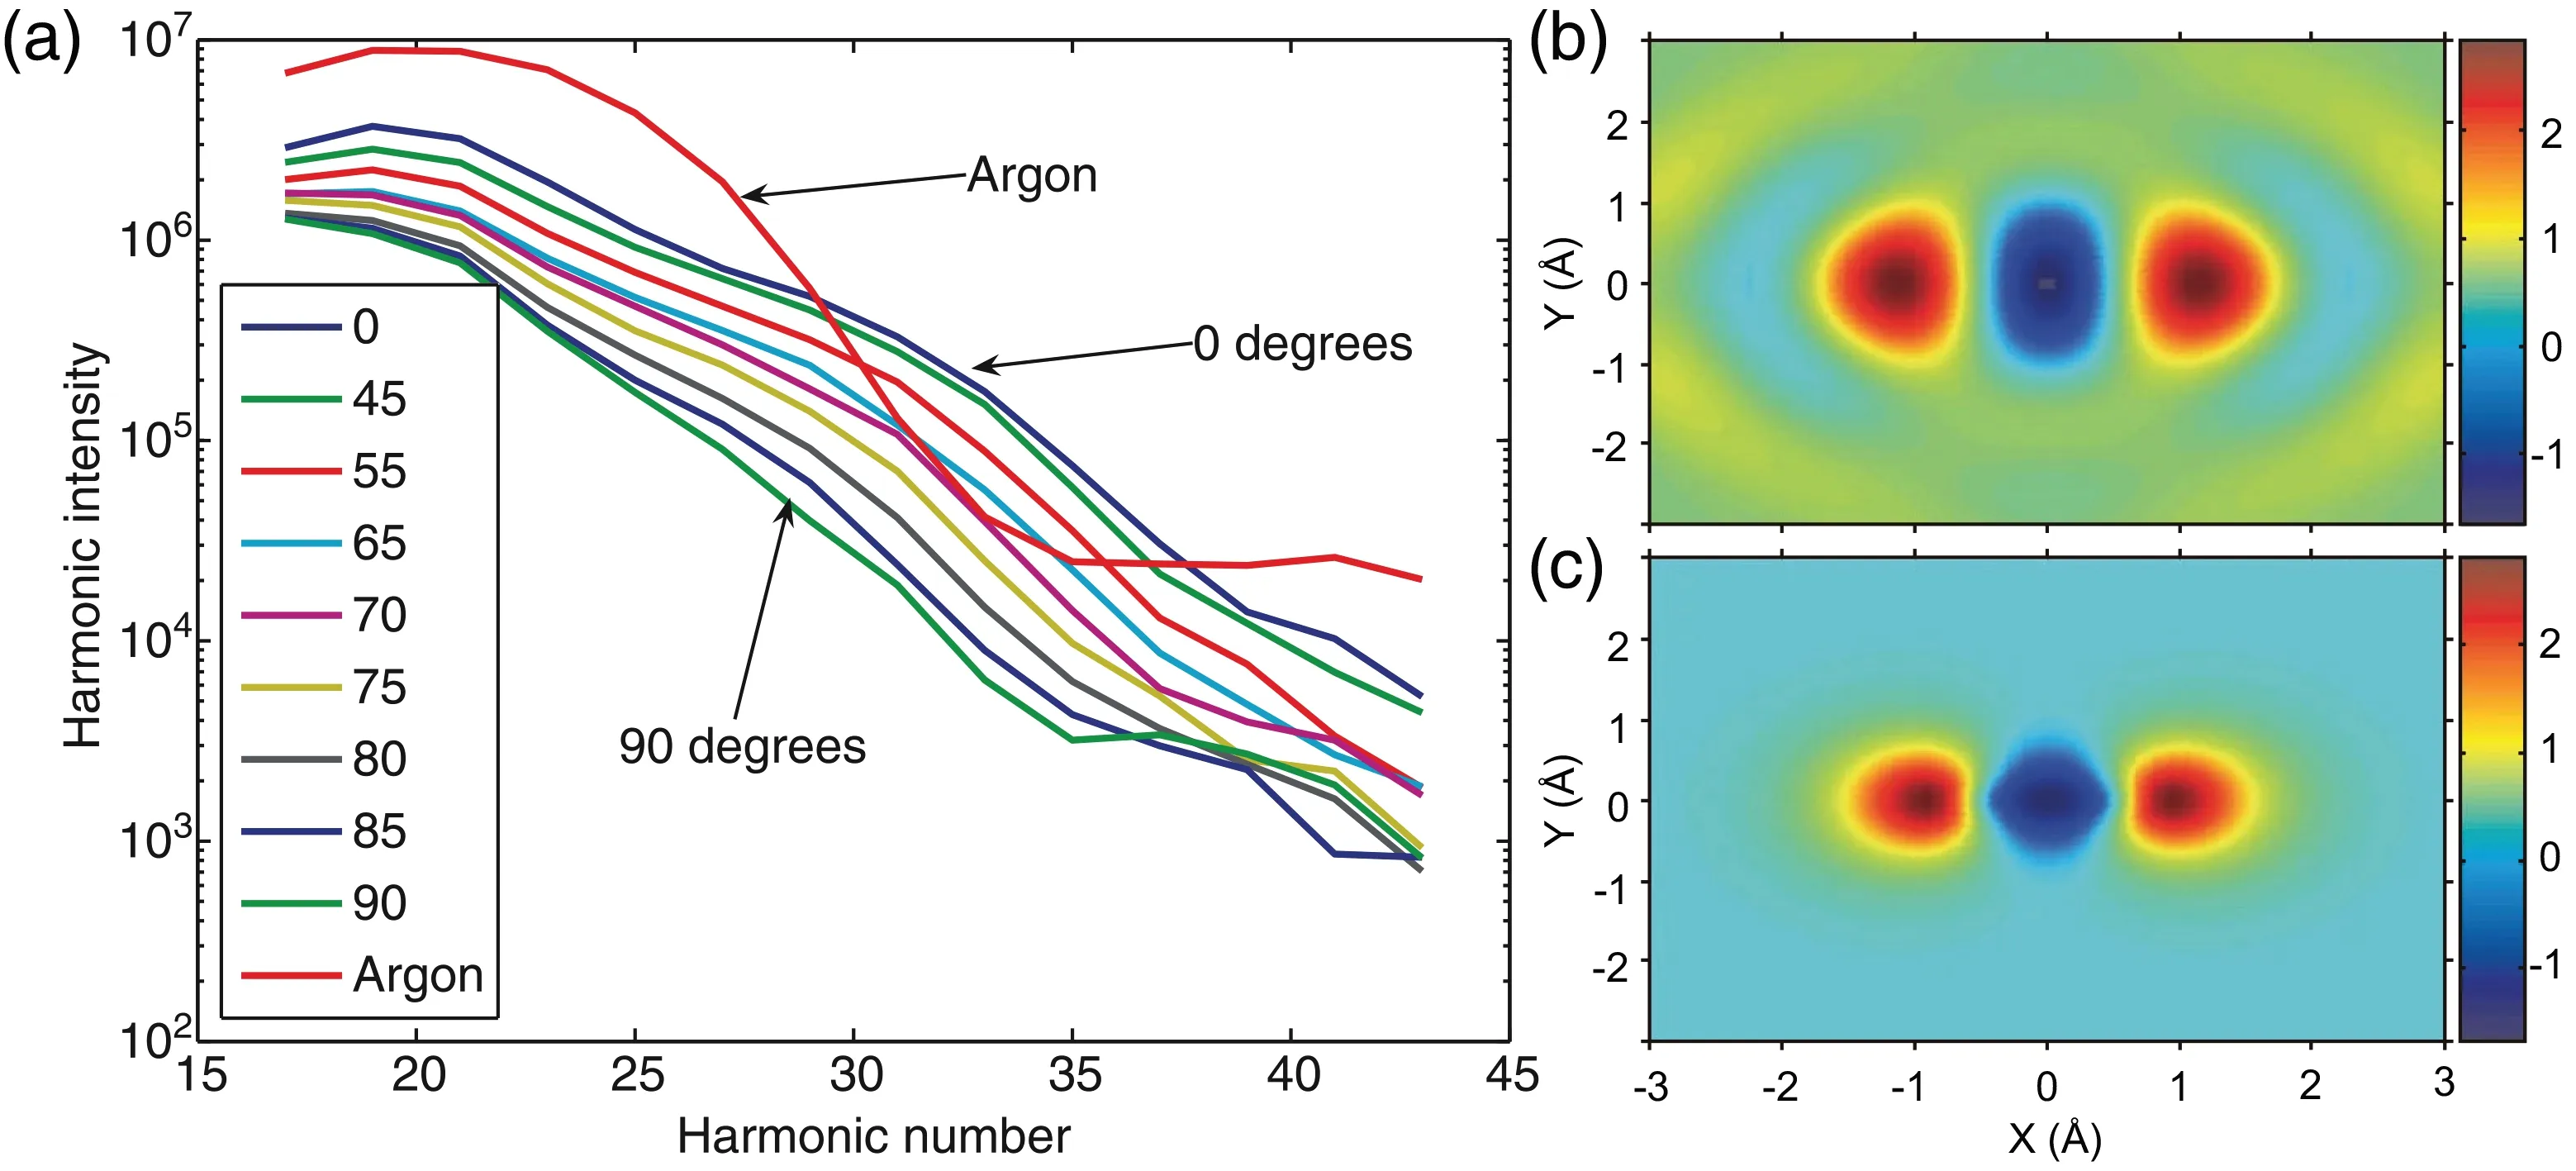
Fig.14. (a)Experimentally measured harmonic spectra from N2 molecule and its reference atom argon. (b)Reconstructed wavefunction of the HOMO of N2. (c)The ab initio calculation of the HOMO orbital of N2. This figure is adapted from Ref.[136].

Fig. 15. (a) The Hartree–Fock (HF) orbital of HOMO of N2 filtered for the experimental samplings. (b) Plane-wave reconstruction of the HOMO of N2. (c)Coulomb-corrected reconstruction of the HOMO of N2. This figure is adapted from Ref.[152].
4.2. Observing the nuclear motions
In addition to the static electronic structures,the inherent pump–probe mechanism underlying molecular HHG also allows one to capture the ultrafast molecular dynamics within sub-optical cycle. The temporal resolution of this unique pump–probe process arises from the intrinsic frequency chirp of harmonic emission, i.e., different harmonic orders are associated with well-defined ionization–recombination delays spent by the electron in the continuum(see Fig.16). According to the recollision model,[4]there are two trajectories, i.e.,the so-called short and long trajectories,per optical half cycle contributing to each individual harmonic order(see Fig.16).If one of the trajectories can be selected in experiment,the oneto-one map between the harmonic order and the time can be built. Then the temporal measurement can be achieved.
In 2005, Lein has demonstrated in theory the application of HHS to probe the attosecond nuclear dynamics in isotopic molecules H2and D2.[153]When the neutral molecule is ionized by the intense external laser field, in addition to the continuum motion of the electron, the nuclear vibrational dynamics can be also initiated in the remaining parent ion. The generated HHG intensity is proportional to the squared modulus of the nuclear autocorrelation function,C(τ)=∫χ(R,0)χ(R,τ)dR,whereχ(R,0)andχ(R,τ)are the vibrational wavepackets in the molecular ion at the ionization and recombination moments, respectively.Ris the internuclear distance, andτis the excursion time of the electron between ionization and recombination.C(τ)denotes the overlap between the initial and final nuclear wave function that evolves from the moment of ionization until the point of recombination. The different nuclear masses of the isotopic molecules give rise to different nuclear vibrational motions and then a difference in the harmonic intensity of the isotopic molecules.Lein[153]has theoretically demonstrated that the sub-cycle nuclear dynamics in H+2and D+2can be inferred from the difference in the harmonic intensities if only one electron trajectory is taken into account.

Fig. 16. Time-frequency mapping underlying the HHG process. The upper panel shows the classical electron trajectories. The lower panel plots the one-to-one mapping between the harmonic orders and the excursion time of the short-and long-trajectory electrons.
In 2006,Bakeret al. carried out HHG experiment on H2and D2molecules by using an 8-fs,775-nm driving laser.[154]By placing the gas jet 9 mm after the laser focus,the contribution of the short trajectory was isolated,yielding a one-to-one mapping between the time and harmonic order(Fig.16). Figure 17(a)shows the harmonic spectra of D2and H2recorded in experiment. The ratio of the measured HHG yields of these two isomers as a function of the excursion times(harmonic order)of the short trajectory electrons in the continuum is plotted in Fig.17(b). One can see that due to the slower nuclear motion in the heavier isomer,the HHG yield in D2is higher than that in H2, namely, the HHG ratio (D2:H2) is larger than 1.Moreover, the HHG ratio exhibits a monotonic increase with the time (harmonic order). These experimental results show good quantitative agreement with the calculated ratios of the nuclear correlation functions [blue line in Fig. 17(b)]. From the measured intensity ratios of the harmonics, the time evolution of the expectation value of the nuclear distance〈R〉in each molecule was further reconstructed by using a genetic algorithm. As shown in Fig. 17(c), the reconstructed subcycle nuclear dynamics (red lines) agree well with the theoretical calculations (blue lines). According to the time-tofrequency mapping discussed in Fig.16,the temporal resolution in the measurement is set by the difference of the recollision times associated with two successive harmonic orders,which can reaches∼100 as for an 800 nm driving laser. This approach has also been extended to more complex molecules CH4(CD4), and was later applied to NH3(ND3)[155–157]and H4O(D4O).[158]Other works have also been reported to gain access to the phase of the nuclear wave packet with the HHSbased methods.[159,160]
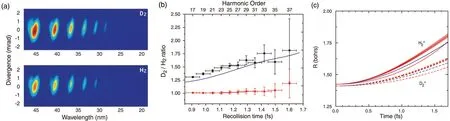
Fig.17. (a)Experimentally measured HHG spectra in D2 (top)and H2 (bottom). (b)Ratio of harmonic peak intensities for D2 and H2 (black).The red lines represent the outcome of a control experiment in H2. The blue line plots the ratio obtained from theoretical calculations for comparison. (c)The nuclear motion reconstructed from the experimental data by multiple runs of a genetic algorithm(red lines)for H+2 and D+2. Blue lines are the calculations using the exact Born–Oppenheimer potentials for H+2 and D+2. This figure is adapted from Ref.[154].

Fig.18. (a)–(c)Experimentally measured trajectory-resolved harmonic spectra from D2 and H2. (d)–(e)Temporal evolution of the internuclear distance of D2 and H2 retrieved from the short and long trajectory harmonics,respectively. This figure is adapted from Ref.[164].
In this HHS method, the wavelength of the employed driving laser sets an upper limit of the temporal window in the measurement, which is about 1.6 fs for an 800-nm driving field. The use of a longer driving wavelength can extend the temporal window,for instance,a 2µm driving laser would allow to follow the nuclear motion up to 4 fs after ionization.The larger temporal window is a prerequisite for observing nuclear dynamics of heavier nuclei. In 2011,experiments on the H2/D2have been carried out by 1.3µm driving laser by Mizutaniet al.[161]On the other hand, the extension of the temporal window can also be achieved by selecting of the long trajectory of the electrons for harmonic emission due to the much longer excursion time of the electron. Based on the transient phase-matching mechanism[162,163]of HHG, Lanet al. demonstrated that under proper experimental conditions,the long trajectory can be better phase matched on the leading edge of the laser field,while the short trajectory is favored on the falling edge.[164]Owing to the nonadiabatic effect induced by the time-dependent laser intensity, HHG dominated at the leading or trailing edge of the laser pulse will be blue-shifted or red-shifted.[165–167]Then the short and long trajectories can be effectively separated in the frequency domain, yielding a two-peak structure of each harmonic [see Figs. 18(a)–18(c)].Besides,due to the larger phase coefficient of the long trajectory, the phase matching angle for the long trajectory is also larger. Thus the short and long trajectories can be easily distinguished in the spatial domain. This trajectory-resolved harmonic spectrum enables one to build the one-to-one map between the harmonic frequency and time for both the short and long trajectories. In Ref. [164], the separated short and long trajectories have been simultaneously employed to retrieve the laser-induced nuclear dynamics in isotope molecules H2and D2. As shown in Figs. 18(d) and 18(e), the use of the long trajectory has effectively extended the temporal range of the measurement to one optical cycle. Moreover,this method has also been extended to CH4and NH3molecules.
The above works are based on the amplitude modulation induced by the laser-driven nuclear motion in the harmonic spectra. In addition to the amplitude modulation, Bianet al.[168]have predicted in theory that, the laser-driven nuclear motion can also lead a frequency modulation in the harmonic spectra. The root cause of this frequency modulation arises from the sensitive dependence of the ionization rate on the internuclear distanceR. Owing to the laser-driven nuclear motion, the average internuclear distance at the trailing edge of the laser field can be larger than that at the leading edge,which makes the ionization, as well as the HHG signals stronger at the trailing edge, and then leads a nonadiabatic red shift in the harmonic spectrum. Bianet al. theoretically predicted the red shift in HHG from H+2and D+2.[168]Later on, Heet al.[169]reported the first observation of the red shift in HHG from H2and D2[see Fig. 19(a)]. It was found that HHG from H2and D2presented obvious red shift with respect to those from Ar atom. Moreover, for D2, the frequency shift is larger than that of H2. These experimental observations are in good agreement with the theoretical simulations based on the non-Born–Oppenheimer time-dependent Schr¨odinger equation(NBO-TDSE)[see Fig.19(a)]. By using a linear harmonic oscillator model, the nuclear vibrations of H2and D2are further successfully retrieved from the observed frequency shift[see Figs.19(b)and 19(c)]. It should be explained that in the above studies of the amplitude modulation,[153–158,161,164]the intensity ratios of HHG from isotopic molecules reveal the nuclear dynamics within the time window from ionization to recombination moment, namely, an intracycle dynamics. While,in the works of frequency modulation,[168,169]the observed frequency shift provides a monitoring of the nuclear dynamics at each ionization moment, which is an intercycle dynamics. The frequency modulation in molecular HHG reveals a different physical process and is complementary with the method based on the amplitude modulation.
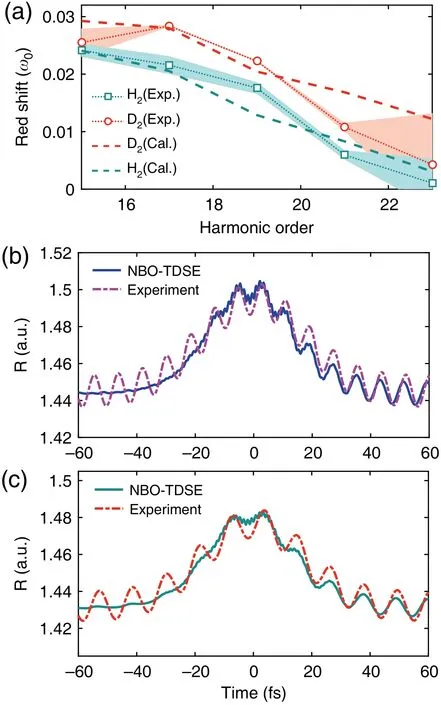
Fig.19. (a)Measured and calculated red shift in HHG from D2 and H2.(b) Calculated (solid line) and experimentally retrieved (dash-dotted line) nuclear vibration of H2. (c) Same as (b), but for D2. This figure is adapted from Ref.[169].
4.3. Filming the molecules movies of electron motion
Charge migration in molecules is one of the central phenomena in numerous chemical and biological processes.[170–173]Following this ultrafast dynamics is of crucial importance for understanding, and even ultimately steering the complex chemical and biological reactions. However,the natural timescale of a migration motion ranges from few-femtoseconds down to hundreds of attoseconds,which requires an extremely high temporal resolution and has been a formidable challenge for previous laser techniques. In this century, the advent of attosecond pulses based on HHG shed lights on the ultrafast detection, inaugurating a new domain for time-resolved metrology.[8,174,175]Combining the attosecond pulse with a femtosecond infrared(IR)pulse in a pump–probe scheme,the first evidence of charge migration in a biorelevant molecule (phenylalanine) was obtained by Calegariet al.[172]In their work, the charge migration was initiated by a sub-300-as pump pulse,with the photon energy between 15 eV and 35 eV, and probed by a waveform-controlled IR pulse with sub-4 fs pulse width subsequently. A fast modulation of the phenylalanine dication yield revealed the charge migration process. However, due to the use of the IR pulses,the temporal resolution in this experiment was limited to a few femtoseconds.
As mentioned above, the HHG posses rich information of molecular structure and electronic dynamics on singlemolecule level. After strong-field tunneling ionization,a parent molecular cation with electronically excited states is left.Since the molecular ionic excited states have close energy separations, the coherent superposition of these states will lead to complex multielectron dynamics (i.e., charge migration)within the cation. During the HHG process, the different excited states of the cation serve as the intermediations that linking the same initial and final state of the system,and providing different channels for harmonic radiations.[176–179]The temporal evolutions of the created ionic states are encoded in the emissions of the related channels. Eventual harmonic signal is a consequence of the interference of these channels,which thus naturally records the underlying electron dynamics.
The first visualization of charge migration based on HHS technique was achieved on iodoacetylene by Krauset al.[180]To reconstruct the charge migration,the iodoacetylene molecule was first impulsively oriented in space. The orientation behavior breaks the inversion symmetry of the HHG process, leading to the emission of both even and odd harmonics. The ratios of even-to-odd harmonic intensities bring the phase difference of emitted HHG with different harmonic order which was recorded in the experiment. Since the ionic states are coherently prepared, an disentanglement of them is essential. To this end,several other observables,including the emission intensity ratios and phase difference between aligned and anti-aligned molecules,were measured. With these quantities, the populations and phases of the involved ionic states in iodoacetylene cation can be retrieved and eventually the charge migration can be reconstructed. By using probe pulses at 800 nm and 1300 nm, charge migration in iodoacetylene within the observation windows spanning 0.9–1.5 fs and 1.3–2.2 fs was observed. It was found that when the molecule is perpendicularly aligned to the laser polarization, the hole created by ionization is initially localized on the iodine atom,then delocalizes over the internuclear axis and localizes at the acetylene end after 930 as (see Fig. 20), which corresponds to a field-free case. While for the parallel alignment,the hole dynamics is strongly influenced by the laser field, offering a possibility to exert control over the charge migration process.
In HHS,the molecular-frame dynamics is encoded in the harmonic emission on single-molecule level. Resolving the internal dynamics usually requires a thorough knowledge of the harmonic amplitude and phase of the single-molecule response. However,experimentally,the molecular ensemble can never be perfectly aligned.[134,135]The measurement is a coherent superposition of individual emissions from molecules aligned at different angles. The coherent average over molecular alignment distribution would deviate from the real singlemolecule response,[181,182]which in turn will reduce or even destroy the accuracy of the reconstruction. Thus, disentangling the internal angular coherence from the measurements is crucial for HHS. However, such reconstruction is fairly painstaking. In most previous works, this internal coherence has been addressed either under the prefect alignment approximation by neglecting the angle dependence[141,142](i.e.,simply assigning the measurement to the response of the molecule with maximal distribution probability) or with an incoherent treatment by leaving out the harmonic phases.[182]Such processing has neglected the most important coherent nature of HHG.The critical deconvolution has never been properly addressed in previous publications of HHS.

Fig.21.Experimentally reconstructed charge migration in CO2 molecule for the parallel alignment with respect to the driving laser polarization.This figure is adapted from Ref.[183].
Very recently, Heet al.[183]demonstrated that by using a modern machine-learning (ML) algorithm, the alignmentangle-dependent single-molecule dipole moments of HHG can be coherently retrieved from the harmonic signals measured at different pump–probe delays. Combining the ML algorithm with a two-color driving scheme,the multichannel electron dynamics underlying the HHG process are further resolved from the harmonic signals measured at different relative phases of the two-color fields. As a consequence,movies of attosecond charge migrations in N2and CO2molecules are constructed with a temporal resolution of sub-50 as(see the result of CO2in Fig. 21 as an example). Meanwhile, the angular dependence of the migration dynamics is also resolved(see Fig.22).The reconstructed results suggest that the electron holes do not just “migrate” along the laser polarization direction, but may“swirl” around the atom centers. Finally, we want to emphasize that the method of retrieving single-molecule parameters used in Ref.[183]should be extended to other ultrafast experiments, including the MOT, time-delays, photoelectron momentum spectra and so on,and for any gas-phase target where the experimental data are always resulting from coherent or incoherent superposition of signals from individual single fixedin-space molecules weighted by the angular distribution of the molecules.

Fig.22. Experimentally reconstructed angle-resolved charge migrations in CO2 molecule. This figure is adapted from Ref.[183].
5. Conclusion
In this review, we have outlined the progress of attosecond pulse generation and attosecond spectroscopy for filming ultrafast movies of nuclear and electronic dynamics. By far,the shortest pulse duration obtained in experiments is 43 as,approaching one atomic unit. The highest photon energy has reached 600 eV and the pulse energy has reached 1.3µJ,which is strong enough to initiate nonlinear responses.There are typically two scenarios to achieve the attosecond spectroscopy:one is based on the pump–probe detection utilizing the attosecond pulses and the other one is based on the self-probing process in HHG. Both complementarily provide unprecedented powerful tools enabling people to gain deeper insight into the underlying physics in the microscopic world.Although this review focuses on the HHG from gases,we also note that HHG from solid[184–189]and liquid[190–192]phases has attracted increasing attention and dramatic process has been made in recent years,which will substantially inspire new techniques to study the ultrafast dynamics in condensed matter.
Acknowledgement
Project supported by the National Natural Science Foundation of China(Grant Nos.12021004 and 91950202).
猜你喜欢
杂志排行

Chinese Physics B的其它文章
- Fault-tolerant finite-time dynamical consensus of double-integrator multi-agent systems with partial agents subject to synchronous self-sensing function failure
- Nano Ag-enhanced photoelectric conversion efficiency in all-inorganic,hole-transporting-layer-free CsPbIBr2 perovskite solar cells
- Low-voltage soft robots based on carbon nanotube/polymer electrothermal composites
- Parkinsonian oscillations and their suppression by closed-loop deep brain stimulation based on fuzzy concept
- Temperature dependence of spin pumping in YIG/NiO(x)/W multilayer
- Interface effect on superlattice quality and optical properties of InAs/GaSb type-II superlattices grown by molecular beam epitaxy