Parkinsonian oscillations and their suppression by closed-loop deep brain stimulation based on fuzzy concept
2022-12-28XiLeWei魏熙乐YuLinBai白玉林JiangWang王江SiYuanChang常思远andChenLiu刘晨
Xi-Le Wei(魏熙乐), Yu-Lin Bai(白玉林), Jiang Wang(王江), Si-Yuan Chang(常思远), and Chen Liu(刘晨)
School of Electrical and Information Engineering,Tianjin University,Tianjin 300072,China
Keywords: deep brain stimulation, Parkinson’s disease, basal ganglia, closed-loop control, variable universe fuzzy
1. Introduction
Parkinson’s disease(PD)is a common neurodegenerative disease in people over 60 years of age.[1]The most obvious symptoms of PD patients are tremor,limb rigidity,hypokinesia,and gait abnormalities.[2]The most common therapy in the early stages of the disease is pharmacological treatment with levodopa(L-DOPA).[3,4]However,side effects such as muscle tremors and rigidity may appear after taking L-DOPA for 3–5 years.[5]In this stage, deep brain stimulation (DBS)[6–8]can effectively reduce symptoms in PD.[9–12]DBS is a neurosurgical procedure in which electrodes are implanted at specific locations in the brain and the implanted battery power provides a constant or interrupted current.[13,14]The electrodes deliver electrical stimulation to the target regions. As an established clinical therapy, DBS is not only an effective treatment for movement disorders of PD patients but also being applied to the treatment of Depression,Dystonia and Tourette syndrome.[14]
Currently, the open-loop DBS is widely used in clinical. Stimulus parameters have a great influence on the stimulation effect but it will take a long time to find the appropriate parameters. The open-loop configuration fails to adapt to the changes in symptom severity and the other variations of brain. In addition, constant stimulation may lead to excessive stimulation, shorten the battery life, and reduce the stimulation efficiency.[15,16]Consequently, developing a new form of closed-loop or adaptive DBS is an effective method to address these limitations.[17]Compared to open-loop DBS,closed-loop DBS allows one to monitor the patient’s pathological status according to the neurophysiological signals,and to adjust stimulation based on the feedback.[1,16]Hamaniet al.used a closed-loop system to automatically adjust the stimulation parameters and thus reduced the side effects of the stimulation in patients with PD by 19%.[18]Littleet al.applied adaptive DBS according to an empirically determined threshold as feedback achieving motor improvement and the energy consumption has reduced by 50%.[19]
The feedback information is one of the greatest challenges in the closed-loop DBS. A biomarker, closely related to the patient’s pathology, is needed to be found. Local field potential recordings show that DBS or the application of LDOPA suppresses beta band synchronized oscillations.[20–22]Many studies used the beta band (12–35 Hz) signals as the biomarker.[16,23–25]However, electrophysiological investigations have shown that the pathological oscillations in the 4–8 Hz are also associated with tremor symptoms.[26,27]Thus,the closed-loop DBS only using the beta band(12–35 Hz)signals as the biomarker is insufficient. It is reasonable to apply closed-loop DBS based on the original local field potential signals.
Many control strategies have been applied to closed-loop DBS.[28,29]Pyragaset al.proposed a proportional-integralderivative (PID) control strategy by utilizing a configuration with an observed and stimulated subsystem to desynchronize the globally coupled oscillatory networks.[30]The biomarker is the mean field of the observed subsystem. Dunnet al.applied the PID control strategy to the closed-loop DBS system.[25]However,it takes a long time to deregulate the parameters of PID control,and parameters need to be re-adjusted as PD states changed. This means that a group of parameters cannot work well under different PD states, which may even cause distress for the patients.
Currently, the adjustment of DBS parameters for PD patients needs to be performed by experienced physicians and can only act on the treatment of a single situation. It may take a long time and may also have side effects. Fuzzy concept control uses the same cognitive methods to make the controller adjust the parameters like an experienced doctor. It may automatically adjust the stimulation waveform according to various Parkinsonian states based on human thinking. In addition, our previous work has tested the fuzzy control and demonstrated that it plays a propound role in restoring the abnormal relay reliability of thalamocortical neuron.[31]Thus,to further facilitate a closed-loop DBS,a variable universe fuzzy control strategy to incorporate DBS is proposed in this work,which aims at enhancing the modulation efficiency of PD oscillations.
The main remainder of the paper is organized as follows:Section 2 describes a computational network model of PD and the design of the controller.Section 3 shows the control effects and compares the performance of the variable universe fuzzy controller and the fuzzy controller. The conclusions are given in Section 4.
2. Models and methods
2.1. Models of cortico-basal ganglia-thalamic neural network
A cortico-basal ganglia-thalamic neural network model is constructed,as shown in Fig.1.The basal ganglia mainly consists of three parts, i.e., subthalamic nucleus (STN), external globus pallidus(GPe)and internal globus pallidus(GPi). The cortex mainly consists of two parts, i.e., pyramidal neurons(PY) and interneurons (IN). In our model, each population containingN= 100 single-compartment Izhikevich neurons is connected by various excitatory and inhibitory synapses sparsely. Red arrows indicate excitatory projections,and blue arrows indicate inhibitory connections. Figure 1 shows the details of the synaptic connections of the population, where each STN neuron receives inhibitory projections from two randomly selected GPe neurons and excitatory projections from two randomly selected PY neurons.Each GPe neuron receives inhibitory inputs from two randomly selected GPe neurons and excitatory inputs from three STN neurons. The GPi neurons receive excitatory inputs from three randomly selected STN neurons and inhibitory input from a single GPe neuron. Each thalamic(TH)neuron receives inhibitory inputs from a single GPi neuron.The PY neurons receive not only excitatory inputs from five randomly selected TH neurons but also inhibitory input from an IN neuron.
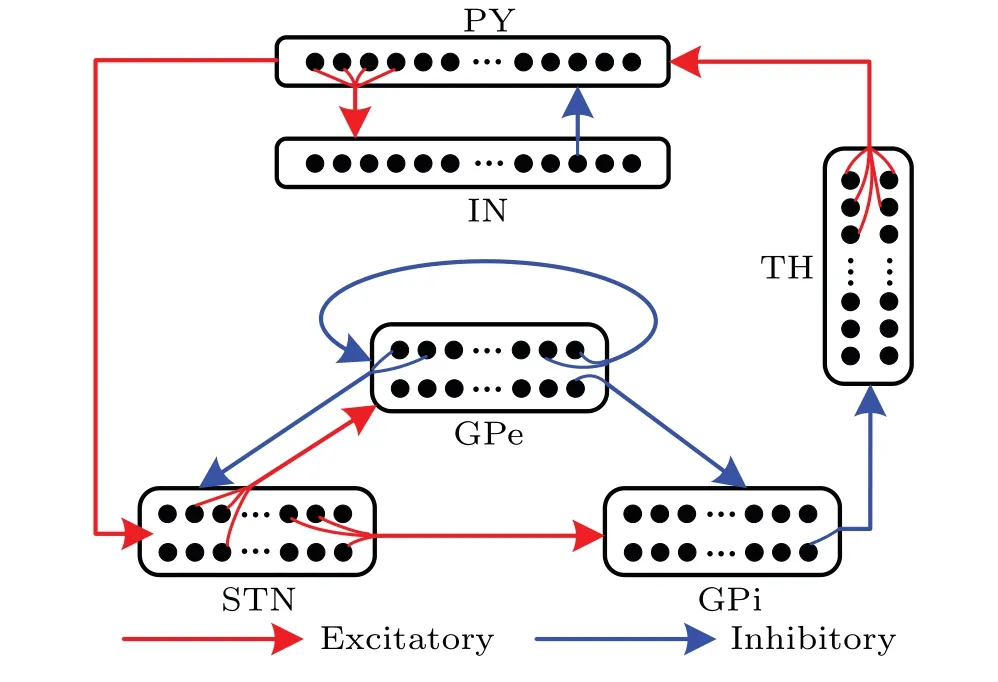
Fig. 1. Detailed connection of basal ganglia-thalamo-cortical network model.
A hybrid Izhikevich neuron model, computationally less expensive than a biophysical model and suitable to capture various firing activities, is used to simulate every single neuron. The model combines a set of spike functions and a discontinuous after-spike reset. The equations of the model are given in the following form:[32]
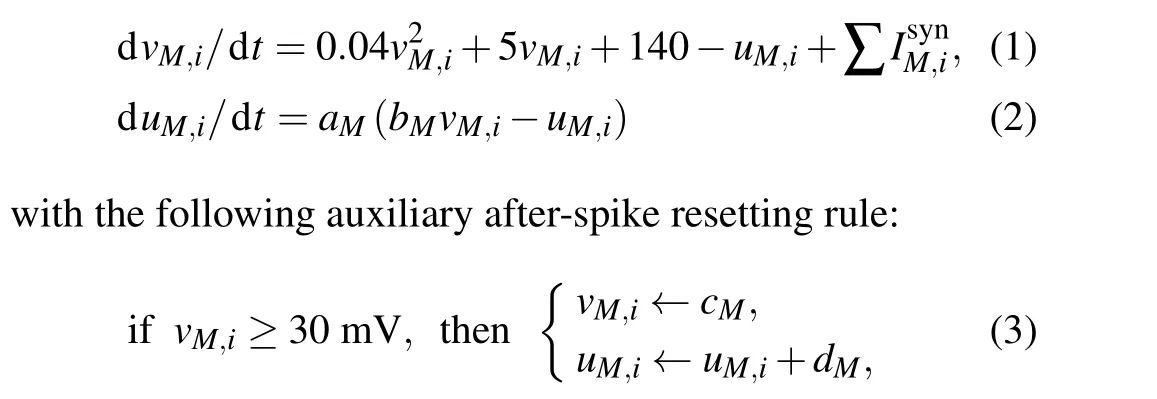
where (M,i) represents theith neuron in theMnucleus withi=1, 2,..., 100 andM ∈{STN, GPe, GPi, TH, PY, IN};vis the membrane potential anduis a recovery variable that provides negative feedback tov. Moreover,vanduare reset according to Eq. (3) whenevervexceeds the threshold (i.e.,30 mV).
Four dimensionless model parametersaM,bM,cM, anddMcan be combined to characterize the dynamics for each neuron in the nucleusM. The time scale ofucan be determined by parameteraMand the sensitivity ofuto the subthreshold fluctuations ofvcan be determined by parameterbM.More specifically,a largeraMleads to a faster recovery and a small value ofbMshows the coupling betweenvandu.

wheregJ→Mdescribes the strength of the synaptic coupling intensity withJ,M ∈{STN,GPe,GPi,TH,PY,IN}. The values ofgJ→Mare different in normal and PD states based on the biological details. The parameterEJ→Iis the reversal potential withEJ=0 mV for excitatory synapses andEJ=−80 mV for inhibitory synapses,andτMis the synaptic delay. The synapse variablerJ,j, as a fraction of the postsynaptically bound neurotransmitter,obeys the following first-order kinetics:

wheretsis the synaptic decay rate.
The parameters of the Izhikevich model are changed in order to simulate more physiological and pathological phenomena. The detailed values of the parameters used in the simulations are listed in Table 1. All the simulations are carried out in MATLAB R2018b.
In our previous study,[31]a variable universe fuzzy closed-loop method is designed to restore the relay ability of TH neurons automatically. It has been proved that the variable universe fuzzy control can avoid adjusting controller’s parameters repeatedly and improve the robustness of the controlled system. In order to adapt to the problem of decreased effectiveness of the controller due to PD progression,we apply this method to closed-loop DBS to control the basal ganglia network.
Considering that STN is selected as the target nucleus for typical DBS, Eq. (1) for the STN nucleus is modified as follows:

whereIDBSdescribes the stimulation current applied to the STN with the frequency in the range 130–180 Hz. In order to avoid tissue damage, the stimulation pulses adopt positive and negative charge balance form, which consists of a short-duration high-amplitude pulse and a long-duration lowamplitude pulses of opposite polarity. Thus, the total charge of the two-phase pulse is zero.[33]The details of the DBS are shown in Fig. 2. The short duration is 200 µs, while the long duration is twenty times longer than the short one. Accordingly,the amplitudes of the high-amplitude pulse are onetwentieth of the low-amplitude pulse.
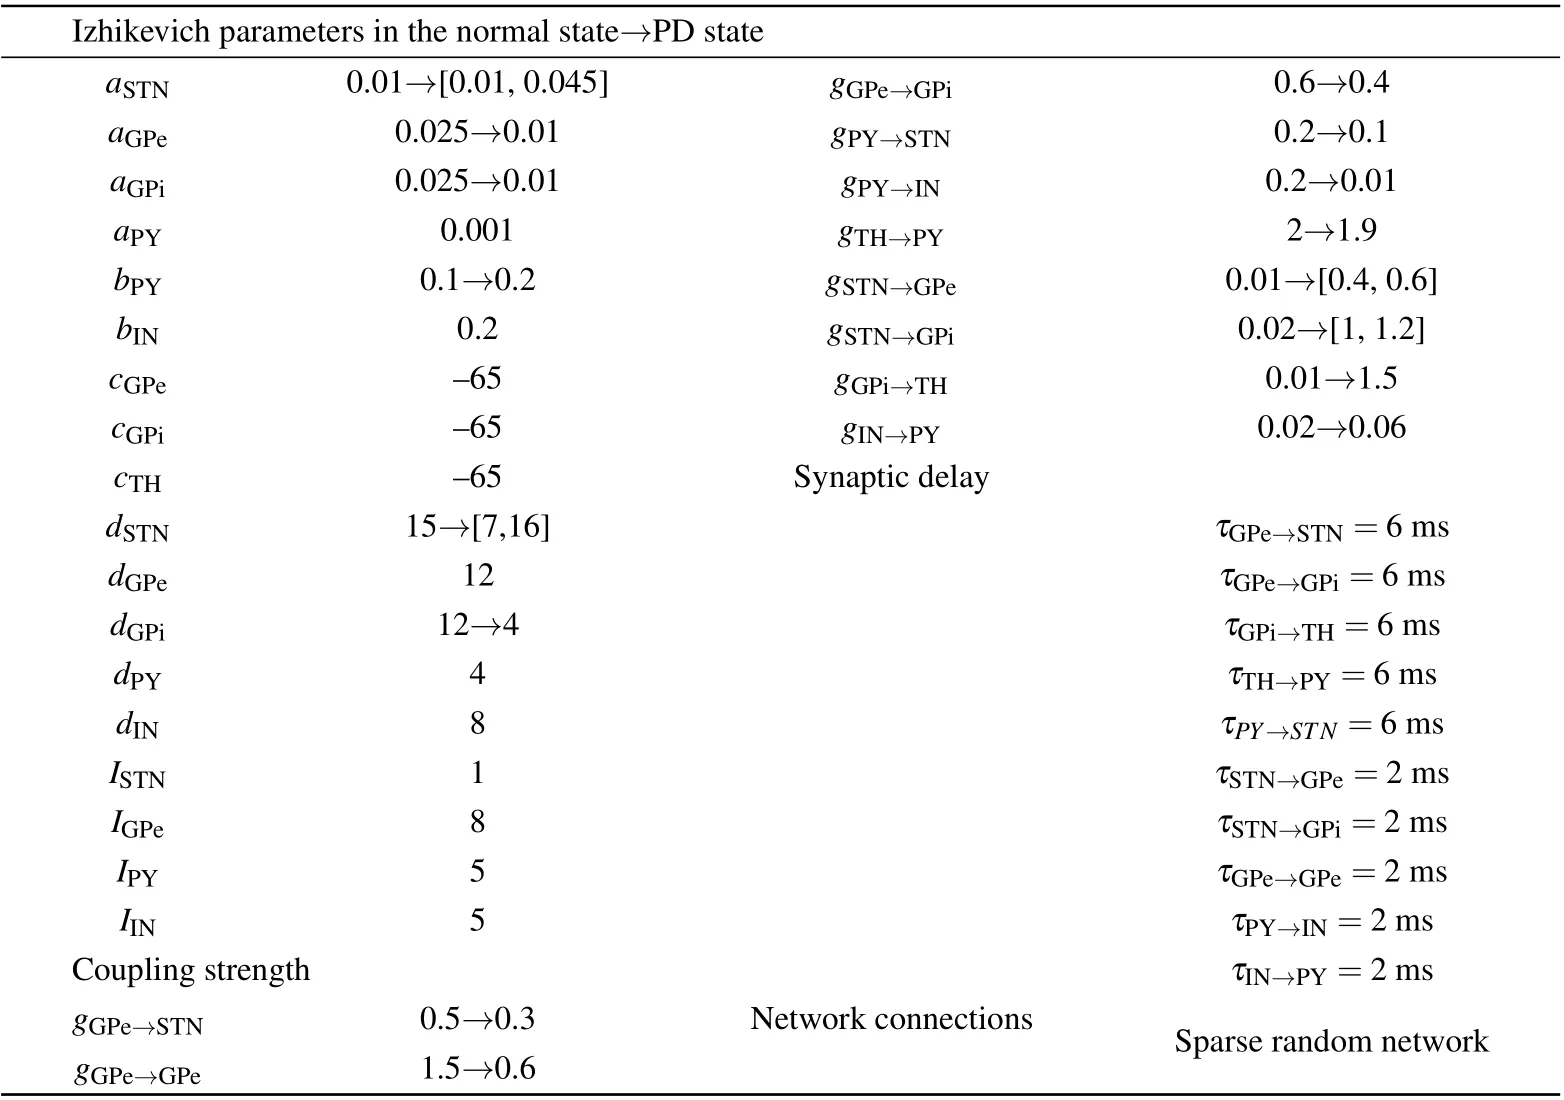
Table 1. Parameter values of the model.

Fig.2. Scheme of the variable universe fuzzy control system based on cortico-basal ganglia-thalamic network.
2.2. Fuzzy logic control strategy
Figure 2 shows the block diagram of the control strategy,
whereydrepresents the local field potential signal of the STN in the desired state andyis the feedback signal. The errorebetweenydandyconstitutes one major input of the fuzzy controller. Another input of the controllerec=de/dtcharacterizes the change rate ofe.
The fuzzy control algorithm[34–36]is implemented when each DBS pulse comes. Thus, the feedback signalyis only calculated once averagely from the local field potential of the STN since the previous stimulation pulse arrives. The variable universe controller consists of a main fuzzy controller and an auxiliary fuzzy controller. The two fuzzy controllers work together. Fuzzy control strategy is an intelligent control algorithm which works like an expert proficient in this task.[37]Both fuzzy controllers use standard Mamdani inference method. Here,according to the functional characteristics of the auxiliary fuzzy controller,the auxiliary fuzzy controller is renamed as contraction–expansion factor fuzzy controller.It is responsible for the regulation of contraction–expansion factor to adjust the universe of the main controller. The universe shrinks as the error decreases and it also expands as the error increases. In this way,the precision of the controller improves greatly by using its outpututo modulate the amplitude of the DBS high-amplitude pulse. The details of the fuzzy controller are based on our previous work.[31]
2.3. Evaluation index
(i)Summation of band power(Ps).
The sum of specific band power is an important index for evaluating model states. The powerPM(f)for each frequency is calculated in the following form:

wherefsis the sampling frequency of the power spectrum,being set to 104Hz here;tnrepresents the current time in the simulation. Use the last 1 s of the simulation results to calculate the power spectrum.
PbetaandPthetaare used to indicate the strength of the beta band oscillations and theta band oscillations. The corresponding calculation methods are described in the following way:

(ii)Control effectiveness index(CI).
CIis used to measure the effectiveness of closed-loop DBS. All the investigations are based on closed-loop control of the network. Therefore,CIis defined to measure the effectiveness of control. The calculation method is expressed by the following formula:

wherePS1is the summation of the band power under closedloop control of the controller.For the PD1 state,PS1represents the sum of energies of 4–8 Hz,whereas,for the PD2 state,PS1represents the sum of energies of 12–35 Hz.PS2refers to the summation of corresponding band power before the control,i.e. in PD states. The value ofCIrepresents the percentage of the summation band power after control compared to that before control.
(iii)Energy consumption index(EI).
The energy consumption of the controller is measured by the following formula:

whereIDBSis referred to the injected current of the neurons,andNis the total number of neurons that receives injected current in the simulation.
3. Results
3.1. Model verification
In our study, the intrinsic and coupling parameters are changed to simulate normal and PD states.
Figure 3 is the spike raster of the neural network depicting the firing of all neurons in each nucleus at different times and the overall behavior of the nucleus can also be obviously noticed. Each row corresponds to a unique nucleus and each point corresponds to one spike of a neuron. It can be noticed that more synchronous activities occur in each nucleus under the PD state.
To further verify the models and investigate the influence of neuronal parameters in the STN nuclei on oscillation frequency, we investigate the oscillation peaks of local field potentials of individual nuclei in the network by varying the values ofaSTNanddSTN. the panels in the upper row of Fig.4 illustrate the peak frequency and peak power of the spectrum of the STN,GPe and GPi as the values ofaSTNanddSTNchange.It shows that the model can produce PD states with an oscillatory main frequency of STN between 5.5 and 27.5 Hz. Simultaneously,the panels in the lower row of Fig.4 depict the power of the corresponding oscillatory peaks, which reflects the strength of the oscillations. The intensity of the oscillations with a higher frequency than 22 Hz becomes weaker in STN and GPe.
Two representative PD states, labeled as PD1 and PD2,are selected to characterize the abnormal oscillation in PD.For PD1 state,aSTNis 0.01 anddSTNis 10. For PD2 state,aSTNis 0.03 anddSTNis 8. The cardinal oscillation frequencies of the STN are 7 Hz in the theta band and 18 Hz in the beta band,respectively. Figure 5 shows the firing rates which are calculated during the first 3 s. It can be shown that the firing rate of STN in the normal state is higher than that of theta oscillation in the PD1 state,but is lower than that of beta oscillation in the PD2 state. Compared with the normal state, the pathological firing rates decrease in the GPe,TC,PY,and IN,but increase in the GPi. This simulation result is consistent with the previous studies that were developed in 1-methyl-4-phenyl-1,2,3,6-tetrahydropyridine treated primates and PD patients.[38–40]
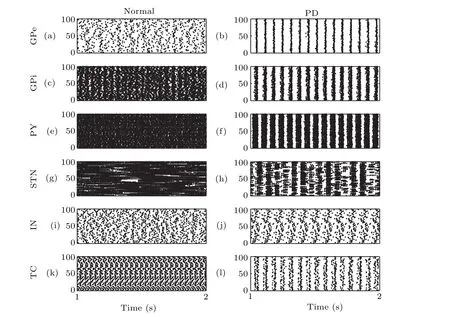
Fig.3. Spatiotemporal firing raster in normal state: (a)GPe, (c)GPi, (e)PY,(g)STN,(i)IN,and(k)TC.Spatiotemporal firing raster in PD state: (b)GPe,(d)GPi,(f)PY,(h)STN,(j)IN,and(l)TC.
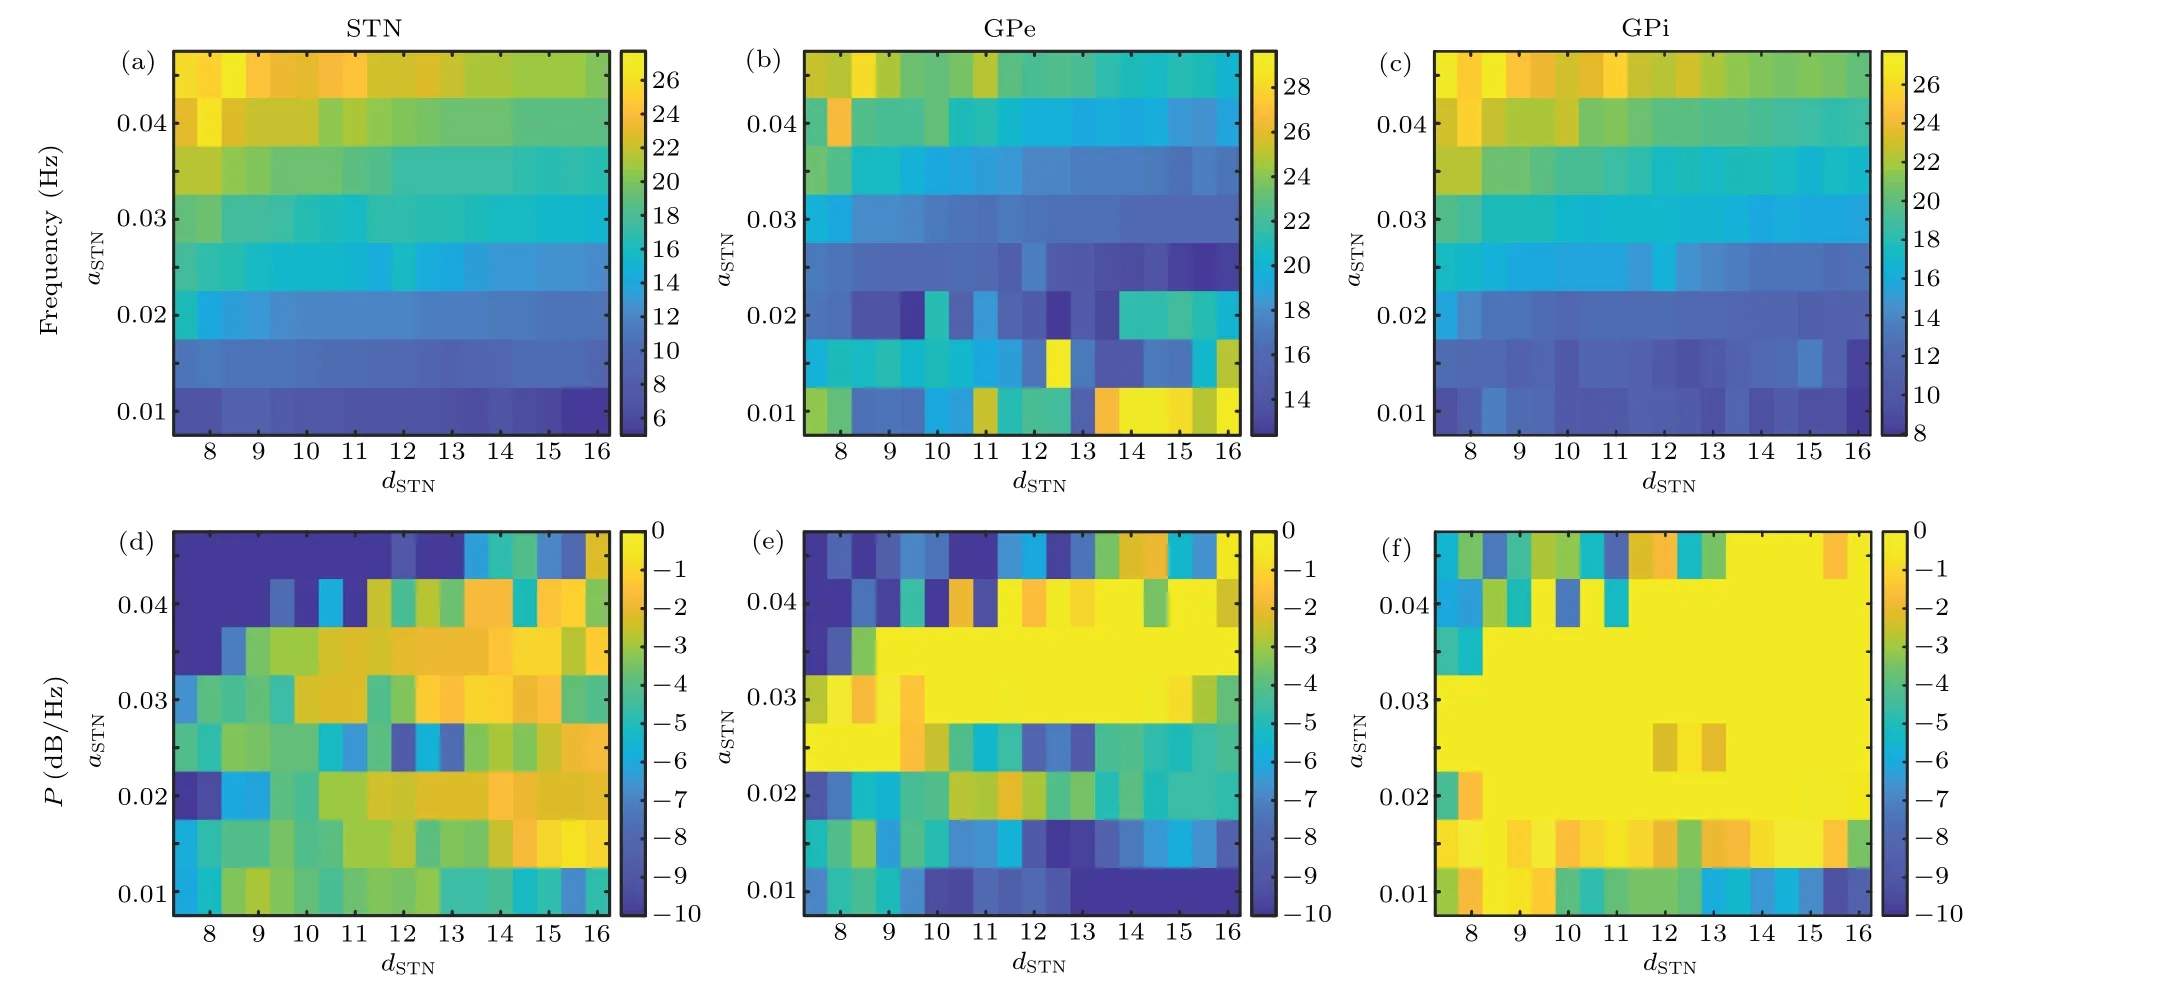
Fig.4. The dependence of the frequency and power of the spectral peak on the values of aSTN and dSTN in the model. Peak frequency of power spectrum in STN(a),GPe(b),and GPi(c)change with aSTN and dSTN. The power of the peak frequency change in STN(d),GPe(e),and GPi(f)with aSTN and dSTN.
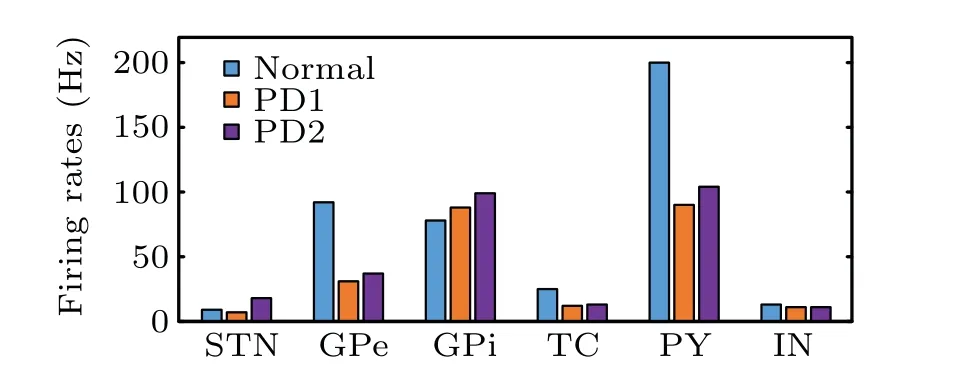
Fig.5. Firing rates of different nuclei.
Figure 6 shows the power spectrum of the local field potentials of the STN nuclei in normal,PD1 and PD2 states,respectively. It can be seen that the power spectrum of the PD1 state shows a peak at 7 Hz and the peak in the beta frequency band occurs in the PD2 state,which reveals pathologically enhanced oscillatory activities compared to the normal state.

Fig.6. Meanfield of STN nuclei in normal(a),PD1(c),and PD2(e)states. Power spectrum of the mean-field in normal(b),PD1(d),and PD2(f)states. Pink area is the theta band and green area is the beta band.
3.2. Comparison of the performance of fuzzy logic closedloop control and variable universe fuzzy logic closedloop control
In order to examine the robustness of the variable universe fuzzy controller and the fuzzy controller,the parameters of both controllers are unchanged while the pathological oscillation frequency peaks are changed. A set of parameters of the two controllers are chosen to suppress beta oscillations. In the design of the fuzzy controller,the universes of the two inputs (i.e. error and the change rate of error) are both set to be [−3, 3] without loss of generality. By multiplying factors labeled byKeandKec, the initial values of both inputs can be located within the universes. Considering that the range of erroreis about[−3.5,3.5]and the change rateecranges from[−3.3,3.3]from several pre-experiments,Kefor the ordinary fuzzy logical control strategy is set to 0.8 andKecis set to 0.9,correspondingly. Though in the variable universe fuzzy control strategy, all the settings of the controller are consistence with the ordinary one and the universes of main and auxiliary controller are both[−3,3].
As shown in Fig. 7, the two types of fuzzy logic controllers can effectively relieve the PD1 and PD2 states. It is worth noting that the control parameters are unchanged for the two different PD states. Figures 7(a)and 7(b)show the power summation at the frequencies of 3–8 Hz and 12–35 Hz. It can be determined whether the fuzzy controller and variable universe fuzzy controller can effectively reduce the oscillation reflected by a significant reduction of peak power. Moreover,we notice that the power of the spectral peak under the variable universe fuzzy controller is lower than that of the fuzzy controller.
Figure 8 shows the injected currents waveform of fuzzy controller and variable universe fuzzy controller,respectively.The stimulation current is injected into the objective network att=3 s.
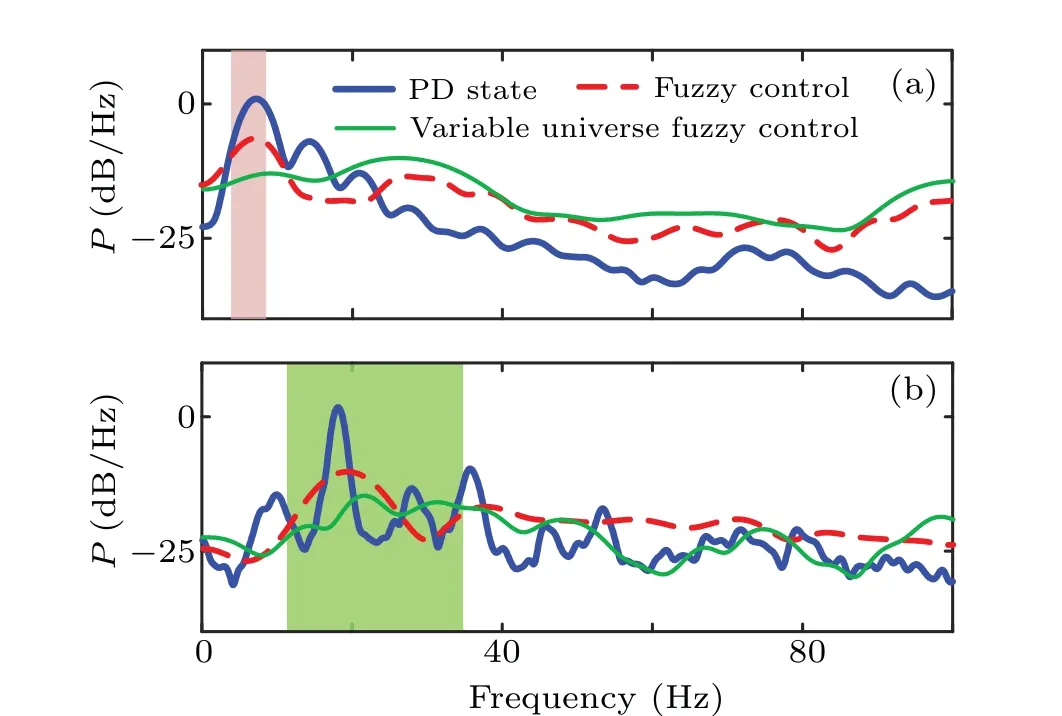
Fig. 7. Power spectrum of the local field potential of STN nucleus in PD1(a)and PD2(b)states.
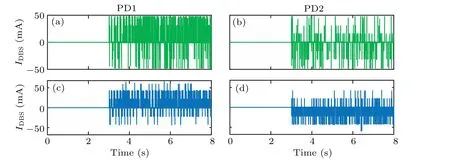
Fig.8. Injected current waveform: (a)PD1 state under fuzzy control,(b)PD2 state under fuzzy control,(c)PD1 state under variable universe fuzzy control,and(d)PD2 state under variable universe fuzzy control.

Fig.9. Time-frequency diagrams of STN neurons in the model in the normal state(a),PD1 state(b),and PD2 state(c). The closed-loop DBS is added at 3 s in(b)and(c).
Figure 9 shows the time-frequency diagrams of STN neurons of variable universe fuzzy controller in the simulation.Figure 9(a)depicts the time-frequency diagram of the normal state of the nucleus in 8 s. Figures 9(b)and 9(c)depict the differences in time-frequency diagrams before(i.e. the first 3 s)and after(i.e.3–8 s)DBS for PD1 and PD2 states.In Fig.9(b),when DBS is not applied for the first 3 s, there is an obvious 7 Hz oscillation. A significant decrease in 7 Hz oscillations is seen in the STN nucleus when the 130 Hz DBS is applied att=3 s. However, in Fig. 9(c), the STN neurons exhibit the 18 Hz oscillation in the first 3 s. The DBS is started att=3 s,after which the oscillation in the beta band soon disappears.
Quantitative evaluation is further conducted by inducing some indexes. Figure 10 presents the control effectiveness index (CI), and the summation of band power (Ps) is calculated in Fig.11. Figure 12 shows the energy consumption(EI)used to generate stimulus current waveforms of the two controllers. Both fuzzy controllers can achieve effective control over various PD states,as shown in Fig.10. In Fig.11,3–8 Hz band power under the fuzzy controller is about 10 times than that of variable universe fuzzy controller in the case of PD1.The fuzzy controller reduces 3–8 Hz band power to 25 percent while the variable universe fuzzy controller reduces 3–8 Hz band power to 2.5 percent of the PD1 state. In the case of PD2,the beta band power of LFP in STN under the fuzzy controller is 3 times higher than that under the variable universe fuzzy controller. Moreover, the energy consumption of variable universe fuzzy controller is 67% and 78% of the fuzzy controller in the cases of PD1 and PD2, respectively. It can be demonstrated that the variable universe fuzzy controller exhibits a superior performance than the ordinary fuzzy with the limitation of the unchanged controller parameters. The variable universe fuzzy controller can further reduce the abnormal oscillation in the basal ganglia network by costing less energy.
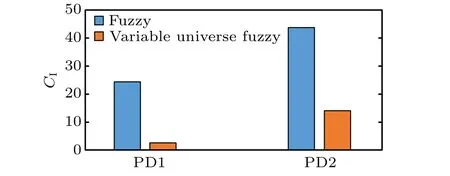
Fig.10. Control effectiveness index(CI).

Fig.11. Summation of band power(PS).
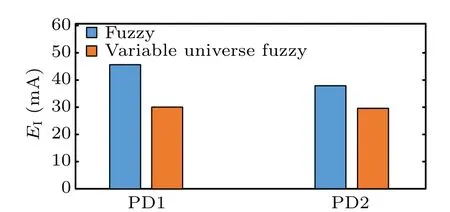
Fig.12. Energy consumption index under different conditions(EI).
4. Conclusions
This paper proposes a computational network of the basal ganglia-thalamo-cortical using the hybrid Izhikevich neuron model in order to reproduce the dynamical characteristics of the Parkinsonian state. The difference in the frequency of pathological oscillation corresponds to the different clinical manifestations. This work generates the beta and theta oscillations through the adjustment of the model. Based on the computational neural network,two types of fuzzy control strategies are adopted to suppress the abnormal oscillation in the basal ganglia-thalamo-cortical network.Simulation results show that DBS with variable universe fuzzy control strategy can effectively control different oscillations without changing the controller parameters. The control effectiveness of variable universe fuzzy controller exhibits better performance than that of ordinary fuzzy control strategy with a stronger ability to suppress the abnormal oscillation and a lower stimulation energy expenditure.
However,there is a limitation that this work simulates the computational model in the computer,without considering the hardware extra cost for the complex algorithm. Thus,we can further deploy the controller to the hardware, which will also be a very challenging,meaningful job.
Acknowledgements
Project supported by the National Natural Science Foundation of China (Grant Nos. 62173241 and 62171312) and the Natural Science Foundation of Tianjin, China (Grant Nos. 20JCQNJC01160 and 19JCZDJC36500). The authors also gratefully acknowledge the financial support provided by Opening Foundation of Key Laboratory of Opto-technology and Intelligent Control (Lanzhou Jiaotong University), Ministry of Education,China(Grant No. KFKT2020-01).
猜你喜欢
杂志排行
Chinese Physics B的其它文章
- Fault-tolerant finite-time dynamical consensus of double-integrator multi-agent systems with partial agents subject to synchronous self-sensing function failure
- Nano Ag-enhanced photoelectric conversion efficiency in all-inorganic,hole-transporting-layer-free CsPbIBr2 perovskite solar cells
- Low-voltage soft robots based on carbon nanotube/polymer electrothermal composites
- Temperature dependence of spin pumping in YIG/NiO(x)/W multilayer
- Interface effect on superlattice quality and optical properties of InAs/GaSb type-II superlattices grown by molecular beam epitaxy
- High-sensitive phototransistor based on vertical HfSe2/MoS2 heterostructure with broad-spectral response
