Detecting the possibility of a type of photon number splitting attack in decoy-state quantum key distribution
2022-12-28XiaoMingChen陈小明LeiChen陈雷andYaLongYan阎亚龙
Xiao-Ming Chen(陈小明) Lei Chen(陈雷) and Ya-Long Yan(阎亚龙)
1Beijing University of Posts and Telecommunications,Beijing 100876,China
2Beijing Electronic Science and Technology Institute,Beijing 100070,China
3University of Science and Technology of China,Hefei 230026,China
Keywords: quantum key distribution,photon number splitting,decoy state,hypothesis testing
1. Introduction
Quantum key distribution(QKD)[1–7]is a technique that allows two different remote parties,Alice(the sender)and Bob(the receiver), to share a unconditional secret key. The unconditional security of the key is guaranteed through the laws of quantum mechanics.[8–12]The first ideal QKD protocol was BB84-QKD protocol created by Bennett and Brassard,[1]which needs to employ the perfect single-photon source. Nevertheless, at present, single-photon sources are not available,and a weak coherent photon source is often utilized to replace the single-photon source. Due to adopting the imperfect single-photon sources, an eavesdropper Eve can launch the photon-number-splitting (PNS) attack.[13–30]In the basic PNS attack,Eve intercepts the pulse sent by Alice and detects the photon number of the intercepted pulse. If it is a singlephoton pulse,it will be directly discarded. If it is a multiphoton pulse,one photon will be stored and the rest will be sent to Bob through a weakly attenuated or even lossless channel. Finally,Eve can obtain exactly the same key as Bob by measuring the stored photons according to the basis published by Alice and Bob,which makes the QKD system no longer secure.Specially,a weaker version of PNS attack is one in which the observed values of Alice and Bob change significantly after the attack,[13–15,29]and the stronger PNS attack means that the observed values of Alice and Bob remain unchanged after the attack.[30]The difference between these two types of attacks is the effect on the observed values of Alice and Bob.
There are numerous protocols proposed to resist the PNS attack, among which the decoy-state method is a highly effective one. In decoy-state QKD,Alice randomly sends pulses from signal source or decoy source,and the only difference between signal source and decoy source is intensity.Importantly,the decoy-state method assumes that Eve could not distinguish the intercepted pulses coming from which source. The existing decoy-state protocols, such as Refs. [31–33], presented a method to defeat the PNS attack. Actually, the decoy-state QKD beats the PNS attack to provide a more accurate method to determine the secure key rate. To be precise, the existing decoy-state method can more closely estimate the lower bound of gain and the upper bound of quantum bit error rate(QBER)of the single-photon signals,and then calculate the secure key rate by using the Gottesman–Lo–L¨utkenhaus–Preskill(GLLP)formula[34]inspired by the idea of the entanglement distillation approach,

whereqis the basis alignment efficiency depending on the implementation (1/2 for the BB84 protocol),QµandEµare,respectively, the gain and QBER of the signal state,f(Eµ)is the error correction efficiency,H2(x)=−xlog2(x)−(1−x)log2(1−x)is the binary Shannon entropy function,Q1ande1are, respectively, the gain and QBER of single-photon states. Unfortunately,the secure key rate of decoy-state QKD is not high, and most of previous literatures use optimization and joint constraints to improve the key rate.[35–38]We find that the existing decoy-state method still considers that only single-photon pulses can generate secure keys in any case.However,if we can detect the possibility of PNS attack in the channel,multiphoton pulses can also generate secure keys. In this case,there is no doubt that using the above method to estimate secure key rate will waste the keys generated by multiphoton pulses and reduce the efficiency.It should be noted that the ultimate goal of this line of research is to confirm the absence of all types of PNS attacks. In particular,the PNS attack mentioned and detected in this paper is only a weaker version of PNS attack which significantly changes the observed values of Alice and Bob.
In this work,under the null hypothesis of no weaker version of PNS attackHo1, we first retrieve the lost information,extract a Cauchy distribution statistic and provide a new method to detect the possibility of PNS attack which significantly changes the observed values of legitimate users in the channel,namely,the first test in this paper.Furthermore,given the significance level of the first testα1and the number of the first testm,we interpret the empirical results to verify the correctness of the first test through the NIST Statistical Test Suite,[39]which is called the second test in this paper. If the result is judged to be an attack, the lower bound of the gain and the upper bound of QBER of the single-photon signals will be estimated by the existing decoy-state method,and then the secure key rate will be calculated by the GLLP formula.Otherwise, the pulses with the same basis received including both single-photon pulses and multiphoton pulses,can be used to generate the keys and we also give the secure key rate in this case. And the end, the associated experiments we performed also indicate that our method is credible(i.e.,the significance level is 5%).
2. The scheme
In this section, we will focus on our scheme to detect the type of PNS attack which significantly changes the observed values of Alice and Bob. Unless otherwise specified,the PNS attacks mentioned in this paper are both the weaker version. For one thing, we describe the first test, a new detection method of weaker PNS attack for decoy-state QKD,which can precisely calculate the error probability of detection. For another, we interpret the empirical results to verify the correctness of the first test,namely,the second test in this paper. We refer specifically to the interpretation of empirical results in section 4.2 of Ref. [39], which is called the second test in our paper. Two scenarios typify events that may occur due to empirical testing. Case 1: The significance level selected for the first test is reasonable, indicating that the first test is correct. Case 2: The significance level selected for the first test is unreasonable,indicating that the first test is wrong.We use the second test to check the correctness of the first test.Finally,according to the judgment result,we will give the corresponding secure key rate.
2.1. The first test
In this part, we introduce the new method to detect the PNS attack which significantly changes the observed values of legitimate users in decoy-state QKD via statistical hypothesis testing, which is called the first test in this paper. Then we analyze the type I error of the first test, that is, mistaking no PNS attack for having a PNS attack. The first test contains five steps.
Identify null and alternative hypothesis Let us consider the hypothesis testing problem about the null hypothesisHo1: there is no weaker version of PNS attack on the channel and the alternative hypothesisHa1: there is a weaker version of PNS attack on the channel.
Construct the test statistic We need a test statistic to conduct the hypothesis testing. In what follows, the distribution of the test statistic is derived under the null hypothesisHo1.Alice intentionally and randomly selects two weak coherent photon sources with different intensities, after phase randomization,namely,signal source and decoy source. Suppose the intensities of the signal source and the decoy source areµandν,respectively.Pn(µ)denotes the probability of emittingn-photons pulses from the signal source,written as

The yieldynrepresents the probability of receiving a pulse(at Bob’s side)after Alice emits an-photons pulse. According to Ref. [33], one hasyn ≈nηwhereηis the overall transmission probability of each photon. The gainQis the probability of receiving a pulse (at Bob’s side) after Alice emits a pulse,no matter how many photons which contains. The gain of the signal sourceQµis given by

Let us consider further about the sending and receiving process between Alice and Bob. When Alice emits a pulse from the signal source, the outcome (at Bob’s side) only includes two cases, that is, receiving it or not. Therefore, the sending and receiving process can be regarded as a Bernoulli trial. Taking the advantage of Eq.(3),we derive the probability that Bob receives the signal pulsep1=µη. Suppose the number of signal pulses Alice emits and that of signal pulses Bob receives areN1andn1,respectively. Next,n1has the binomial distribution with parameters(N1,p1),for short,

In Ref.[32],we findN1is so large(typically 109to 1010),µandηare approximately 10−2to 10−1and 10−4to 10−3,respectively. Thus,p1is roughly 10−6to 10−4. By the law of large numbers and the central limit theorem, whenN1p1≥5 andN1p1(1−p1)≥5, the binomial distribution with parameters (N1,p1) can be approximately regarded as the normal distribution with meanN1p1and varianceN1p1(1−p1),given by
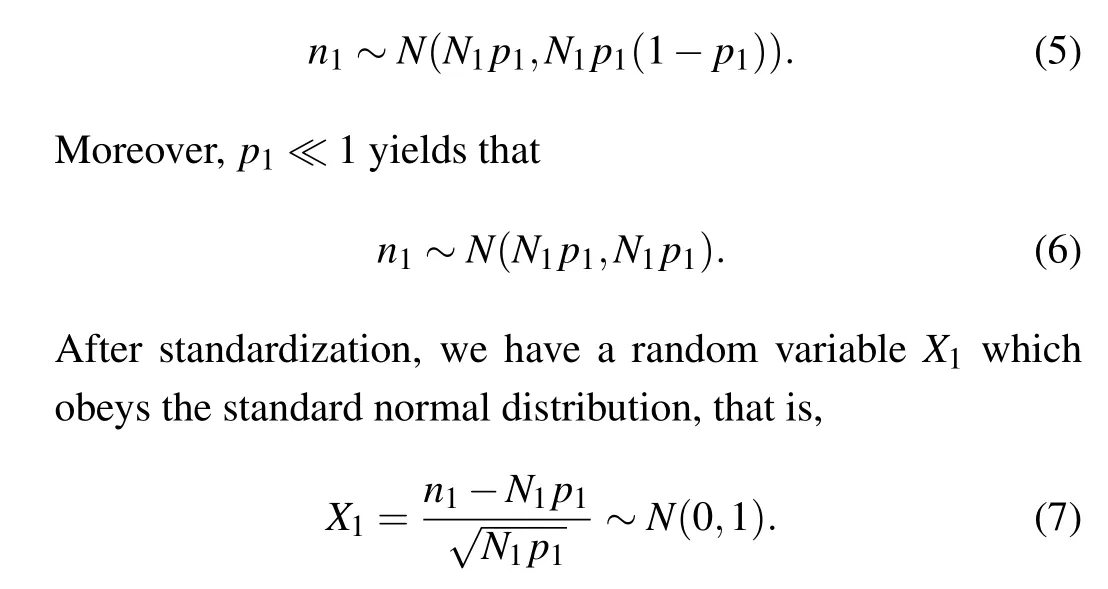
Since the only difference between the signal source and the decoy source is their intensities,it is easy to get the other random variableX2by analogy,denoted by

whereN2andn2are the number of the decoy pulses Alice emits and that of the decoy pulses Bob receives,respectively.p2represents the probability of receiving a decoy pulse (at Bob’s side) after Alice emits a decoy pulse, no matter how many photons which contains and the value ofp2isνη. According to the definition oftdistribution,let the random variableY=X1/X2, thenYobeys thetdistribution with a single degree of freedom,which is equivalent to the standard Cauchy distribution,that is,
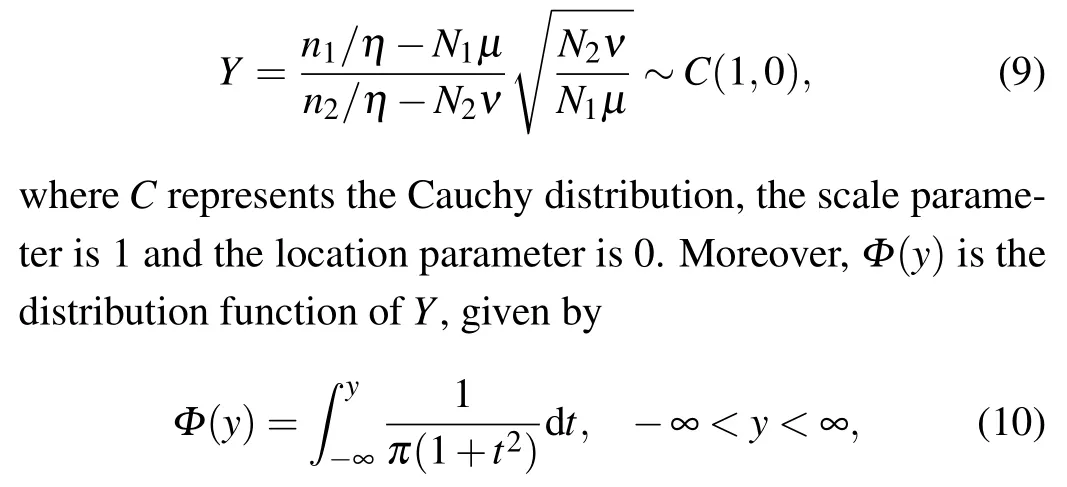
whereyis the value ofYand is also the test statistic that we find.
Find the value of the test statistic Set the parametersµ,ν,N1,N2,andη,then recordn1andn2. Substituting these data into Eq.(9),the desired value of the test statisticycan be obtained.
Choose a significance level We need to determine a significance level (typically 0.05) for the first test. In terms of the null hypothesis of the first testHo1, we deduce that the first test is a two-tailed hypothesis testing. In addition, given the significance level of the first testα1, the rejection region is|y|≥y[1−α1/2]wherey[1−α1/2]can be obtained by Eq.(10).More precisely,the variables−y[1−α1/2]andy[1−α1/2]refer to the boundary values between the rejection region and the acceptance region for the first test. Let the left side of Eq. (10)is equal toα1/2, then the upper limit of the integral will be−y[1−α1/2]. According to the symmetry of the probability density function of the Cauchy distribution,y[1−α1/2]can be obtained.
Make a decision Compare the test statisticywith the critical valuesy[1−α1/2]and−y[1−α1/2]. Ify>y[1−α1/2]ory<−y[1−α1/2],we will rejectHo1and acceptHa1. This means that we believe there is a weaker version of PNS attack on the channel. Otherwise, we fail to rejectHo1. That is to say, we consider there is no weaker version of PNS attack on the channel.Remark the significance level of the first testα1is also the type I error probability of the first test,namely,the probability of mistaking no PNS attack for having a PNS attack.Letβdenote the type II error probability of the first test,to be precise,the probability of mistaking having a PNS attack for no PNS attack. Note thatβis usually difficult to find in most situations. Furthermore,the necessary condition for controlling the type II error probability is to demarcate the distribution type of the aggressive behavior.
2.2. The second test
The interpretation of empirical results can be conducted in any number of ways. Two approaches NIST adopted include(1)the examination of the proportion of passing the first test and (2) the distribution ofP-values to check for uniformity. We adopt the first approach of NIST, which considers the empirical results of the first test and calculates the passing proportion of the first test. In this part,given the significance level of the first testα1and the number of the first testm,we account for the empirical results to check the correctness of the first test via the NIST Statistical Test Suite, according to illustrating the reasonability of the counting rate of acceptingHo1,which is called the second test in this paper. The specific analysis is as follows. Given the significance level of the second test, if the passing proportion of the first test passes the second test,the first test is proved to be correct;otherwise,the first test is proved to be wrong. The second test also contains five steps.
Identify null and alternative hypothesis Under the significance level of the first testα1and the number of the first testm,let us consider the hypothesis testing problem about the null hypothesisHo2: the counting rate of acceptingHo1with the first test is reasonable and the alternative hypothesisHa2:the counting rate of acceptingHo1with the first test is unreasonable.
Construct the test statistic Supposing that each first test is independent and identically distributed,the confidence level of the first test isq=1−α1. Let us consider further about the first test. The results contain two cases,namely,acceptingHo1or rejectingHo1. Thereby, one can regard each first test as a Bernoulli trial. Note that the probability of acceptingHo1isq. Suppose the number of the first test and that of acceptingHo1aremandξ,respectively.mis the times that the first hypothesis testing procedure is repeated. The value ofmis set by the experimenter himself. If the experimental conditions permit(i.e.,a fast enough repetition rates),the larger the value ofm, the better the result.ξrefers to the times of accepting hypothesisHo1when we repeat the first testmtimes. That is to say,for each first test executed,if the test result is accepting hypothesisHo1,the value ofξwill be increased by one. Then,ξwill obey the binomial distribution with parameters (m,q),for short,

Whenmq ≥5 andmq(1−q)≥5,by the law of large numbers and the central limit theorem, the binomial distribution with parameters(m,q)can be approximatively regarded as the normal distribution with meanmqand variancemq(1−q),written as
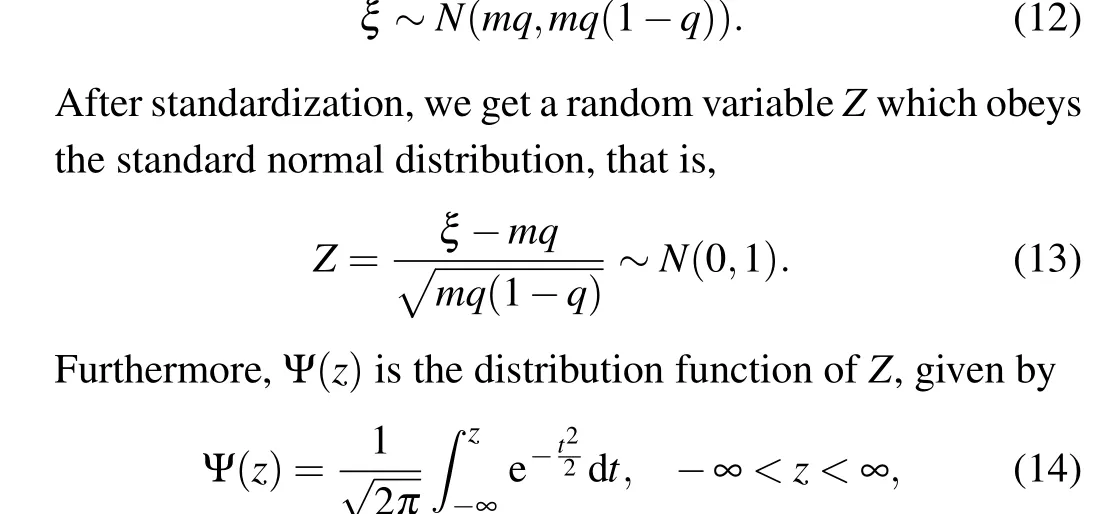
wherezis the value ofZand is just the test statistic that we find.
Find the value of the test statistic Selectmand recordξ. Substituting these data into Eq.(13),one can get the value of the test statisticz.
Choose a significance level We need to choose a significance levelα2(typically,α1=α2) for the second test.According to the null hypothesis of the second testHo2, we deduce that the second test is a two-tailed hypothesis testing.The rejection region of the second test is|z|≥z[1−α2/2]wherez[1−α2/2]can be obtained by Eq.(14). More precisely,the variables−z[1−α2/2]andz[1−α2/2]refer to the boundary values between the rejection region and the acceptance region for the second test. Let the left side of Eq. (14) be equal toα2/2,the upper limit of the integral will be−z[1−α2/2]. According to the symmetry of the probability density function of the normal distribution,z[1−α2/2]can be obtained.
Make a decision Compare the test statisticzwith the critical valuesz[1−α2/2]and−z[1−α2/2]. Ifz>z[1−α2/2]orz<−z[1−α2/2], we will rejectHo2and acceptHa2. In other words, we consider the counting rate of acceptingHo1is unreasonable. Otherwise,we fail to rejectHo2. This means that we believe the counting rate of acceptingHo1is reasonable,and verifies the correctness of the first test at the same time.
If the result is judged to be an attack,the lower bound ofQ1and the upper bound ofe1will be estimated by the existing decoy-state method,and then the secure key rate will be calculated by Eq.(1). If the result is no attack,then the pulses with the same basis received including both single-photon pulses and multiphoton pulses,can be used to generate the keys. Under the assumption that the bit error is equal to the phase error even for multiphoton pulses, the secure key rate formula Eq.(1)becomes

By comparing Eqs. (1) and (15), we can easily see the improvement of the secure key rate.
3. Experiments and analysis
In the preceding section, we show the details of our detection method. Now,we move forward to the corresponding experiments based on the aforementioned method and analyze the experimental results. The experimental setup is based on the platform of polarization encoding decoy-state BB84 implementation, with commercial compact devices at 625 MHz clock rate,[40,41]with some different parameters such as the wavelength and mean photon numbers. The mean photon numbers of the signal state and decoy state are typical around 0.4 and 0.1,respectively.[42]The block size for parameter estimation is set to 500 kbits to guarantee the freshness of final keys.[41,43]Meanwhile,ηis set to a typical value 10−3,which contains a typical detection efficiency of 10%and a transmittance of 1%with a 100 km-length fiber.[40]
3.1. The first test
The experimental parameters and their corresponding values of the first test are listed in Table 1. After calculation,we obtain the value of the test statisticy=4.90. When the significance level of the first testα1=0.05, the critical values arey[1−α1/2]=12.71 and−y[1−α1/2]=−12.71. Due to−12.71<4.90<12.71, the test statistic does not fall inside the rejection region and we fail to rejectHo1. In other words,we infer that there is no weaker version of PNS attack on the channel and the probability of being wrong is no more than 5%. The schematic diagram of the first test is illustrated in Fig.1.

Table 1. Experimental parameters and their corresponding values of the first test.
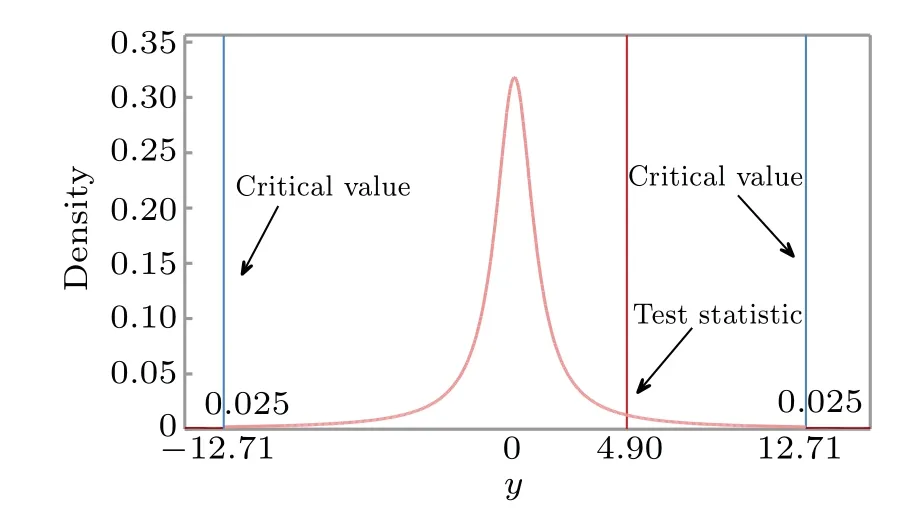
Fig.1. The schematic diagram of the first test. The value of the test statistic y is 4.90. Given the significance level of the first test α1=0.05,the critical values are y[1−α1/2]=12.71 and −y[1−α1/2]=−12.71.
3.2. The second test
In this part, we interpret the empirical results to check the correctness of the first test via the NIST Statistical Test Suite. The number of the first test and that of acceptingHo1arem=984 andξ=945,respectively. The experimental parameters and their corresponding values of the second test are listed in Table 2. In practical QKD systems, one cannot accurately control the number of signal pulses Alice emitsN1and that of decoy pulses Alice emitsN2. Fortunately,although the values ofN1for each first test are not completely identical,they are very close and have the same order of magnitude.For simplicity, we ignore the effect of the minimal deviation of differentN1and take the same strategy toN2.
After calculation, we obtain the value of the test statisticz= 1.49. Given the significance level of the second testα2= 0.05, the critical values arez[1−α2/2]= 1.96 and−z[1−α2/2]=−1.96. Since−1.96< 1.49< 1.96, the test statistic does not fall inside the rejection region and we fail to rejectHo2. This means that the counting rate of acceptingHo1is reasonable, and also further affirms the correctness of our method. That is to say,under the null hypothesis of no weaker version of PNS attack, we can judge there is no weaker version of PNS attack on the channel with an error probability of less than 5%. And then we can use Eq. (15) to calculate the secure key rate. The schematic diagram of the second test is illustrated in Fig.2.

Table 2. Experimental parameters and their corresponding values of the second test.
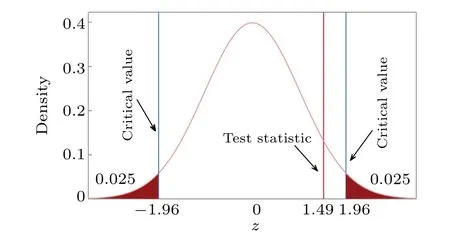
Fig. 2. The schematic diagram of the second test. The value of the test statistic z is 1.49. Given the significance level of the second test α2=0.05,the critical values are z[1−α2/2]=1.96 and −z[1−α2/2]=−1.96.
4. Conclusion and discussion
In summary, we first recover the lost information of the existing decoy-state protocols when detecting the type of PNS attack which significantly changes the observed values of Alice and Bob, and extract out a Cauchy distribution statistic.Based on this information,we propose a new detection method including the first test and the second test. Most importantly,the error probability of detection can be precisely calculated in our method and we also give the calculations. Finally,according to the judgment result, we give the corresponding secure key rate. In particular,compared with the existing decoy-state protocols,the secure key rate with our method has a great improvement if the judgment result is no attack. Meanwhile,the associated experiments we performed also verify the correctness of our scheme. Nevertheless,all judgment results in this paper are obtained under the condition that the null hypothesis is no weaker version of PNS attack, which significantly changes the observed values of legitimate users. In other words,the gain of signal state or decoy state will change significantly after the type of PNS attack.[13–15,29]However, we can do nothing about stronger PNS attacks that retain the gain of signal state and decoy state,such as partial PNS attacks,[30]because the premise of the derivation no longer holds,and the type II error probability of our method in this case will be insufferable even close to unity. It should be noted that the ultimate goal of this line of research is to confirm that there are no all types of PNS attacks. For this reason, compared with the existing decoy-state methods[31–33]to directly estimate the secure key rate,our method is not yet able to be directly applied in practice now. But at least we give a new idea to detect the type of PNS attack which significantly changes the observed values of legitimate users,and improve the secure key rate and efficiency.
As for future work, one direction is to extend our approach to resist stronger version of PNS attacks.[30]In addition, in the absence of weaker version of PNS attack, since the distribution of the photon numbers received by Bob is approximated with a normal distribution,except that the ratio of two independent random variables obeying the standard normal distribution obeys a Cauchy distribution used in the paper,we can also use the conclusion that the sum ofnindependent random variables obeying the normal distribution still obeys a normal distribution or that the sum of squares ofnindependent random variables obeying the standard normal distribution still obeys a chi-square distribution ofndegrees of freedom,to determine whether there is an attack and to calculate the type I error probability. It can be seen from the above analysis that our method can also be applied to other protocols containing more than one decoy state. Therefore,the other direction is to extend our method to other decoy-state QKD protocols, such as three different intensities of coherent photon source[36,44,45]and four different intensities of coherent photon source.[35]
猜你喜欢
杂志排行
Chinese Physics B的其它文章
- Editorial:Celebrating the 30 Wonderful Year Journey of Chinese Physics B
- Attosecond spectroscopy for filming the ultrafast movies of atoms,molecules and solids
- Advances of phononics in 20122022
- A sport and a pastime: Model design and computation in quantum many-body systems
- Molecular beam epitaxy growth of quantum devices
- Single-molecular methodologies for the physical biology of protein machines
