Luminescent characteristics of Tm3+/Tb3+/Eu3+tri-doped Na5Y9F32 single crystals for white emission with high thermal stability
2022-12-28LizhiFang方立志XiongZhou周雄ZhiweiZhao赵志伟BiaoZheng郑标HaipingXia夏海平JunWang王军HongweiSong宋宏伟andBaojiuChen陈宝玖
Lizhi Fang(方立志) Xiong Zhou(周雄) Zhiwei Zhao(赵志伟) Biao Zheng(郑标)Haiping Xia(夏海平) Jun Wang(王军) Hongwei Song(宋宏伟) and Baojiu Chen(陈宝玖)
1Key Laboratory of Photo-electronic Materials,Ningbo University,Ningbo 315211,China
2Taizhou Special Equipment Inspection and Research Institute,Taizhou 318000,China
3Fujian Provincial Key Laboratory of Functional Marine Sensing Materials,Center for Advanced Marine Sensing Materials and Smart Sensors,Minjiang University,Fuzhou 350108,China
4State Key Laboratory on Integrated Optoelectronics,College of Electronic Science and Engineering and College of Physics,Jilin University,Changchun 130012,China
5Department of Physics,Dalian Maritime University,Dalian 116026,China
Keywords: Tm3+/Tb3+/Eu3+ triply-doped Na5Y9F32,white light emission,energy transfer process,thermal stability
1. Introduction
Over the years, with the continuous consumption of energy, the growth of energy-efficient equipment has become an unstoppable trend. The white light-emitting diodes (w-LEDs) have aroused high interest due to their advantages of energy-saving, fast switching, longer lifetime, environmentally friendly,compact size,and color tunability over fluorescent tubes and incandescent bulbs.[1–4]Currently,the w-LEDs are mainly obtained in the following ways: (i) the combination of blue chip of GaN/InGaN and yellow phosphor of YAG:Ce3+;[5](ii) mixing three colors (blue, red, green) phosphor to achieve white emission under UV excitation;[6]and(iii)the composition of a unitary NUV/UV LED chip with multicolor fluorescence.[7]The white light produced by the above methods often encounters some problems,such as low efficacy,reduced lifetime, weak resistance to heat and small rendering index,which reduce the quality of the white light.[8–10]Therefore,increasing academic interest has concentrated on the research of pursuing a mono-phase and full-emission material by a near ultraviolet stimulation to overcome the defects of traditional w-LEDs.[11]The unique electron transitions(4f–4f or 4f–5d)in RE3+ions can generate in the aggregate spectral cover scope from ultraviolet to infrared.
Among RE3+ions, Tm3+has a high emission peak(1D2→3F4) at∼450 nm (blue), and Tb3+usually plays a green-emitting sensitizer at∼545 nm (green5D4→7F5). Eu3+acts as an effective red-emitting activator owing to the transition of5D0→7FJ(J= 1,2, 3, 4).[12]The Tm3+/Tb3+/Eu3+tri-doping used in some materials has been extensively researched, such as Na5La(MoO4)4fluorescent powder: Tm3+/Tb3+/Eu3+,[13]and ZnB glasses: Tm3+/Tb3+/Eu3+.[14]Nevertheless, owing to the difficulty of crystal growth, the single crystal tridoped with Tm3+/Tb3+/Eu3+is rarely seen.On account of the Na5Y9F32single crystal being proof of invariable physical–chemical properties, thermal stabilization and high luminous efficiency,[15]the RE3+doped Na5Y9F32single crystals may be a desirable material to obtain comprehensive performance.
In this paper, the Tm3+/Tb3+/Eu3+doped Na5Y9F32single crystals were grown by the Bridgman method.When the excitation wavelength was set at 362 nm, the Tm3+/Tb3+/Eu3+tri-doped Na5Y9F32single crystals had abundant emission from 430 nm to 650 nm and the cool white emission was obtained with CIE coordinate (0.2995, 0.3298)and the CCT of 6586 K.
2. Experimental details
By using through the ameliorative Bridgman technique,Tm3+, Tb3+and Eu3+doped Na5Y9F32single crystals were prepared from 99.99% high purified NaF, YF3, TmF3, TbF3and EuF3powders. Moreover,adding a slight of KF(99.99%)as flux into raw material to change the phase equilibrium between YF3and NaF and reduce the crystalline temperature of Na5Y9F32single crystal.[16]The homologous concrete course of crystal growth was described elsewhere.[17]Here,the Na5Y9F32single crystal is named as NYF, and the RE3+singly doped,co-doped and tri-doped are as below:
Sample A:NYF+0.3 TmF3;
Sample B:NYF+0.6 TbF3;
Sample C:NYF+0.6 EuF3;
Sample D:NYF+0.6 TbF3+0.3 TmF3;
Sample E:NYF+0.6 TbF3+0.3 TmF3+0.4 EuF3;
Sample F:NYF+0.6 TbF3+0.3 TmF3+0.6 EuF3;
Sample G:NYF+0.6 TbF3+0.3 TmF3+0.8 EuF3.
As displayed in Fig. 1(e), the size of the grown lucent crystal is approximately Φ10 mm×30 mm.It was then cut and burnished to∼2 mm to test correlative luminescence properties. As listed in Table 1,the real Tm3+,Tb3+and Eu3+contents in Na5Y9F32single crystal were determined by ICP-AES from PerkinElmer Inc Optima 3000. The crystalline phase of the as obtained samples was verified via Bruker D8 Advance(Germany)with radiation source of Cu-K-αray(0.15043 nm).The excitation spectra, emission spectra, and decay lifetime were investigated by FLSP 920 type spectrometer(Edinburgh,England). The FLSP 920 spectrometer with temperature controlling equipment was used to explore temperature-dependent emission spectra. The quantum yield was measured by Horiba FL3-111 spectrometer(France).
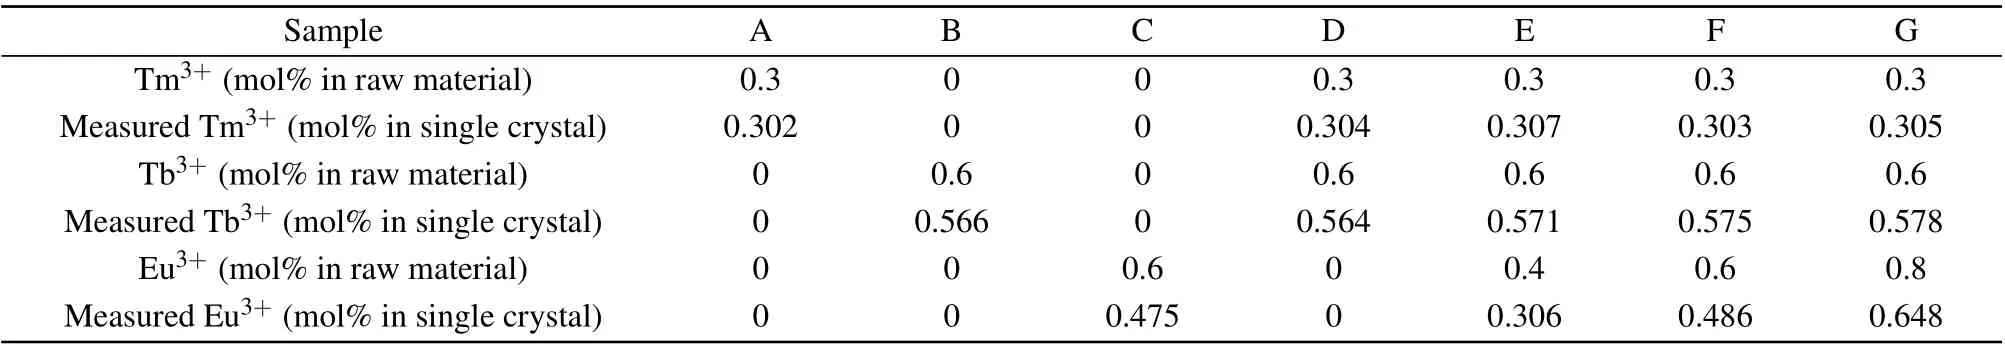
Table 1. The doping concentrations of Tm3+,Tb3+,Eu3+ in raw material and the ionic numbers of Tm3+,Tb3+ and Eu3+ ions in the obtained crystal.
3. Results and discussion
3.1. XRD analyses
Figures 1(a)–1(d)exhibit the XRD patterns of Na5Y9F32(PDF#27-1428),samples A,D and G,respectively. The whole diffraction peaks are tallied with standard data and there are no unnecessary peaks. It suggests that introduced Tm3+, Tb3+and Eu3+ions will not have major influence on the crystal structure of Na5Y9F32. Davolos recommends that in order to implement effective ions doping, the permissible radius differences between the dopants and substitution sites should be not greater than 30%.[18]The percentage differences in radius of Tm3+–Y3+, Tb3+–Y3+and Eu3+–Y3+are 2.58%,3.36% and 6.38%, respectively, demonstrating that the three ions are efficiently doped into Na5Y9F32single crystal.
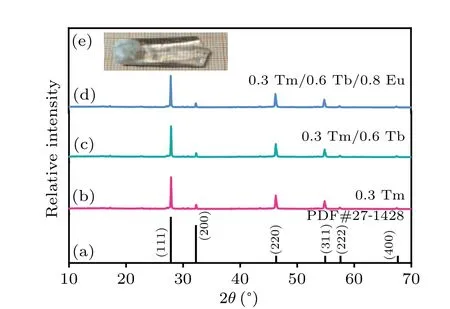
Fig.1. (a)The XRD patterns of the standard XRD cards of Na5Y9F32(PDF#27-1248). (b)–(d)XRD patterns for 0.3 mol%Tm3+,0.3 mol%Tm3+/0.6 mol%Tb3+and 0.3 mol%Tm3+/0.6 mol%Tb3+/0.8 mol%Eu3+ doped single crystals using the powders obtained by grinding the bulk crystal. (e) The insert diagram is a picture of grown Na5Y9F32 single crystal.
3.2. Excitation spectra and emission spectra
Figure 2 demonstrates the emission and excitation spectra of Tm3+, Tb3+and Eu3+singly doped single crystals. Figures 2(a)–2(c) present the excitation spectra of Tm3+, Tb3+and Eu3+singly doped ones monitored at 452 nm, 544 nm and 614 nm, respectively. Figure 2(a)reveals a sharp peak at 358 nm,owing to3H6→1D2transition of Tm3+. Figure 2(b)illustrates five peaks at 320 nm,338 nm,354 nm,370 nm and 378 nm,which originate from the ground sate7F6to excitation sates5D1,7F6,5L8,5D2,5G6and5D3transitions of Tb3+.Figure 2(c)consists of 362 nm,383 nm and 396 nm three peaks,originating from7F0→5D4,5G2and5L6transitions of Eu3+.It is noted that the Tm3+, Tb3+and Eu3+excitation spectra show a consistent excitation band at about 362 nm, indicating the three ions may be stimulated by 362 nm simultaneously, which offer a potential possibility for white emission through the integration of a near-ultraviolet LED chip with Tm3+/Tb3+/Eu3+triply-doped Na5Y9F32single crystal. Figures 2(d)–2(f)show the emission spectra of Tm3+, Tb3+and Eu3+doped ones, respectively, stimulated by 362 nm. Figure 2(d)exhibits a blue band located at 452 nm,which is due to the transition of Tm3+:1D2→3F4. Figure 2(e)describes the peaks at 486 nm,544 nm,which are owing to5D4→7F6,7F5transitions of Tb3+, respectively. Because of the5D0→7F1,7F2transitions of Eu3+, two emission bands are presented at 592 nm and 613 nm in Fig.2(f). Generally speaking,the ligand field makes no difference to the5D0→7F1transition intensity of the magnetic dipolar,while the5D0→7F2transition of electric dipolar is known to be prohibited in central symmetric environment.[19]The emission intensity of the transition5D0→7F1(592 nm) is stronger than that of5D0→7F2(613 nm)in Fig.3(f),which manifests that the local structure of Eu3+in Na5Y9F32single crystal belongs to spatial inversion.
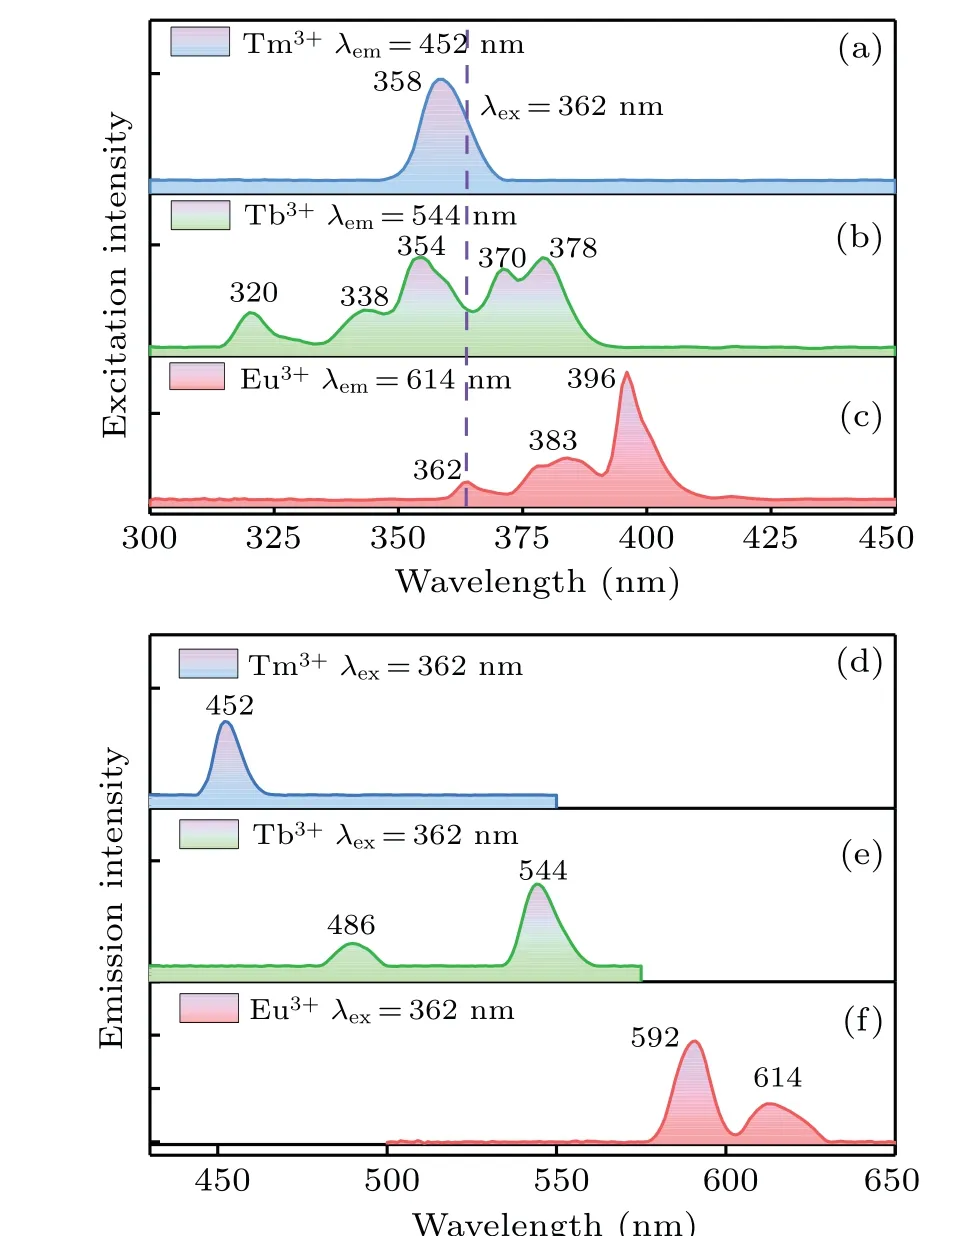
Fig.2. (a)–(c)Excitation spectra of sample A:Tm3+,B:Tb3+and C:Eu3+,respectively. (d)–(f)Emission spectra of sample A:Tm3+,B:Tb3+ and C:Eu3+,respectively.
Figure 3(a)exhibits the fluorescence spectra of 0.3 mol%Tm3+/0.6 mol% Tb3+/ymol% Eu3+(y=0.4, 0.6, 0.8) tridoped Na5Y9F32crystals. Under 362 nm excitation, the fluorescence spectra show the blue, green and reddish-orange emission,which originate from Tm3+:1D2→4F3(452 nm),Tb3+:5D4→7F6(491 nm),Tb3+:5D4→7F5(544 nm),and Eu3+:5D0→7F1(591 nm),Eu3+:5D0→7F2(613 nm),respectively. Figure 3(b)shows the emission intensity of Tm3+,Tb3+and Eu3+with relation to the Eu3+content. With the addition of Eu3+concentration, the luminescence intensities of Tm3+and Tb3+decrease,while the luminescence intensity of Eu3+increases gradually.

Fig.3.(a)Fluorescence spectra of samples E,F and G in the wavelength of 430 nm–650 nm under 362 nm excitation. (b) The relationship between integrated emission intensity with different Eu3+ concentration.
3.3. Energy transfer
The possible energy transfer among Tb3+, Tm3+and Eu3+ions have been investigated previously.[20,21]Here, an explicit level scheme was made to make clear the procedure of energy transfer in Fig.4.Under excitation upon of 362 nm,the Tm3+ions in ground-state are stimulated to1D2energy level by absorbing the pumping energy,then the ions in high energy level release a part of the energy to1G4level through nonradiative transition (NR). Simultaneously, the energy of1G4attenuates to the6H3level with 452 nm(blue)radiation. The Tb3+ions in the ground state absorb the excitation energy and then jump to the5D2energy level. Because the particles do not have a stable state at5D2energy level,so they will nonradiative relax to the5D4energy level. Meanwhile,491 nm and 544 nm(green)radiations are produced,which originate from the transitions:5D4→7F6,5D4→7F5of Tb3+,respectively.Similarly, the Eu3+ions in the ground state are excited into the5D4, then the transitions of Eu3+:5D0→7F1(591 nm),Eu3+:5D0→7F2(613 nm)will occur.
It can be known from the absorption spectra in Fig. 4,the energy levels between1G4and2D5(5×103cm−1),5D4and5D1(2×103cm−1) are very small. It is expected that the processes of the energy transfer (ET) is easily to occur.Significantly, the ET1 and ET2 will easily occur when Tb3+,Tm3+and Eu3+ions are in a system. It can be observed that the transitions of Tm3+:1G4→Eu3+:2D5(592 nm) and Tb3+:5D4→Eu3+:5D1(614 nm)are generated under the influence of both ET1 and ET2 processes. These two processes will expedite the non-radiative transition of Tm3+:1D2→1G4and Tb3+:5D2→5D4due to the depression in Tm3+:1G4and Tb3+:5D4. Thus, the Tb3+and Tm3+emission intensities drop sharply, while the luminous intensity of Eu3+ascends,which is identical to the changes of Fig.3(b).
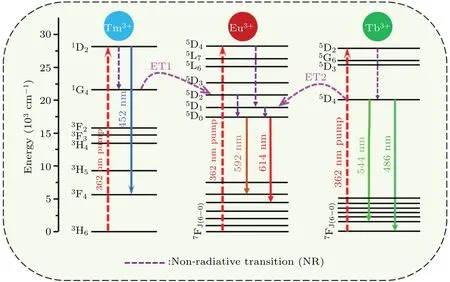
Fig.4. Schematic illustration of the energy transfers in Tm3+/Tb3+/Eu3+ tri-doped Na5Y9F32 single crystal.
3.4. Decay curves and CIE
To further describe the energy transfer processes among Tm3+,Tb3+and Eu3+ions,Fig.5 reveals the decay curves of Tb3+: 542 nm and Tm3+: 452 nm when pumped at 362 nm.The measured data is excellently assessed by the double exponential fitting[22,23]

whereτ1andτ2are the rapid and slow lifetimes for exponential components, respectively.A1andA2are the correlative parameters obtained by fitting.
According to the average time obtained by calculation,the efficiency of ET1 and ET2 can be ascertained by the formula[24,25]

whereτ0is the average time of sample D at 452 nm and 544 nm in the absence of Eu3+, andτsis the average time of samples E,F,G at 452 nm and 544 nm in the presence of Eu3+.Table 2 lists the detailed lifetimes and the energy transfer efficiencies. In Table 2,as the Eu3+concentration increases,the lifetimes of Tm3+:452 nm,Tb3+:544 nm decrease,while the energy transfer efficiency increases gradually, indicating the possible energy transfer of Tm3+→Eu3+,Tb3+→Eu3+.
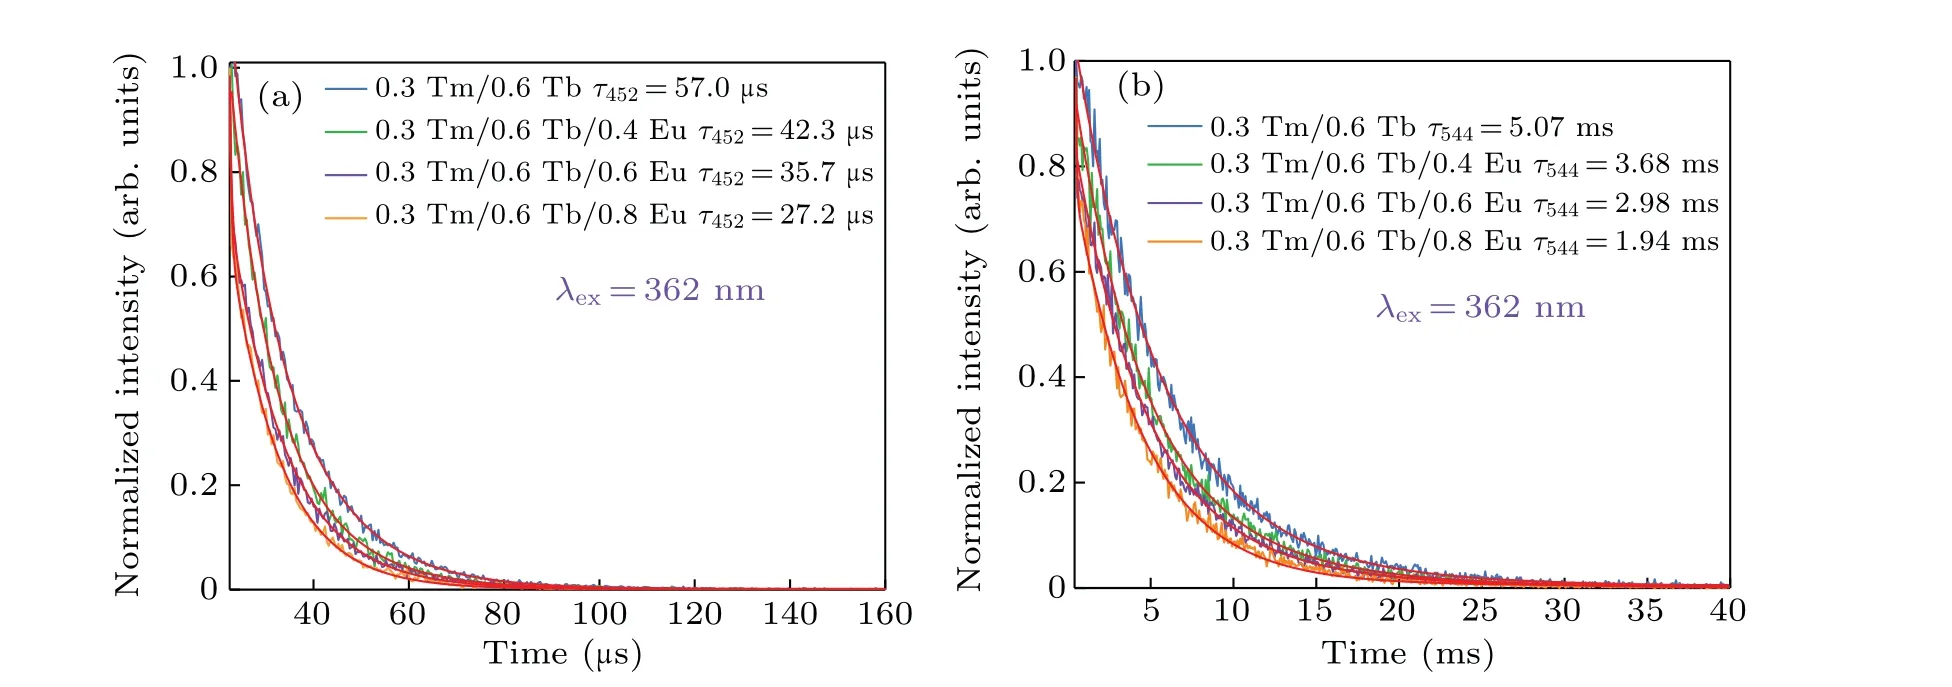
Fig.5. (a)Decay curves of the samples D,E,F and G at 452 nm. (b)The samples D,E,F and G at 544 nm, respectively. The red line is a nonlinear fitting.

Table 2. The average decay lifetimes of the 452 nm, 544 nm and energy transfer efficiencies of ET1,ET2 when excited by 362 nm.
Figure 6 presents the CIE chromaticity coordinates and CCT of the prepared crystals. In Fig.6,the color of the emitted light changes from blue to cool white,emission accompanied by increasing the Eu3+content. Furthermore, the CCT can be defined by[26]

wheren=(x −0.3320)/(y −0.1858),xandyare CIE chromaticity coordinates. When the Eu3+concentration comes to 0.8 mol%, the CIE chromaticity coordinates and CCT are(0.2995, 0.3298) and 6586 K, which suggest that cool white emission can be realized in Na5Y9F32single crystal when pumped at 362 nm.
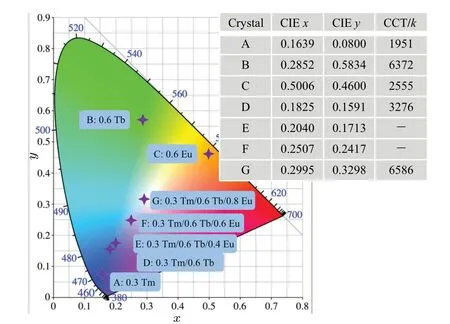
Fig. 6. The chromaticity CIE diagram of prepared samples under 362 nm excitation. The inset table shows the detailed values of color coordinates and correlated temperatures.
3.5. Quantum yield and temperature-dependent emission spectra
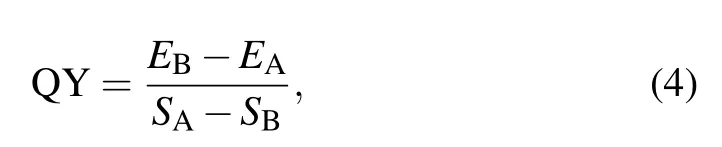
The quantum yield is a factor that can not be ignored,as is depicted in Fig. 7. The QY of prepared sample G is measured by the integrating sphere and can be confirmed by the equation[27,28]
whereEAandEBare the integrated emission intensities of the BaSO4powder reference and the sample,respectively.SAandSBare the integrated scattered intensities of the reference BaSO4powder and the sample, respectively. The QY equals to∼15.16%. According to the previous reports, we found that the value of 1 mol% Dy3+/0.8 mol% Sm3+co-doped Na5Y9F32single crystal is higher than that of Tb3+/Eu3+co-doped GC containing KY3F10(13%),[29]Dy3+/Eu3+codoped LiLuF4single crystal (11%),[30]and Ce3+/Tb3+codoped Li3Sc2(PO4)3(9%).[31]The present Tm3+/Tb3+/Eu3+co-doped Na5Y9F32single crystal shows relatively high internal quantum efficiency.
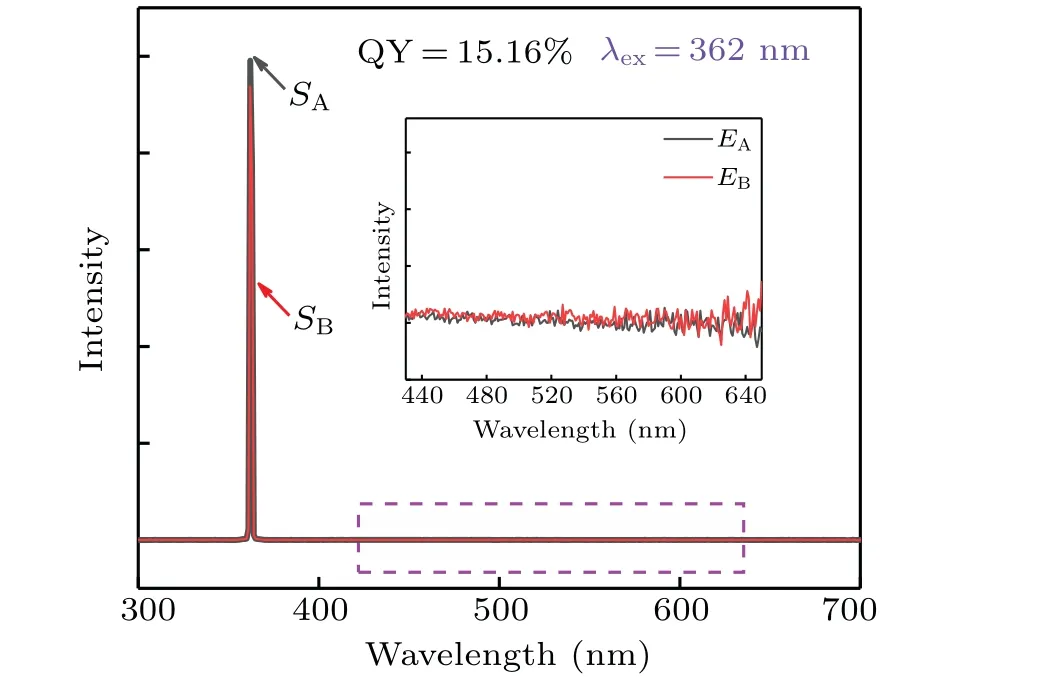
Fig. 7. The absorption and emission spectra collected by an integrating sphere to calculate the quantum yield of sample G.The inset is the enlarged part,which is marked with a dashed blue line.
When white light sources are developed and applied in real life,many other parameters need to be considered. Thermal stability is also a crucial parameter, which can heavily affect the function of white LED devices.[32]Generally speaking, the optical materials are subjected to a thermal quenching, which means that the emission intensity will continue to weaken when elevating the working temperature. Hence,it is essential to study the temperature-dependent behaviors of the obtained crystals.
Figure 8(a)displays the temperature-dependent emission spectra of the sample G within the range of 300 K–450 K.It is clearly observed that the emission intensity decreases with the rise of the temperature. As described in Fig.8(b),the normalized emission intensity of the sample G at 450 K retains about 64%of the initial intensity at 300 K.The value is superior to that of the Y2SiO5phosphor: Ce3+/Tb3+/Eu3+(∼21%);[33]the oxide glasses: Bi3+/Eu3+(∼46%).[34]Indicating that the Na5Y9F32crystal has excellent stability as a matrix carrier.This probably relates to phonon interaction in the host matrix.The result implies that the Na5Y9F32single crystal possesses good thermal stability within the range of 300 K–450 K. Simultaneously,the activation energy(∆E)is also calculated by the following formula:[35,36]

whereI0is the initial intensity at 300 K,ITrepresents the intensity at temperatureT,Apresents a constant andKis 8.617×10⁻⁵eV. ∆Eis equivalent to 0.271 eV from the fitting slope in Fig. 9(b). The value is higher than that of K3La(PO4)2phosphors: Tm3+/Tb3+/Eu3+(0.2 eV).[37]All evidence hints that the Na5Y9F32single crystal triply doped with Tm3+/Tb3+/Eu3+possesses good thermal stability.
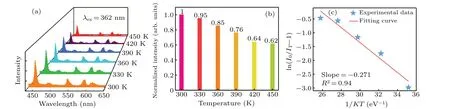
Fig.8. (a)Temperature-dependent emission spectra of the sample G under 362 nm light excitation. (b)Normalized integrated emission intensity in a temperature range from 300 K to 450 K.(c)The plot of ln(I0/IT −1)against 1/(KT)for crystal G.
4. Conclusion
Our experiment demonstrated that Tm3+,Tb3+and Eu3+ions could be effectively incorporated together into Na5Y9F32single crystals. The color of the obtained samples was shifted from blue to white by adjusting the content of Eu3+under 362 nm excitation. The existence of the energy transfers of Tm3+→Eu3+(ET1) and Tb3+→Eu3+(ET2) was fully proved by their emission spectra, fluorescence lifetimes and the energy transfer efficiencies of ET1 and ET2 were estimated as 52.3%and 61.7%, respectively. Importantly, an ideal cool white emission was obtained from sample G with CIE coordinate(0.2995,0.3298).
Moreover, the emission intensity of the obtained sample could still maintain∼62% high at 450 K with an activation energy (0.271 eV). The QY of the sample was counted as∼15.16%. All these findings hint that Na5Y9F32crystal triply doped with Tm3+,Tb3+and Eu3+has a good future in w-LED applications.
Acknowledgements
Project supported by the National Natural Science Foundation of China (Grant No. 62275133), the Natural Science Foundation of Zhejiang Province of China (Grant No. LY22E020002), the Natural Science Foundation of Ningbo (Grant Nos. 2021J077 and 202003N4099), and K.C.Wong Magna Fund in Ningbo University.
猜你喜欢
杂志排行

Chinese Physics B的其它文章
- Fault-tolerant finite-time dynamical consensus of double-integrator multi-agent systems with partial agents subject to synchronous self-sensing function failure
- Nano Ag-enhanced photoelectric conversion efficiency in all-inorganic,hole-transporting-layer-free CsPbIBr2 perovskite solar cells
- Low-voltage soft robots based on carbon nanotube/polymer electrothermal composites
- Parkinsonian oscillations and their suppression by closed-loop deep brain stimulation based on fuzzy concept
- Temperature dependence of spin pumping in YIG/NiO(x)/W multilayer
- Interface effect on superlattice quality and optical properties of InAs/GaSb type-II superlattices grown by molecular beam epitaxy