Simulation of the Impact of Breakwaters on Hydrodynamic Environment in Laizhou Bay, China
2022-12-27HUKaiyuZHANGWeiandWANGXiuhai
HU Kaiyu , ZHANG Wei, and WANG Xiuhai
1) Department of Physics, Imperial College London, SW7 2BX, UK
2) Qingdao Boyan Marine Environmental Technology Co., Ltd., Qingdao 266000, China
3) College of Environmental Science and Engineering, Ocean University of China, Qingdao 266100, China
Abstract The construction of two sand breakwaters in Guangli Port might cause changes to the marine environment of Laizhou Bay. Tidal flow field and conservative substance transport are simulated by a two-dimensional hydrodynamic model MIKE21 to assess the impact of breakwaters on the hydrodynamic environment. The results show that the construction has minor influences on the tidal currents. The changes mainly occur in the region near the port (about 20 km2 in area). The directions of currents during flood tide and ebb tide veer less than 20 degrees, and a maximum change in speed of (0.87 ± 0.1)m s-1 occurs in between the breakwaters during ebb tide. However, the self-purification ability of Laizhou Bay is significantly reduced according to the conservative substance transport model, especially in the southwest (about 100 km from the Guangli Port to the estuary of Xiaoqinghe River), where the water exchange rate decreases by 10% – 20%. The breakwaters slow down the northward current during ebb tide, which causes the accumulation of pollutants.
Key words hydrodynamic environment; tidal flow; conservative substance transport; MIKE21
1 Introduction
Breakwaters are widely used to protect coastal areas,such as ports and ship wharf, from wave action. Generally,breakwater is a coast-parallel structure close to the surfzone. There is a wide variety of breakwaters, including detached breakwater, emerged breakwater, submerged or low-crested breakwater, floating breakwater and so on.Breakwaters often cause accumulation in the lee zone and results in erosion effects in adjacent regions. Thus it is vital that the coastal impact of breakwaters is taken into account when carrying out an environmental impact assessment for a port (Thomalla and Vincent, 2003; Saneet al., 2007). The breakwater shelters partly from the waves. However, as the waves diffract into the sheltered area,a complete shelter cannot be obtained. Wave-overtopping of submerged or low breakwaters will cause an additional supply of water in the area behind the breakwater, and consequently some compensation currents running out the sheltered area. The wave set-up on the foreshore is less in the sheltered area than outside, which gene- rates local currents towards the sheltered area along the foreshore from both sides of the breakwater so that two eddies develop (Thomalla and Vincent, 2004). These eddies also develop in the case of oblique wave approach.
By modifying hydrodynamic conditions, the breakwaters mainly affect the morphological conditions in two ways (Vaselali and Azarmsa, 2009): 1)The littoral transport in the lee side of the breakwater decreases due to wave attenuation and weakened tidal currents in the area sheltered by the breakwater, which causes trapping of sand behind the breakwater depending on the local setting.As a rule-of-thumb, the trapping of sand will develop into a tombolo formation connecting the breakwater and the shore by sand deposits, if the length of the breakwater is equal to or longer than 0.8 times the distance between the shore and the breakwater. 2)The trapping of sand, especially if a tombolo has developed, will cause lee side erosion drift of the breakwater. What’s more, there are more parameters involved in breakwaters, so it is possible to manipulate the transport in a more refined manner. Besides, the long breakwater also causes major changes in the flow pattern. There are increasing current speeds towards the lee zone, high current speeds close to the breakwater heads and circulation in the downstream end of the lee zone (Zhaoet al., 2019, 2021; Tanget al., 2021). This current pattern and the corresponding sediment transport pattern cause the formation of a tombolo. There will also be local scour close to the breakwater heads. The eddy in the lee zone will remain, even after the tombolo has formed, and the current around the upstream head of the breakwater will increase with a higher offshore component. If the breakwater is fairly short, the flow pattern will be quite different. There will be no high currents at the breakwater heads and only a minor tendency for eddy formation and slight changes in the general pattern of the tidal current. The morphological response to such a breakwater will be a smooth salient in the shoreline(Rosatiet al., 1992; McCormick, 1993). In this way, a tombolo will not form and there will be no scour holes at the end of the breakwater heads. Therefore, it is of great significance to investigate the effects of breakwaters on the hydrodynamic environment.
Laizhou Bay (Fig.1)is located in the southern Bohai Sea, north of the Shandong Peninsula. Wide shoals and suitable temperature and salt conditions make it an important fishery resource utilization and conservation area in China (Luet al., 2017). It is also a typical region where sea-land interactions occur intensively (Yiet al., 2011).In recent years, rapid urbanization and industrialization in Laizhou Bay’s coastal zone (Fanet al., 2019)play an important role in transformation of hydrodynamic environment as well as origination of human-related pollutants (Dinget al., 2016).
Guangli Port, which is located in the west of Laizhou Bay, is mainly for cargo transportation. It is an important carrier for the development of the export-oriented economy of Dongying City. In 2017, two parallel breakwaters with a separation of 2 km were constructed eastward along the axis of the channel. Each breakwater has a length of 15 km. They are used to block sediments that mainly come from the Yellow River and hence protect the channel with a width of 100 m in between them.
Therefore, in term of economic development and environmental protection, it is valuable to study the impact of the new constructed breakwaters to the whole Laizhou Bay. Herein, based on historical observed data, MIKE21,a numerical modelling system with wide applications(Zhouet al., 2014; Machineniet al., 2019; Dahmaniet al.,2021), is used to simulate the tidal flow field in Laizhou Bay before and after the construction of the breakwaters to access their impact on the hydrodynamic environment of this sea area. We also used a conserved substance transport model by MIKE21 to determine the change in self-purification ability to produce a more complete picture of the effects of breakwaters to Laizhou Bay, China.
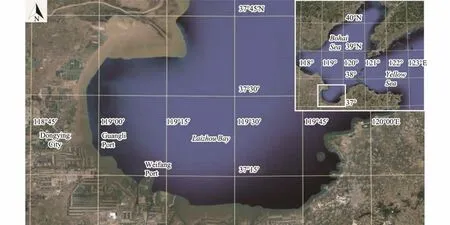
Fig.1 Study area.
2 Methodology
2.1 Model Introduction and Equations
A two-dimensional hydrodynamic model, MIKE21FM by the Danish Hydraulic Institute (DHI), is applied to predict and analyze the impact of marine engineering construction on the hydrodynamic environment. The model uses an unstructured mesh with triangular elements,which can better fit the land boundary and adjust the resolution. MIKE21FM uses the standard Galerkin finite element method for horizontal spatial discretization. An explicit upwind difference scheme is used to discretize the momentum equation and transport equation over time.Mass conservation equation and momentum equations are as follows:


In the above equations,tis time;ζis water level;his still water depth;His total water depth,H=h+ζ;u,vare average current speeds inx,ydirections;gis gravitational acceleration;fis Coriolis coefficient;CZis Chezy coefficient,CZ=M*H1/6, whereMis Manning coefficient;εx,εyare horizontal eddy viscosity coefficients inx,ydirections. Given the boundary conditions (see details in the next Section)and the initial conditions:ζ(x,y,t0)=u(x,y,t0)=v(x,y,t0)= 0, wheret0is the initial time, we can solve the above equations and obtain the water level and current velocities in Laizhou Bay.
2.2 Computational Domain and Grid Setting
The model domain (Fig.2)covers Laizhou Bay within 37.074˚–37.736˚N; 118.733˚–119.949˚E. The mesh consists of 10841 nodes and 15980 elements in total. The minimum space step is about 30 m. In the sea area around the engineering construction, the size of the mesh is decreased to produce a higher resolution. For better comparison, the grid setting remains unchanged after the construction. The bathymetry comes from the 11770 and 11840 nautical charts produced by the Navigation Guarantee Department of the People’s Liberation Army Navy.
In Fig.2, segment AB (from Dengsha River, Liaoning to Jiming Island, Shandong)is the open boundary. The boundary conditions inherit from a larger time tide model of the Bohai sea (Zhanget al., 2015). The six major tidal harmony constants of M2, S2, O1, K1, M4 and MS4 obtained by reconciling the tide level observation data of the Dengsha River (39˚08´N, 122˚06´E)and Jimingdao(37˚25´N, 122˚28´E)ocean stations are used as inputs,and the tide level at the boundary is predicted by MIKE21 forecast mode. Six rivers are modeled as simple sources(i.e., constant discharge approximated by average annual runoff volume in the unit of 108m3– Xiaoqinghe River:24.90; Zimaigou River: 9.40; Guanglihe River: 8.05;Yuhe River: 0.21; Weihe River: 46.60; Beijiaolaihe River:15.70). In the model of Laizhou Bay, the time step of the calculation is adjusted according to the Courant-Friedrichs-Lewy (CFL)condition (Oxley, 2013)to ensure stable calculations. The minimum time step is 0.5 s. The bed resistance is controlled by the Manning coefficient,which is 93 – 105 m1/3s-1. For the horizontal eddy viscosity coefficient, the Smagorinsky formula with consideration of the effect of sub-grid scales is applied (Syedet al.,2021).
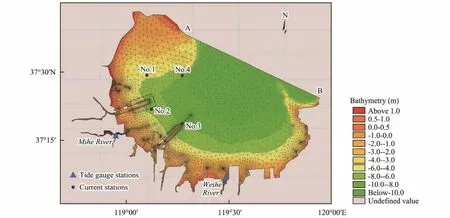
Fig.2 Meshgrid of the model and distributions of testing points. The two breakwaters are in the region enclosed by the dashed line (A, 39˚08´N, 122˚06´E; B, 37˚25´N, 122˚28´E).
2.3 Model Validation Method
To evaluate the performance of the model in simulating the water level and surface current, we compare the model simulation results within-situobservations and calculate the root mean square error (RMSE)and correlation coefficient (R)between them. The tidal height data are measured by two tide gauge stations in the estuary of Weihe River and Mihe River respectively (Fig.3). The ocean current data are observed at four stations (Fig.4).Information of the tide gauges and current observing stations is listed in Table 1.

Table 1 Location of the tide gauges and current stations
3 Results and Discussion
3.1 Validation of the Model Simulations
Fig.3 shows the variation of the water level simulated by the MIKE21 model andin-situmeasurements from two tide gauge stations. One can see that the model simulations are in good agreement with the observations. TheRMSEs in the Mihe River and Weihe River are 0.008 m and 0.017 m with correlation coefficients of 0.99 and 0.99,respectively.

Fig.3 Comparison between model simulated water levels and tide gauge observations in Laizhou Bay. Observing time:2011/3/12 10:00 – 3/13 12:00.
The comparison of the model simulation of tical currents andin-situmeasurements at four stations is shown in Fig.4 and the statistical errors are listed in Table 2. The results show that the model is also able to capture the variation of the tidal currents in the Laizhou Bay. The RMSEs between the model simulated current speeds andfield observations are no more than 0.2 m s-1for three of the 4 stations, and all correlation coefficients are greater than 0.92.
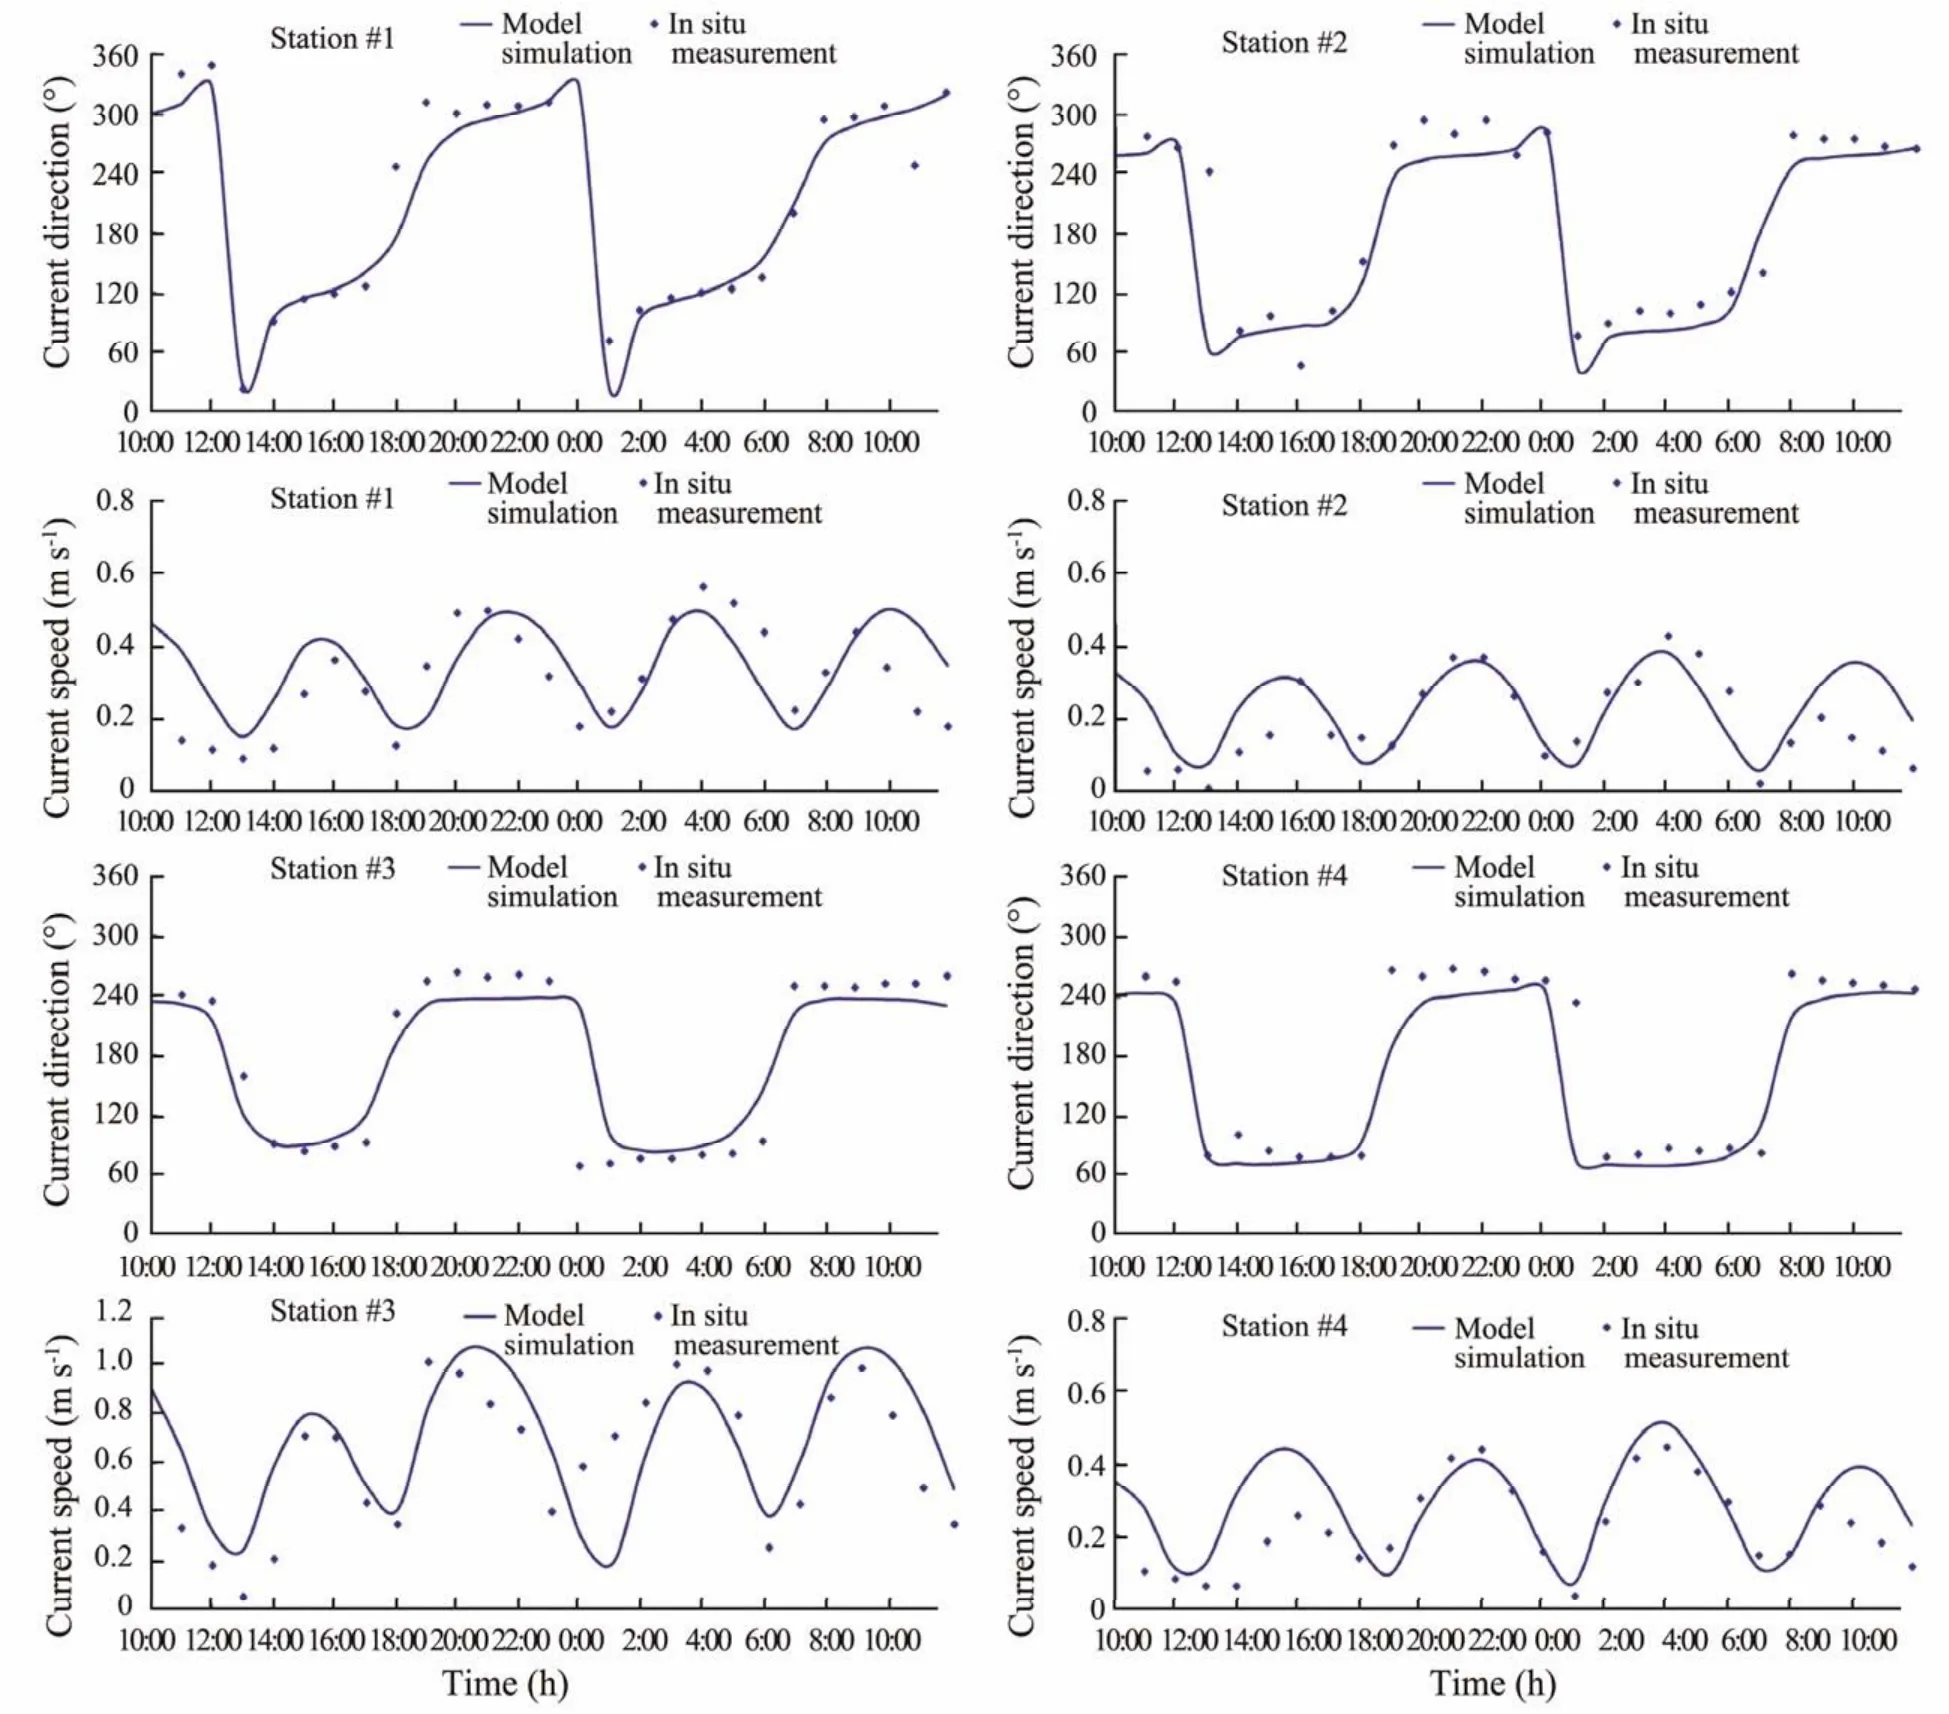
Fig.4 Comparison between model simulated current speeds and directions and in-situ measurements at four stations in Laizhou Bay. Observing time: 2015/6/16 10:00 – 6/17 12:00.
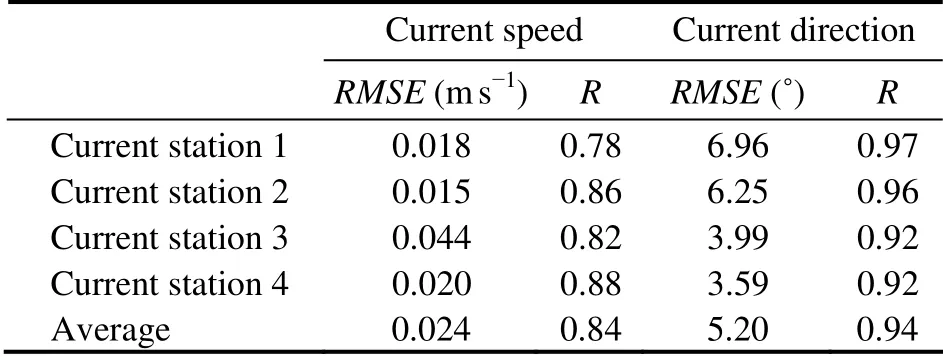
Table 2 Statistical error between model-simulated tidal currents and in-situ observations
3.2 Impact of the Breakwaters on the Hydrodynamic Environment
MIKE21FM simulated tidal flow fields before and after the construction of breakwaters in Guangli Port are shown in Fig.5. We controlled the variables (bathymetry, bed resistance, boundary conditions)for a valid comparison.It can be seen that the construction has a minor impact on the tidal flow field of Laizhou Bay in general. During flood tide, the direction of current changes slightly. We found that the changes mainly occur around the western part of the sand breakwaters (about 20 km2). The direction of current changes by less than 20 degrees. During ebb tide, the change in direction is even smaller (less than 15 degrees in the same region).
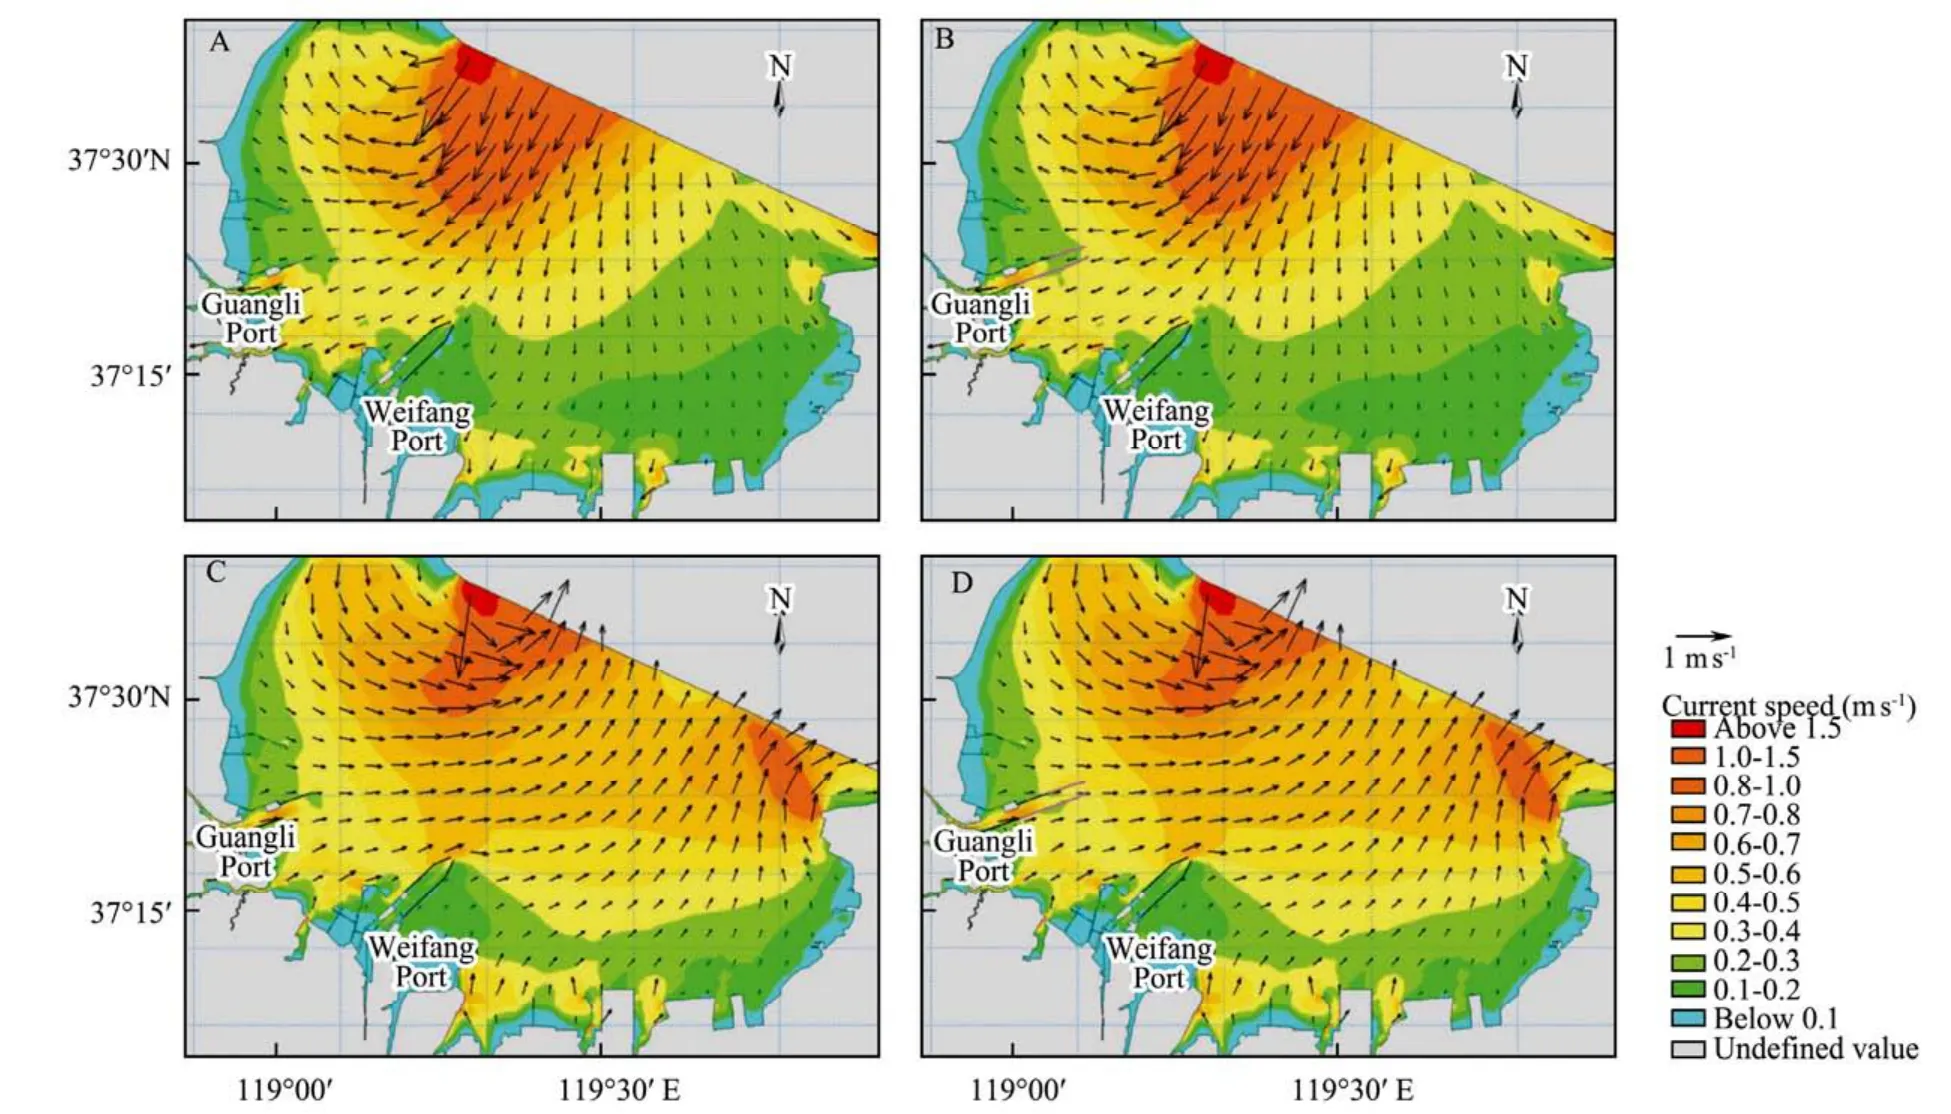
Fig.5 Flow field before and after the construction during flood tide (A, B)and ebb tide (C, D).
The changes in current speed also mainly happen in the area around the port. In Fig.6A, during the flood tide, the speed of the current in the south of the breakwater decreases by less than 0.3 m s-1. The affected region covers about 300 m from the southern breakwater. Between two breakwaters, the current speed increases and the maximum change is (0.48 ± 0.1)m s-1. During the ebb tide, the pattern is similar (Fig.6B). The largest change in speed is(0.87 ± 0.1)m s-1in between the breakwaters. This occurs in a fairly small region, so it is not shown in the diagram.To be more specific, we test the changes in current speeds at several points near the Guangli Port (Fig.7). Table 3 shows that the speed has a relatively large change at Point 6 and Point 7 (located at the channel), compared with the other points. The sea area around the port is barely influenced.

Fig.6 Change of current speed (m s-1)after the construction during flood tide (A)and ebb tide (B).
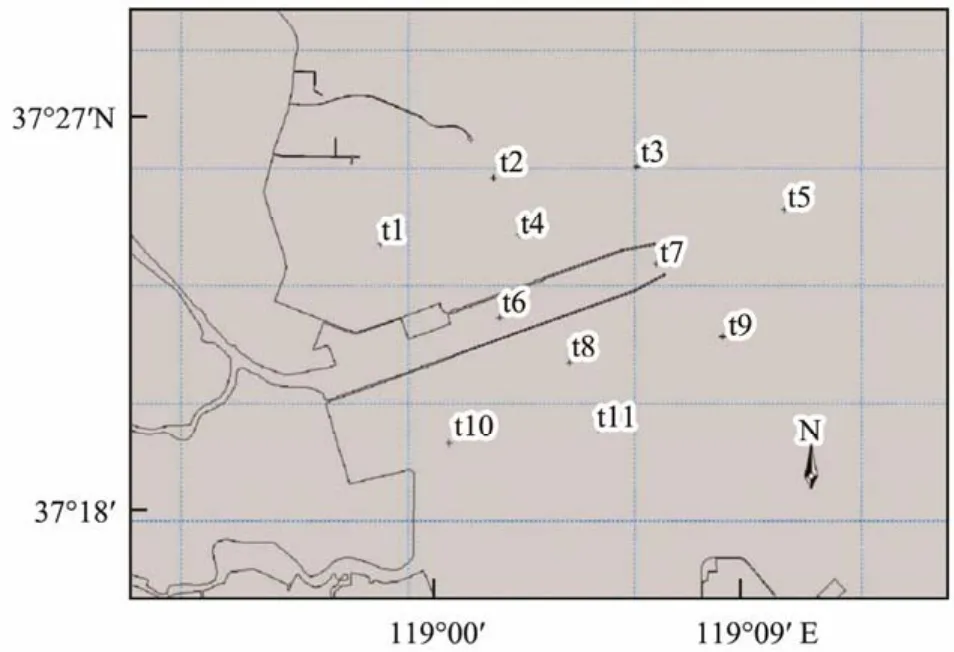
Fig.7 Locations of comparison points.
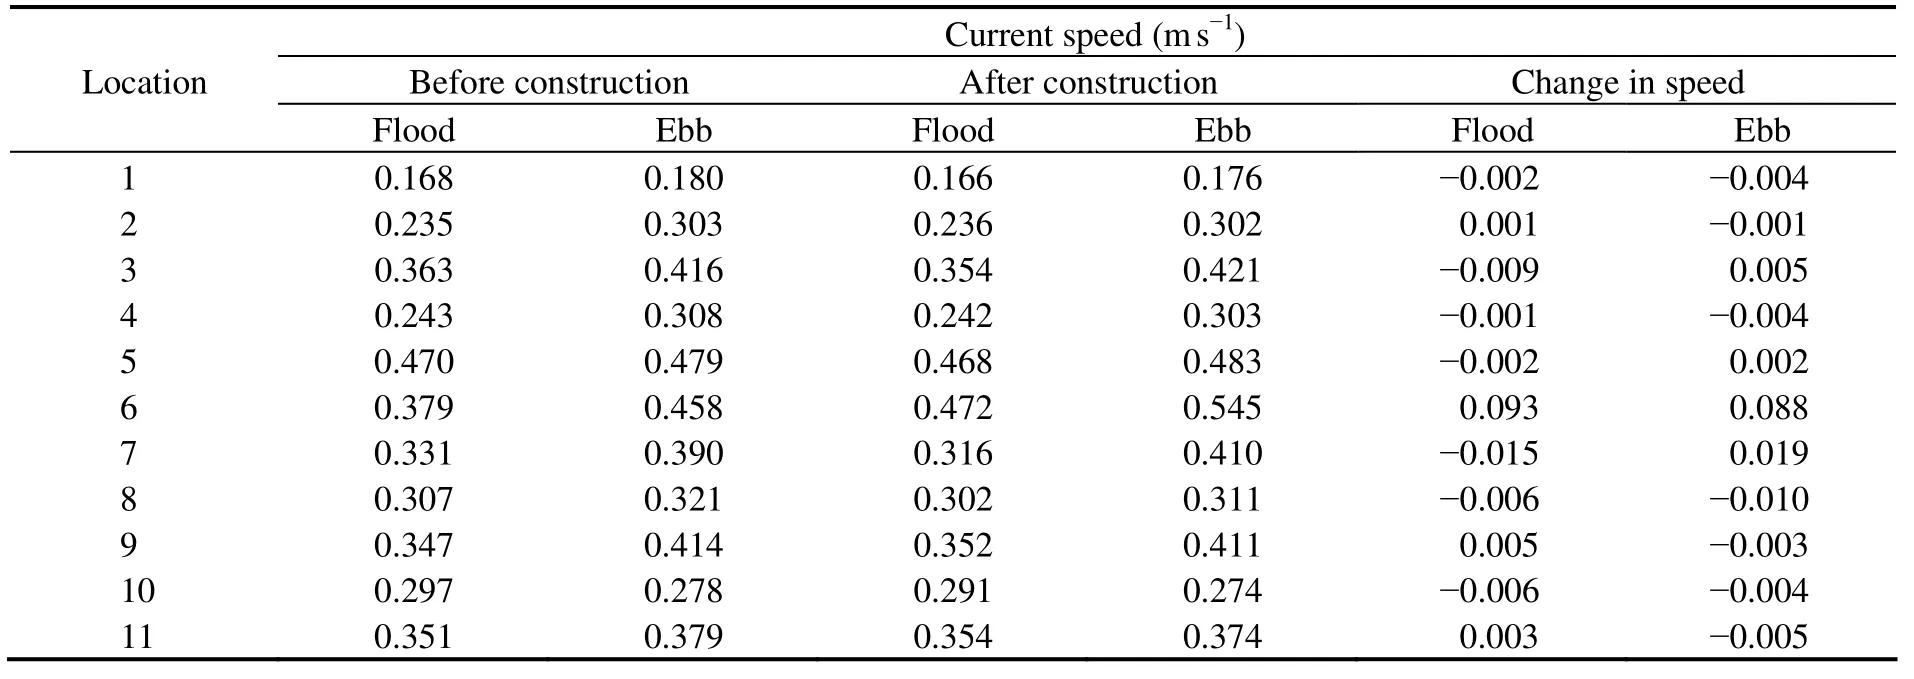
Table 3 The comparison of the current speeds at different points around the Guangli Port before and after the construction of two sand breakwaters
Combining the figures and table, we can know that the construction of the breakwaters has a small impact on tidal currents as it is oriented almost parallel to the current. The construction of breakwaters prevents the sediment (mainly comes from the Yellow River)from entering the channel. It also makes the speed of flows in the channel greater and reduces the disturbance of currents in other directions.
3.3 Impact of the Breakwaters on Self-Purification Ability
In the conservative substance transport model, we set up that the whole computational area of Laizhou Bay is initially filled by contaminants and there are no sources of pollution. MIKE21FM numerical simulation method is used to simulate water exchange rate distributions after 5,15 and 30 d to assess the effect of the construction on the conservative substance transport. Water exchange rate is defined as 100% minus the percentage of contaminants.Bathymetry, bed resistance, boundary conditions remain unchanged to determine the impact of the breakwaters to the water exchange rate.
Figs.8 and 9 show that the construction reduces the self-purification ability of Laizhou Bay. The water exchange rate decreases in general, especially in the south of Guangli Port. The region covers about 100 km2from the port to the estuary of the Xiaoqinghe River. The reduction of the water exchange rate is 10% – 20%. In the model, we assume the Xiaoqinghe River is a pure water source. In reality, the water exchange rate in the area is lower as the river is polluted. The result shows that the construction has a negative influence on the aquaculture in the southeast of Laizhou Bay.
4 Conclusions
MIKE21 is applied to simulate the hydrodynamic environment of Laizhou Bay. The simulations of tidal flow and conservative substance transport are introduced to analyze the impact of the construction of 2 breakwaters in Guangli Port. The analysis results are listed as follows:
1)The construction has no significant effects on the tidal currents. The changes mainly occur in the region near the port, where the change of current speed and direction does not exceed (0.87 ± 0.1)m s-1and 20 degrees during both flood and ebb tide.
2)The transport model indicates that the construction of breakwaters reduces the self-purification ability of the whole bay, especially in the southeast, where the water exchange rate decreases by 10% – 20%. This causes more pollution and does greater harm to the culture fishery near the estuary of Xiaoqinghe River.
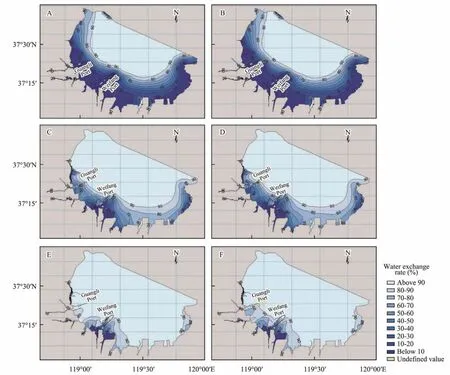
Fig.8 Water exchange rate (%)distribution with and without the construction after 5 d (A, B), 15 d (C, D), 30 d (E, F).
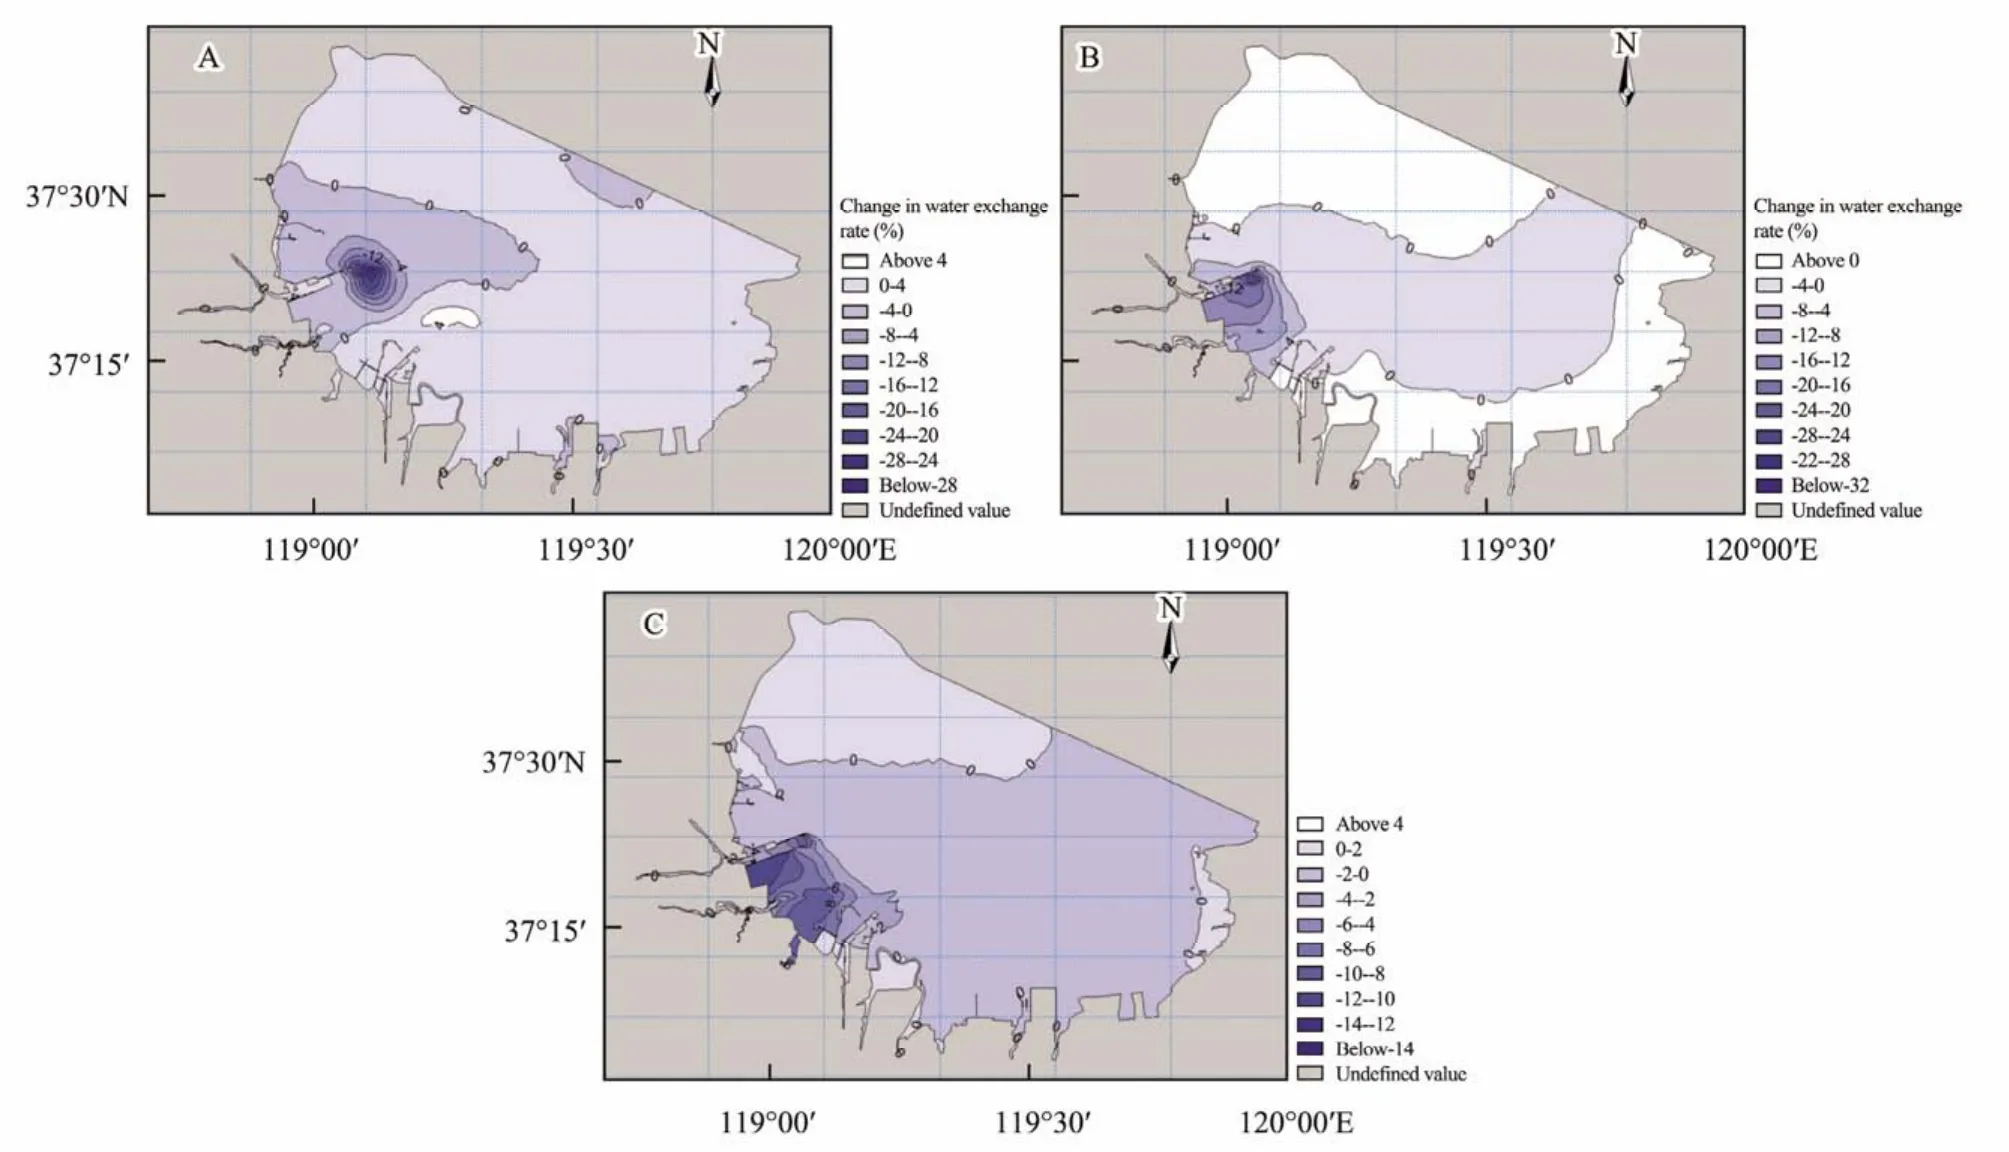
Fig.9 Difference in water exchange rate caused by the construction of breakwaters after 5 d (A), 15 d (B), 30 d (C).
3)This study demonstrates that the MIKE21 numerical simulation method can produce precise and valid data of currents and substance exchange rates, and the tidal flow model and substance transport model can be applied in marine engineering and environmental impact assessment to provide valuable information in public marine planning and management.
Acknowledgement
This study was financially supported by the Doctoral Research Funds of Ocean University of China (No. 2021 61038).
杂志排行
Journal of Ocean University of China的其它文章
- A Theoretical Model for the Microwave Emissivity of Rough Sea Surfaces
- Mechanism of Regional Subseasonal Precipitation in the Strongest and Weakest East Asian Summer Monsoon Subseasonal Variation Years
- Analytical and Experimental Studies on Wave Scattering by a Horizontal Perforated Plate at the Still Water Level
- Theoretical Prediction of the Bending Stiffness of Reinforced Thermoplastic Pipes Using a Homogenization Method
- Penetration Resistance of Composite Bucket Foundation with Eccentric Load for Offshore Wind Turbines
- Application of Converted Displacement for Modal Parameter Identification of Offshore Wind Turbines with High-Pile Foundation
