Microplastics in Surface Waters and Floodplain Sediments of the Dagu River in the Jiaodong Peninsula, China
2022-12-27JIAOJieCHENGangYANGZechuanLIZhengyanandHUHong
JIAO Jie, CHEN Gang , YANG Zechuan, LI Zhengyan, and HU Hong,
1) College of Environmental Science and Engineering, Ocean University of China, Qingdao 266100, China
2) College of Marine Life Science, Ocean University of China, Qingdao 266100, China
Abstract To understand the pollution characteristics and distributions of microplastics in the Dagu River, an important inland river that flows to Jiaozhou Bay, the abundance, particle size, shape, color, and polymer type of microplastics in the surface waters and floodplain sediments were investigated. The results showed that the abundance of microplastics in the surface waters varied between 0.68 and 3.96 items L-1. The abundance of microplastics in the floodplain sediments varied between 115.5 and 495 items kg-1.The distribution of microplastics in the river has obvious characteristics: 1)The abundance of microplastics downstream was significantly higher than that upstream. 2)The abundance of microplastics decreased significantly in the estuary. 3)The abundance of microplastics was higher in densely populated areas. 4)Factors such as effluent discharge from sewage treatment plants and inflow of tributaries affect the abundance of microplastics in rivers. The main polymer types of microplastics were polypropylene (PP), polyethylene (PE), and polyvinyl chloride (PVC). Both the abundance and polymer types of microplastics show a positive correlation between the surface waters and floodplain sediment samples, indicating that the microplastics in surface waters and floodplain sediments come from the same source. The present study demonstrates that the abundance, distribution, and sources of microplastics might be affected by geology, hydrogeology, land use types, and anthropogenic activities. This study provides basic data for the study of microplastics in rivers and provides a reference for the establishment of microplastic control measures.
Key words microplastics; surface water; floodplain sediment; distribution; Dagu River
1 Introduction
Plastics with a particle sizeless than 5 mm are classified as microplastics (Law and Thompson, 2014; Langet al., 2020). Microplastics are widely distributed in both marine and freshwater environments (Eerkes-Medranoet al., 2015; Jabeenet al., 2017). Research into microplastics has increased rapidly due to greater awareness of the potential risks and biological effects. Microplastics are difficult to degrade (Saitet al., 2020)and exist in environments for a long time (Cózaret al., 2014). Microplastics have been identified as a serious global pollutant problem and are considered a serious threat to the environment by the United Nations Environment Program(UNEP, 2014), the European Commission’s SCHEER committee (SCHEER – Scientific Committee on Health Environmental and Emerging Risks, 2018). To control the increase in microplastic pollution, comprehensive monitoring of microplastic pollution must be undertaken.
Despite significant research into microplastics in the marine environment, information on the quantity, sources,and impacts of microplastics in rivers is still limited(Blettleret al., 2018; Koelmanset al., 2019). As a crucial carrier in freshwater ecosystems, rivers connect land to the sea and are the main source of marine microplastic pollution (Lebreton and Andrady, 2019). Recently, scientific concern for microplastics in rivers has rapidly increased, with some studies showing that microplastics in rivers are widespread and are not only concentrating microplastic pollution from land but are also an important source of microplastic pollution entering the sea (Lebretonet al., 2017).
However, research on microplastics in rivers is mainly concentrated on river mouth areas (Zhaoet al., 2015; Wesselet al., 2016). Although recent studies on microplastics in the whole river reach have been carried out (Qiet al., 2019; Gonget al., 2020; Tienet al., 2020), there are still many rivers for which there is no information on microplastic pollution, and there are relatively few comparative and correlation analyses conducted between microplastics in surface waters and floodplain sediments.There is a clear need for more investigation into the quantities, distribution, and source of microplastic pollution in rivers in different regions.
The Dagu River is the largest in the Jiaodong peninsula,which is one of the most rapidly developing regional economic centers of East China. The Dagu River is an important drinking water source and is called the mother River of Qingdao. It is also responsible for the largest input of freshwater, sediment, and pollutants to Jiaozhou Bay (Wanget al., 2014).
In the present study, 14 survey stations from the headwater to the estuary area along the Dagu River were selected. The abundance, morphology, and polymer composition characteristics of microplastics in the surface waters and floodplain sediments were investigated, revealing the characteristics and distribution of microplastic pollution in the basin, and we have analyzed the sources of the microplastics. This study provides a theoretical basis and data support for understanding the transport characteristics and sources of microplastics in rivers.
2 Materials and Methods
2.1 Research Area and Station Layout
The Dagu River is the largest in the Jiaodong Peninsula,which is the regional economic center of East China. It originates from the Fushan mountain of Zhaoyuan County,Yantai, flows through the western part of the Jiaodong Peninsula, and finally flows into Jiaozhou Bay at Matou Village. The Dagu River is approximately 180 km long,with a basin area of 4900 km2and an average annual rainfall of 644.7 mm. Dagu River Basin is located in the warm temperate zone of North China and the coastal humid monsoon climate zone. It is hot and rainy in summer,cold and dry in winter, and moderate in spring and autumn with little rain (Wanget al., 2014). Through field investigation, it is found that there are no large towns and cities in the upper reaches of Dagu River and the population density is small, while there are large towns and cities, industry, and aquaculture in the lower reaches of Dagu River, with dense population and complex human activities. The terrain of the basin is high in the north and low in the south, and the terrain slope gradually becomes slow from north to south. The upper reaches of the Dagu River flow through the countryside, and the lower reaches of the river flow through large towns and cities. There are many tributaries to the Dagu River, and several reservoirs and dams have been constructed along the trunk stream.Therefore, the Dagu River has several cutoffs, especially in the upper reaches of the river.
A field survey of microplastics in the surface waters and floodplain sediments of the Dagu River was carried out between August 8 and August 12, 2019. 14 survey stations were selected in the mainstream of the Dagu River. The detailed location and sampling sites are shown in Fig.1 and Table 1.
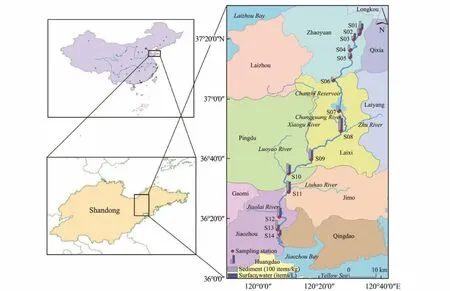
Fig.1 Geographic locations and sampling station in Dagu River.
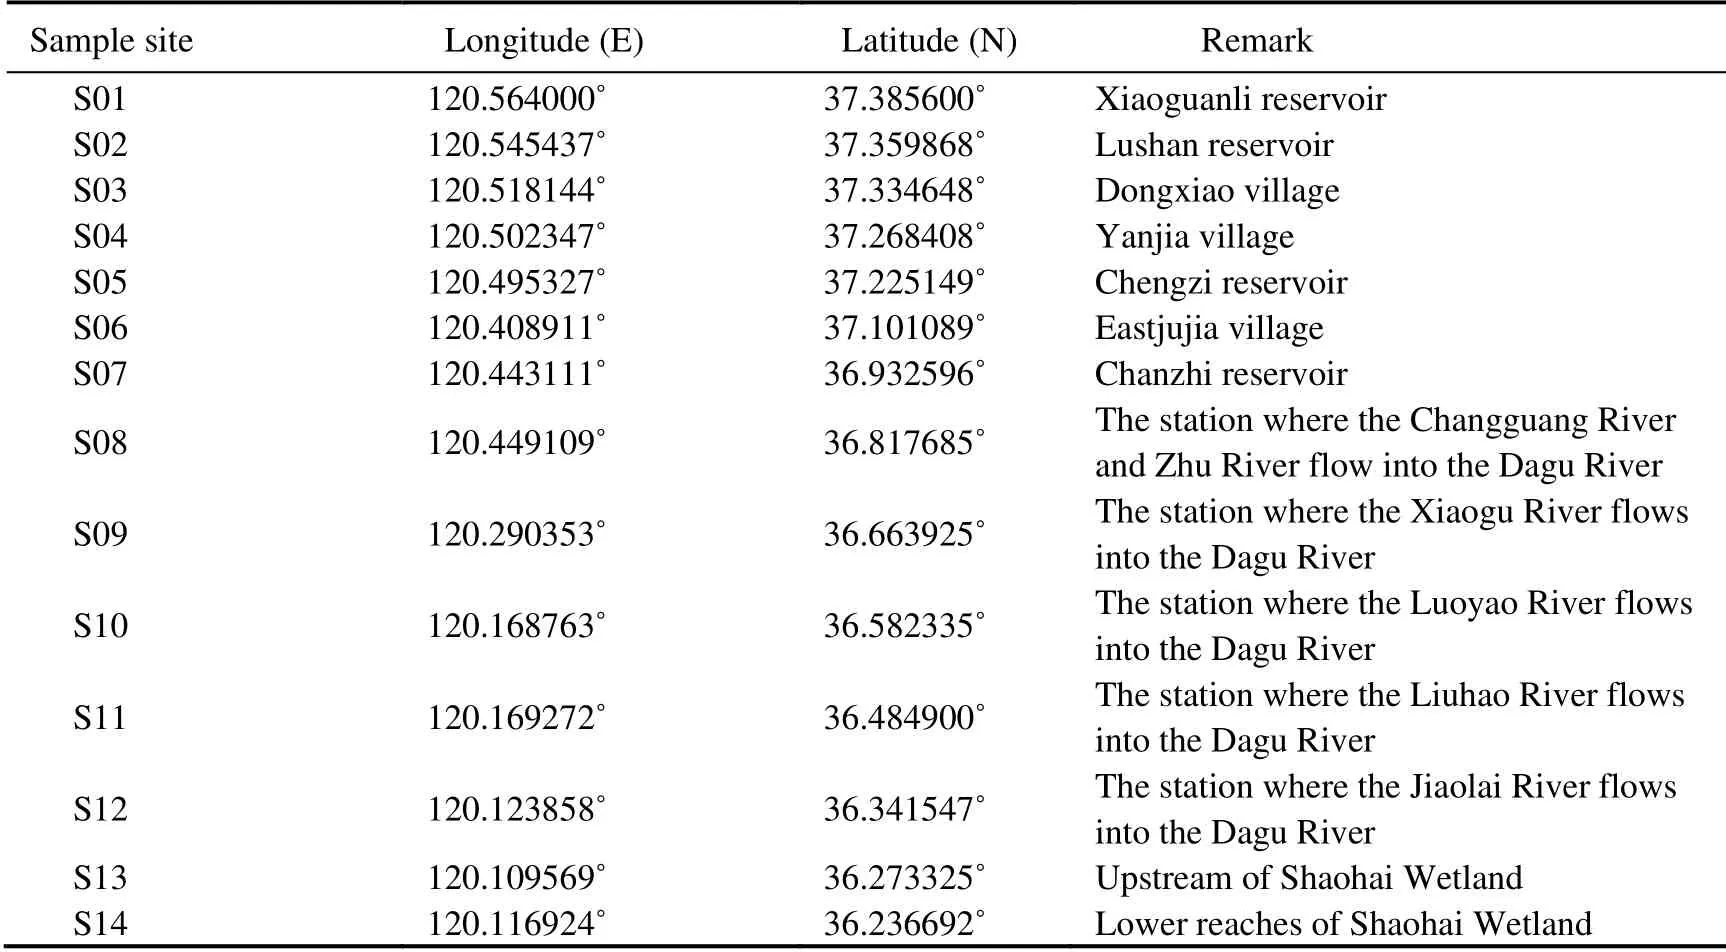
Table 1 Sampling station of the Dagu River
2.2 Sample Collection
Three parallel samples were collected at one sampling station. At each sampling point, 50 L of surface water(water depths were typically less than 50 cm)by used in a pre-cleaned stainless steel bucket and filtered through a plankton net (64 μm mesh size). All the microplastics remaining in the bottom collector after filtering were transferred to a glass sampling bottle, which was labeled and stored away from light.
For floodplain sediment sampling, three parallel samples were collected at one sampling station, each with a sampling area of 15 cm × 15 cm and a thickness of 5 cm on the banks of the river. Floodplain sediments were collected into glass bottles by a steel hand shovel. The samplings are away from light and air-dried to a constant weight at the laboratory.
At each station, water samples were collected for water quality analysis, according to the Technical Specifications Requirements for Monitoring of Surface Water Waste Water (HJ/T 91-2002).
2.3 Sample Preparation
Microplastics in the surface waters were separated using the previously reported method, with a little adjustment (Dinget al., 2019). Firstly, the water sample was passed through a 0.45 μm glass filter membrane by a diaphragm vacuum pump. The filter paper was then rinsed with 30% hydrogen peroxide (Wanget al., 2018; Rose and Webber, 2019). The rinse solution was collected in a conical flask with 0.1 g FeCl2added (Wenet al., 2018;Aliabadet al., 2019). Finally, the conical flask was incubated in a water bath at 60℃ for 24 h to remove organic matter and other substances that may affect the subsequent microscopic observation.
The digested sample was filtered using a series of stainless steel sieve apertures: 2, 1, 0.5, 0.1 and 0.01 mm turn, and the different particle sizes of debris trapped in each sieve were flushed carefully into five Petri dishes by a syringe filled with ultra-pure water. The samples were dried at 60℃ for the following analysis.
The microplastics were isolated from floodplain sediment samples by the previous method with modifications(Stocket al., 2019; Kor and Mehdinia, 2020). Firstly, the dried floodplain sediment samples were evenly spread on an enamel plate, then put in a beaker using a spoon (300 g), and 1 L high-density (1.5 g mL-1)ZnCl2was added,stirred with a clean glass rod for 5 min, and left to stand for 5 h. Finally, the upper liquid was transferred into another beaker and left to stand for 5 h; this step was repeated twice. The upper liquid layer was collected and used for microplastic separation by the method described above.
2.4 Characterization of Microplastics
The abundance, color, particle size, and shape characteristics of microplastics were examined under the microscope (JNOEC XS-212-202). The microplastic abundance in surface waters was expressed as items L-1(number of microplastics in the surface water per liter), and that in the sediments of the floodplain was expressed as items kg-1(number of microplastics in the floodplain sediments per kg).
Microparticles (200 items)were randomly selected for infrared microspectrometer analysis (Nicolet iN10 IR Microscope, Thermo Fisher, America), including 100 from the floodplain sediments and 100 from the surface waters. The scanning spectrum range was 400 – 4000 cm-1,and the obtained spectrum was compared with the standard spectrum (OMNIC 8.2)to determine the polymer type of the microplastics. All the 200 particles were identified as microplastics.
To avoid potential artificial and airborne plastic contamination in the laboratory, all instruments and containers were carefully rinsed with ultra-pure water and tightly wrapped in tin foil and the laboratory was kept clean at all times. Lab coats, mask covers, and gloves were worn throughout the sample collection and laboratory analysis.Blanks were conducted in parallel as a control during all phases of the analytical procedure and no microplastics were found in the blank group.
2.5 Water Quality Determination
Temperature (T), pH, electrical conductivity (EC), and dissolved oxygen (DO)were measuredin situusing a portable multi-parameter water quality tester (HACH HQ40d). After collection, the water samples were kept on ice and transferred to the laboratory within 24 h. To analyze other parameters, such as five-day biochemical oxygen demand (BOD5), permanganate index (CODMn), total nitrogen (TN), total phosphorus (TP), ammonia nitrogen(NH4-N), nitrate-nitrogen (NO3-N), nitrite (NO2-N), orthophosphate (MPO4), and suspended substances (SS),water samples were transferred to the laboratory and were analyzed using the methods described in the Technical Specifications Requirements for Monitoring of Surface Water Waste Water (HJ/T 91-2002).
2.6 Data Analysis
Data and descriptions were analyzed using Microsoft Excel 2010 and SPSSvs. 22 (IBM). One-way analysis of variance (one-way ANOVA)was used to classify and test the regional significance of microplastic indicators at different stations (P< 0.05, least significant difference).The Pearson coefficient was applied to study and interpret the relationships and interactions among the microplastics and water quality indicators. A correlation coefficient close to 1 or -1 indicates the strongest positive or negative correlation between two variables, while a value close to 0 indicates that there is no linear relationship between them at a statistically significant level withP< 0.05 and/orP< 0.01.
3 Results and Discussion
3.1 Abundance of Microplastics
The abundance of microplastics in surface waters and floodplain sediments is presented in Fig.2. The abundance of microplastics in surface waters varied from 0.68 items L-1to 3.96 items L-1, with an average abundance of 1.95 items L-1. The surface waters of the Dagu River have moderate microplastic pollution compared to many other rivers. The abundance of microplastics in the surface waters of the Dagu River was lower than in the Pearl River(0.379 – 7.924 items L-1)(Linet al., 2018). One reason is that microplastic pollution is worse in economically developed or densely populated areas (Xionget al., 2018;Wanget al., 2020). The Pearl River flows through large cities such as Guangzhou, while the Dagu River flows through mainly rural areas. The second reason is that the Pearl River microplastics were collected by a sieve with an aperture of 20 μm, while this study used a sieve of 64 μm, which resulted in different particle sizes of microplastics were collected in the two studies. These two reasons resulted in higher data on the abundance of microplastics in the Pearl River than in this study. The abundance of microplastics in the surface waters of the Dagu River was higher than in the Han River ((0 – 4.29)×10-2items L-1)(Parket al., 2010). One reason is that Han River microplastics were collected with a 100 μm sieve,which resulted in no microplastic samples with a particle size of fewer than 100 μm being collected. In a word, the differences are not only due to the population density and the level of economic development in the areas where these rivers flow but are also closely related to the sampling and separation methods. At present, different microplastics sampling tools are used in different studies,which makes it difficult to compare and analyze microplastics in different study areas.

Fig.2 Abundance distribution of microplastics collected from the Dagu River: (a)from surface waters and (b)from floodplain sediment.
Fig.2a shows that there are significant regional differences in the abundance of microplastics in the Dagu River surface waters at each station because of the various characteristics of sampling sites and the surrounding human activities (Zhaoet al., 2020). The abundance of microplastics at station S08 is the highest, which could be because the station is located at the confluence of the Dagu River, Changguang River, and Zhu River. The Zhu River passes through the urban and industrial areas of Laixi: the main industries in Laixi include food processing, textile manufacturing, rubber materials,etc., all of which could be a source of microplastics (Parket al.,2004; Geyeret al., 2017). Some investigation of microplastics shows that the inflow of tributaries is an important supplement of microplastics to the mainstream (Parket al., 2020; Zhaoet al., 2020). A second possible reason for the highest abundance is that the sampling station is closed to a wastewater treatment plant (WWTP). Many studies have identified WWTPs as an important source of microplastic pollution (Conleyet al., 2019; Xuet al.,2019; Solet al., 2020), but there have been conflicting reports about the contribution of WWTPs to microplastics in rivers (Tienet al., 2020). Experiments have shown that 98% of microplastics can be removed by tertiary treatment technology, indicating that WWTPs have little effect on the abundance of microplastics in rivers (Murphyet al.,2016); however, many WWTPs do not meet these standards and do not monitor effluent microplastics. This study suggests that WWTP is a potential source of microplastics in rivers. The potential impact of microplastic discharge from WWTPs on the pollution of urban rivers deserves further attention.
The abundance of microplastics from S08 to S12 is significantly higher than in the other regions (P< 0.01).The river in this section flows through Laixi, Jimo,Pingdu, and Jiaozhou, which are densely populated and economically developed regions. Previous studies have shown that microplastic abundance is high in economically developed regions (Xionget al., 2019; Wanget al.,2020). Meanwhile, these five sites also have tributary confluence. The abundance of microplastics near the estuary, at stations S13 and S14, was significantly reduced,which may be related to the non-tributary inflow and tidal dilution (Zhaoet al., 2020). A study found that the abundance of microplastics in the surface waters of the Dagu River Estuary was 80 items m-3(Zhenget al., 2019),which was lower than the river in this study. This could be because their sampling site was located in the river mouth downstream of S14, which is more affected by the seawater exchange. The results indicate that water exchange might have a great influence on the abundance of microplastics in estuaries.
At sites S08 – S12, which had high abundances of microplastics, NH4-N and CODMnwere also high (Tables 2 and 3). The correlation analysis shows the abundance of microplastics in surface waters was significantly positively correlated with CODMn(R= 0.677**,P< 0.01)and NH4-N (R= 0.551*,P< 0.01), indicating that water contamination is usually accompanied by microplastic pollution, to a certain extent. One possible reason is that the sources and inflow processes of microplastics are similar to organic pollutants (Kataokaet al., 2019; Wanget al.,2020). For example, factories, WWTPs, and other point sources of pollution release microplastics directly into the river. However, the correlation between microplastic abundance and water quality parameters is not necessarily linear; for instance, the TN and TP of S01 and S02 are relatively high because the river has been polluted by rural non-point sources, but the abundance of microplastics is relatively low, which could be because microplastics from agricultural activities do not go directly into rivers as easily as other pollutants (Liuet al., 2018). More researches are needed to understand the transformation and migration differences between microplastics and other pollutants.
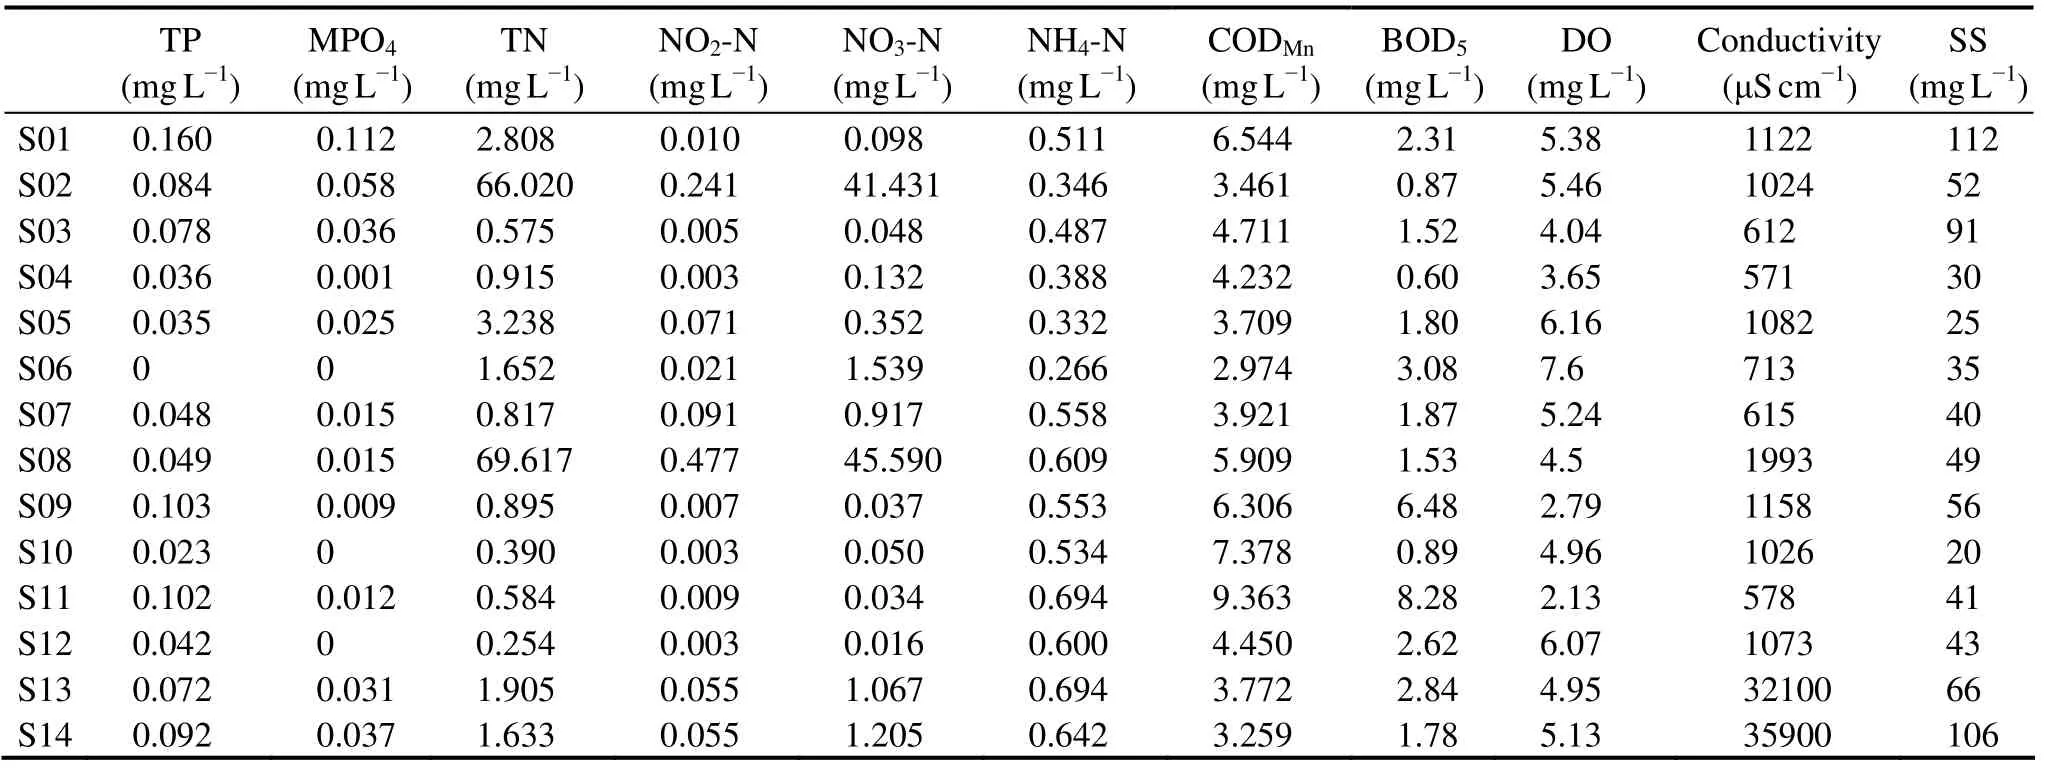
Table 2 Values of the water quality index
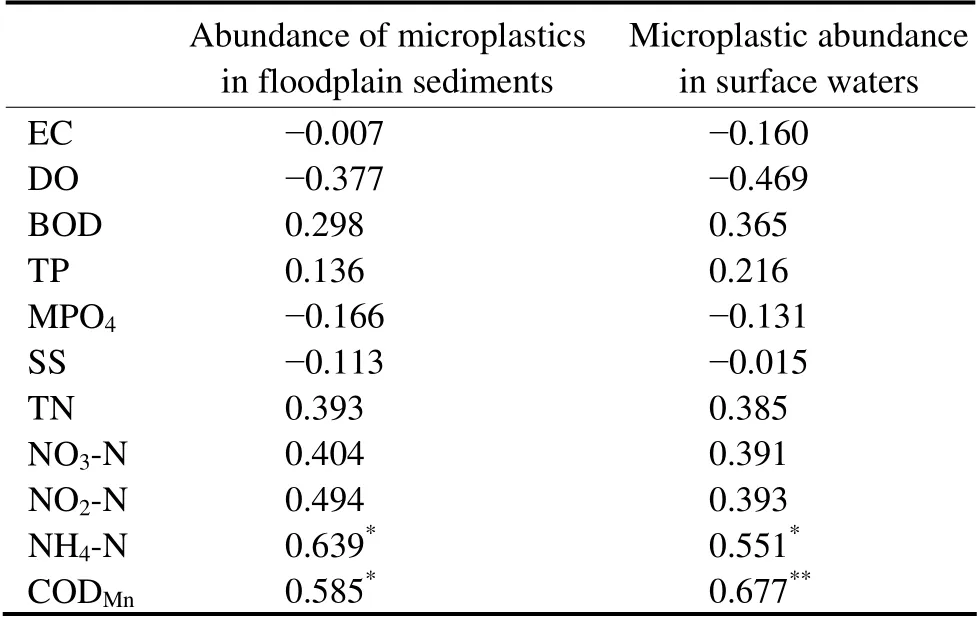
Table 3 Pearson correlation between microplastics and water quality index
The abundance of microplastics in floodplain sediments of Dagu River ranges from 115.5 items kg-1to 495 items kg-1, with an average abundance of 252.7 items kg-1(Fig.2b). The Dagu River has a lower abundance of floodplain sediment microplastics than the Yellow River((15 – 615)items kg-1)(Gonget al., 2020), but higher than the Moshui River ((0 – 170)items kg-1)(Qiet al. 2019)and Daliao River ((66.67 ± 79.93)items kg-1)(Hanet al.,2020). This demonstrates that a higher population density in the river basin increases the abundance of microplastics (Tse- ringet al., 2021). There is a moderate abundance of microplastics in floodplain sediments of the Dagu River. The correlation analysis shows that the abundance of microplastics in the floodplain sediments of the Dagu River is significantly correlated with the abundance in the surface waters (R= 0.873**,P< 0.01), indicating that the two have a great consistency, and may have the same pollution source.
The decline in microplastic abundance in S13 and S14 could be due to seawater exchange; however, the EC(electric conductivity)of S13 and S14 was significantly higher, and the decline in microplastic abundance in the floodplain sediments was significantly slower than in the surface water. This could be a result of a combination of several factors: the coagulates and sedimentation of microplastics due to a mixture of salt and fresh water (Longet al., 2015; Coleet al., 2016), and the increasing seawater exchange closer to the estuary. In S13, the influence of deposition, due to enrichment or polymerization, is greater than that of S14. In other words, the abundance of microplastics in surface water will decrease due to seawater exchange, and some microplastics will deposit on the floodplain sediments. This hypothesis needs to be tested by rigorous experiments.
3.2 Microplastic Size Characteristics
Microplastics in the surface waters could be classified into five categories: 0.06 – 0.1 mm, 0.1 – 0.5 mm, 0.5 – 1 mm, 1 – 2 mm, and > 2 mm. In this study, the most abundant group in surface waters of the Dagu River was 0.1 –0.5 mm (41%)and 0.5 – 1 mm (38%)(Fig.3a). This is consistent with the results from Wei River (< 0.5 mm,68.1%)(Dinget al., 2019), Haihe River (0.1 – 1 mm,54.1%)(Liuet al., 2020), Yulin River (0.064 – 0.25 mm, >80%)(Maoet al., 2020), Fengshan River (0.05 – 0.297 mm, > 60%)(Tienet al., 2020), and Han River (0.1 – 1 mm, > 90%)(Parket al., 2020). In a word, microplastics with a particle size of 0.1 – 1 mm accounted for the largest proportion in most rivers.
The proportion of each type of microplastic in the floodplain sediments was similar to the surface waters,with 0.1 – 0.5 mm (46%)and 0.5 – 1 mm (36%)accounting for the majority (Fig.3b). However, the proportion of microplastics (0.06 – 0.1 mm)in the floodplain was less than that in the surface waters, which may be because this size of microplastics is easily washed away by the river, while microplastics with a larger particle size (> 2 mm)deposit in the floodplain (Liuet al., 2018).
And when they reached the shore, what an unpacking5 there was! For this was a noted6 fishing ground, and here they would live, in little wooden huts, till autumn and bad weather came round again
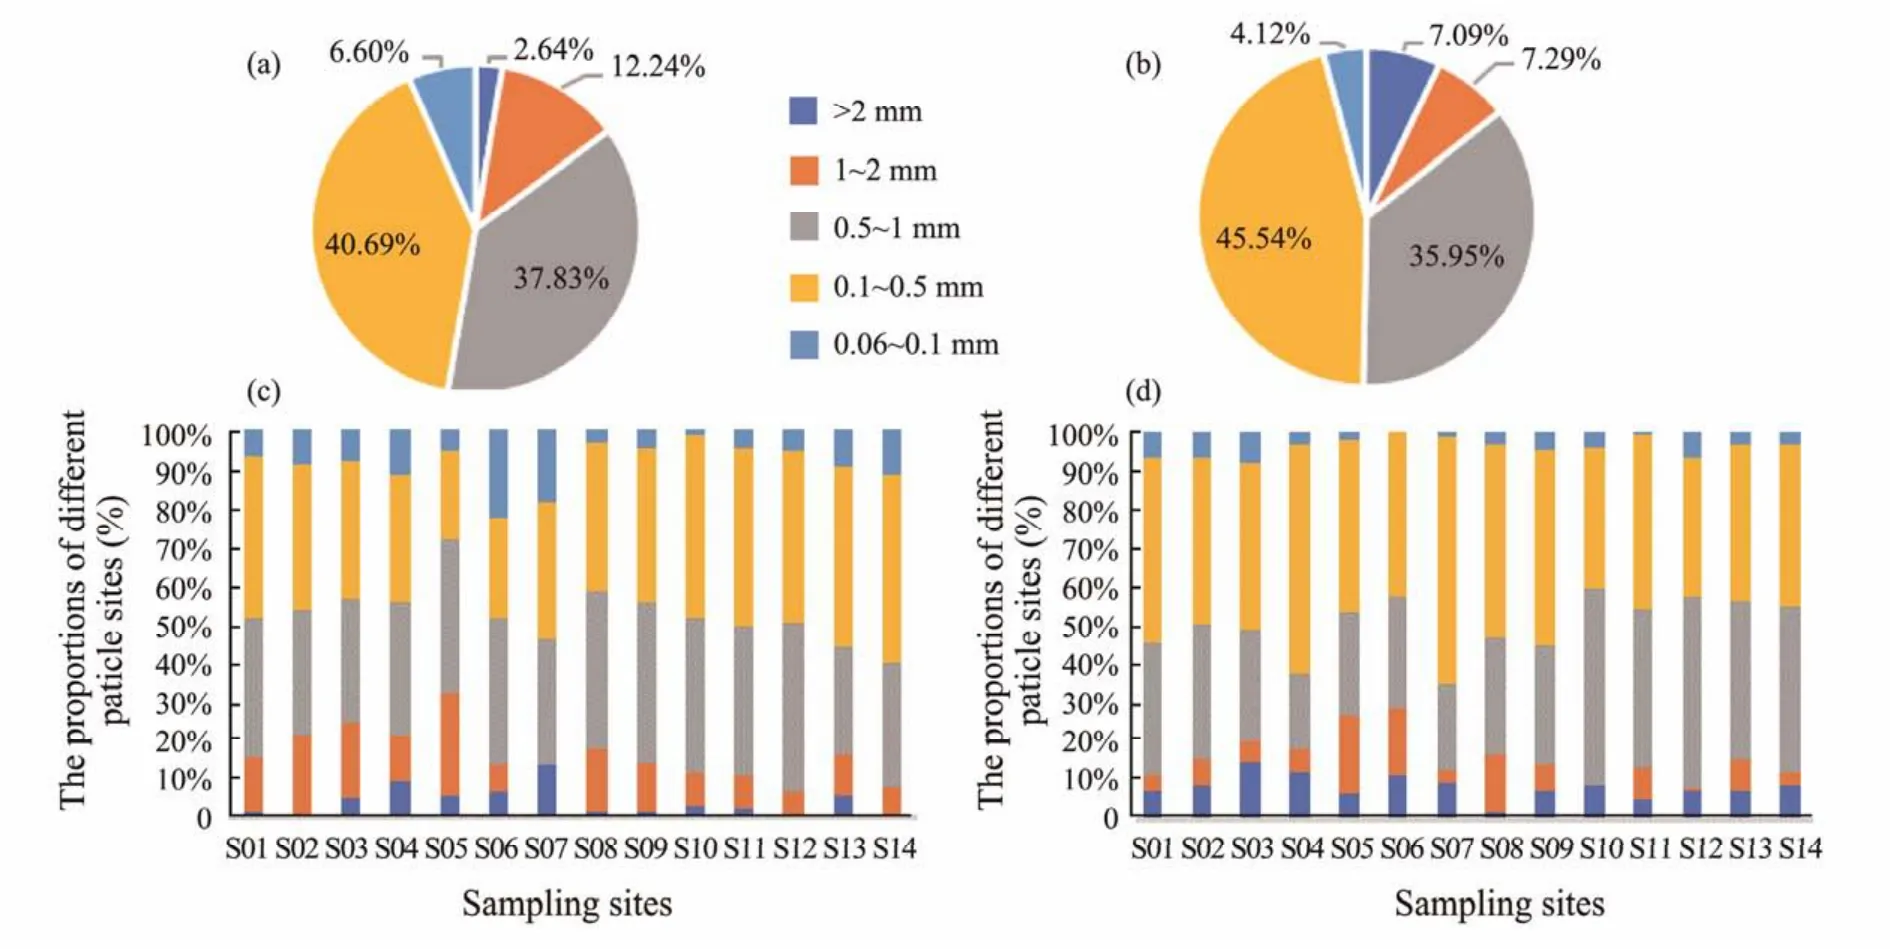
Fig.3 Particle size characteristics of microplastics in Dagu River and floodplain sediment: (a), the proportion of different particle size microplastics in surface waters; (b), the proportion of different particle size microplastics in floodplain sediments; (c), the distribution of particle sizes of microplastics in surface waters; (d), the distribution of particle sizes of microplastics in floodplain sediments.
The particle size distribution has obvious spatial characteristics (Figs.3c and d). The proportion of microplastics with a particle size of 0.06 – 0.5 mm in the surface waters in the lower reaches of the Dagu River (S08 – S14)was significantly higher than in the upper reaches (S01 –S07)(P< 0.05). Correspondingly, the proportion of microplastics with a particle size of 0.06 – 0.5 mm in the floodplain sediments of the lower reaches of Dagu River(S08 – S14)was significantly higher than in the upper reaches (P< 0.05), indicating that microplastics with a particle size of 0.06 – 0.5 mm were easily transported to the lower reaches of the river and can enter the ocean.Therefore, it can be speculated that the proportion of small microplastics in the ocean is higher than that of larger microplastics. Many references to Marine microplastics confirm this conclusion (Zhouet al., 2018; Kanhaiet al., 2020; Pattiet al., 2020).
3.3 Shape Characteristics of Microplastics
The microplastics in surface waters and floodplain sediments were divided into three types: fiber (90.76%),foam (6.09%), and fragment (3.15%)(Figs.4 and 5). The fiber was the most common shape, which is similar to those found in Haihe River (fiber, 86.7%)(Liuet al.,2020)and Pearl River (fiber, 80.9%)(Linet al., 2018).The source of fiber microplastics in rivers might be related to the surrounding textile industry, fabric washing,and fisheries (Alamet al., 2019). The present study shows similarities with previous studies, which have shown that fiber was the dominant microplastic (77.14%), in the seawater of Jiaozhou Bay, where the Dagu River flows(Zhenget al., 2019). It has been suggested that rivers as transportation vector of microplastics into the ocean is an important source of marine microplastic pollution (Zhenget al., 2019).
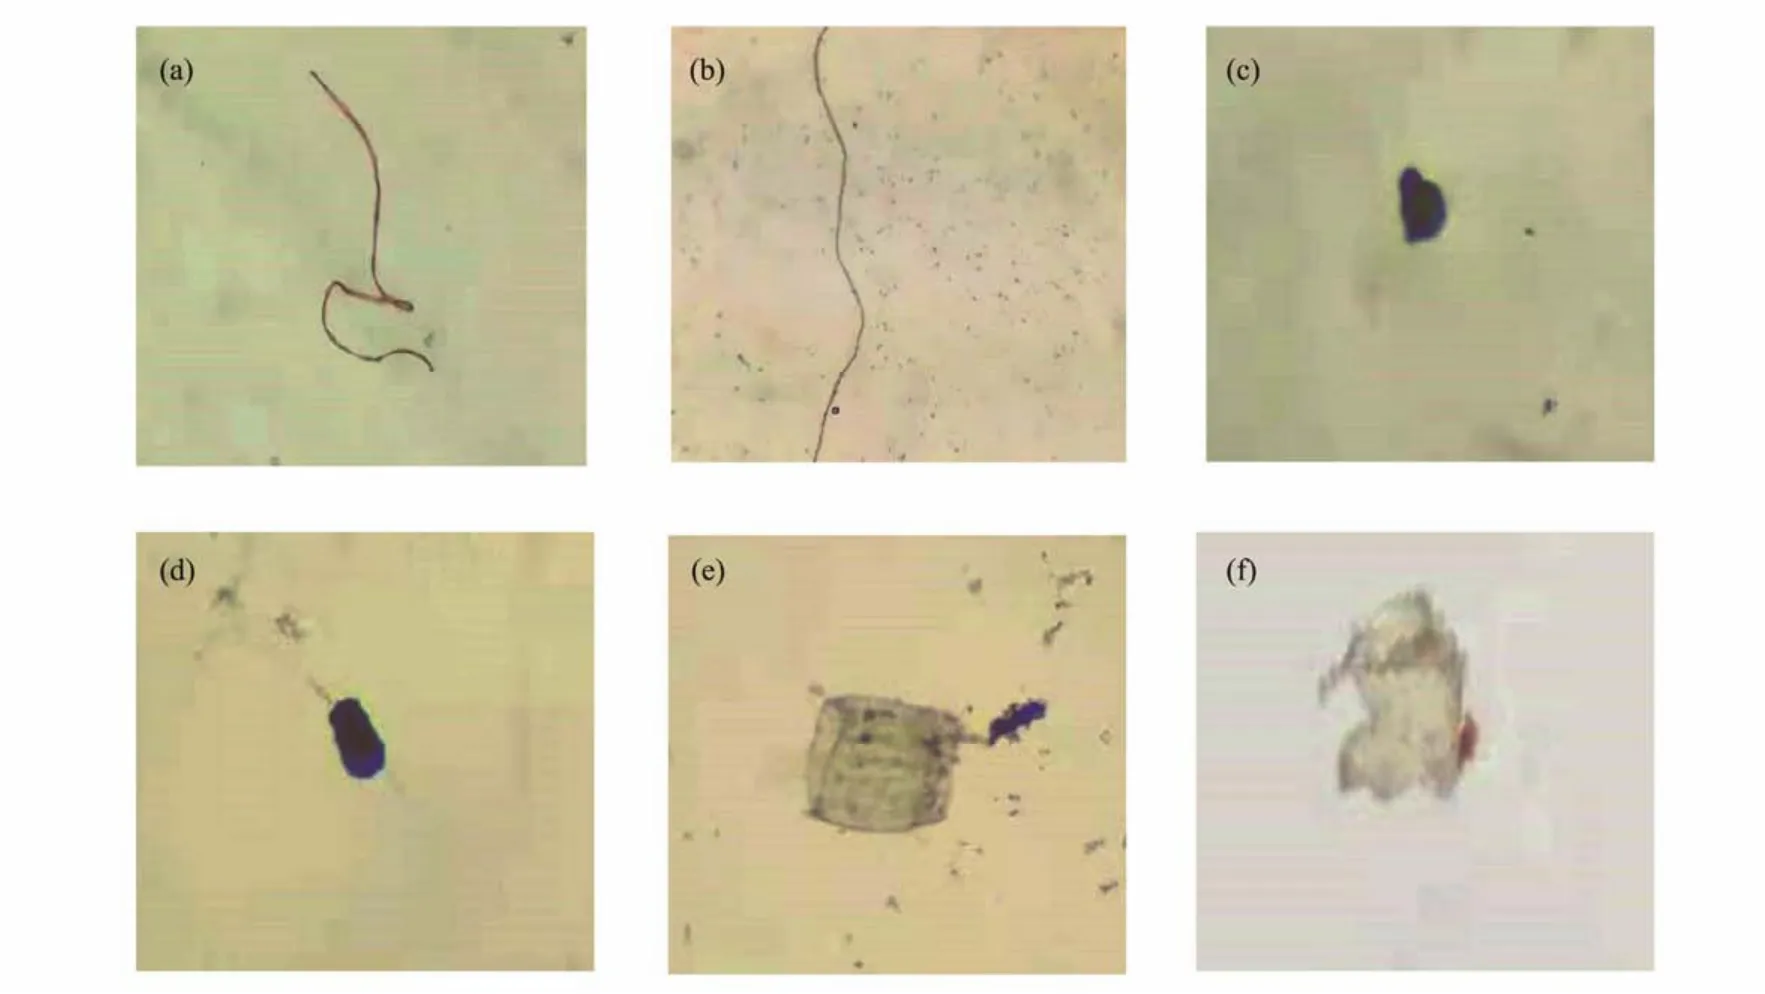
Fig.4 Images of different microplastics were obtained directly by microscope. (a, b), fiber; (c, d), foam; (e, f), fragment.

Fig.5 Shape characteristics of microplastics in Dagu River and floodplain sediment: (a), the proportion of different shapes of microplastics in surface waters; (b), the proportion of different shapes of microplastics in floodplain sediments.
3.4 Colors of Microplastics
The colors of microplastics in the Dagu River surface waters and floodplain sediments can be observed through the microscope. These included colorless (87.17%), red(6.74%), black (3.15%), and blue (2.93%)microplastics(Figs.6a and b). There are several reasons for this result.First, there are many farmlands in villages near the Dagu River and industries such as vegetable greenhouses and fruit trees, which use a large amount of colorless transparent plastic: the big plastics produced by these industries are broken down into microplastics and enter the rivers (Blcasing and Amelung, 2018). Second, colored microplastics will fade under the actions of sunlight, heat,and hydrodynamics or weathering, forming colorless microplastics (Zhouet al., 2020). In addition, fish in rivers and other aquatic organisms prefer to ingest colored microplastics (Zhaoet al., 2015a), which is also a potential factor for the high proportion of colorless microplastics.Different rivers show different color proportions due to microplastic sources and environmental influences. However, in a comparison of multiple rivers, light-colored microplastics accounted for the highest proportion in most studies such as Pearl River (white, 65.6%)(Linet al.,2018)and Tuojiang River (white, 23.30% – 54.29%)(Zhouet al., 2020). Therefore, it is speculated that microplastic color will become shallower after long-term exposure to the environment.

Fig.6 Color characteristics of microplastics in Dagu River and floodplain sediment: (a), the proportion of different colors of microplastics in surface waters; (b), the proportion of different colors of microplastics in floodplain sediments.
Due to experimental limitations, it was difficult to distinguish colorless and white microplastics using an optical microscope, so white and colorless were classified as colorless. This could be one of the reasons for the differences between the results of this study and other studies.The effects of climate and hydrology on the color of microplastic require further study and discussion.
3.5 Chemical Composition and Source Analysis of Microplastics
Identifying microplastics solely by particle size, color,and shape may lead to other tiny particles, such as algae or salts, being mistaken for microplastics (Alamet al.,2019). In this study, 200 microparticles were randomly selected for the infrared microspectrometer detection, and the scanning spectra were compared with the standard spectra to determine the polymer types (Fig.7). In the surface water samples, 83% were identified as microplastics, and in the floodplain sediment samples, 85% were identified as microplastics. The polymer types of microplastics in the surface waters are mainly PP (23%), PE(17%), and PVC (18%). In the floodplain sediments, PP(32%), PE (22%), and PVC (15%)dominated (Fig.8).The polymer types of microplastics in surface waters were significantly correlated with that in floodplain sediments (R= 0.942**,P< 0.01), indicating that the two may have the same pollution source.
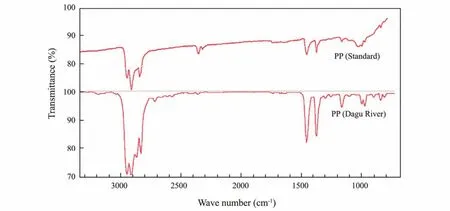
Fig.7 The infrared spectra of microplastics from Dagu River, compared with standard plastics using polypropylene (PP)as an example.
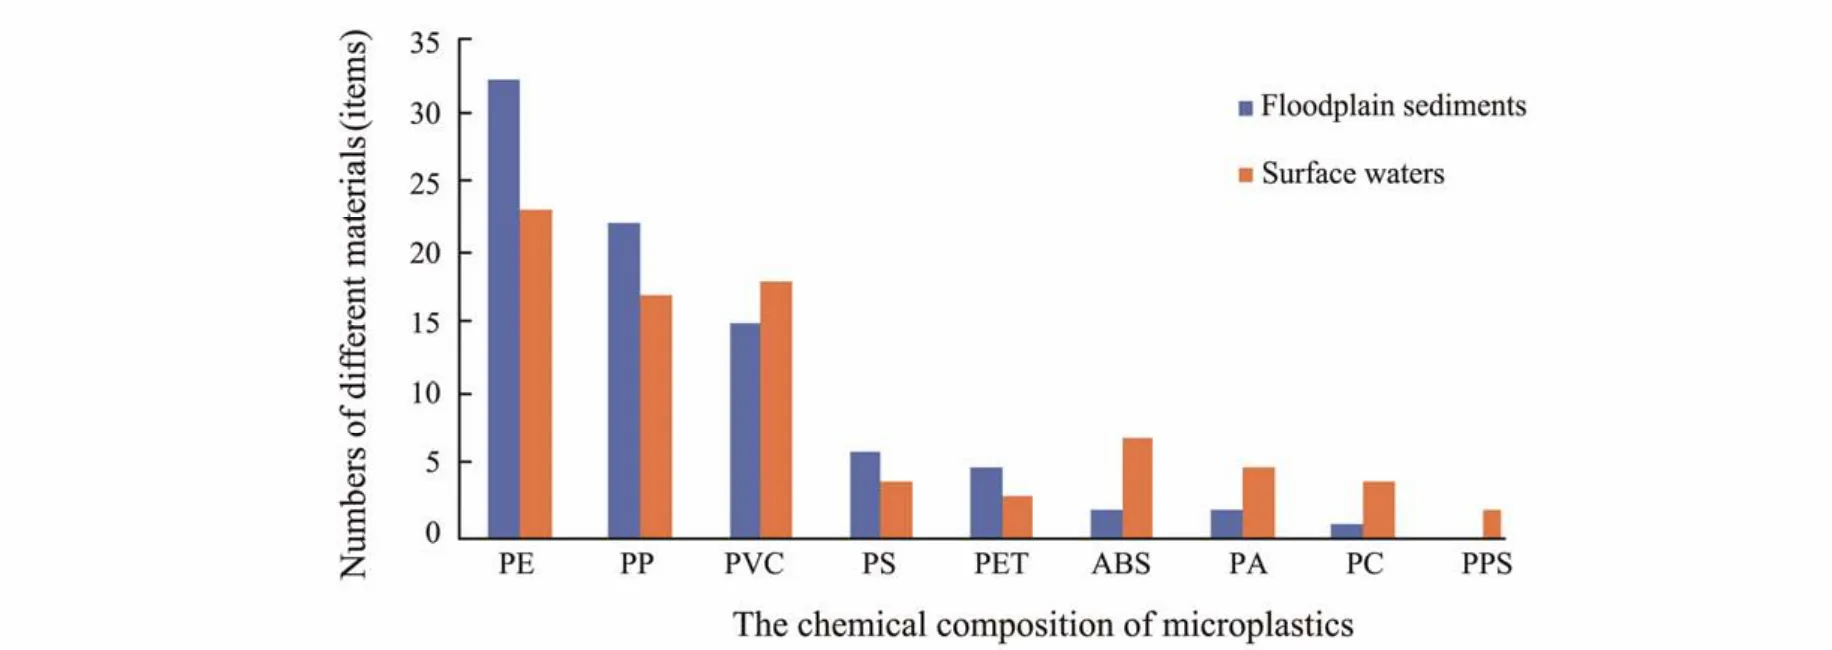
Fig.8 Polymer type of microplastics in surface waters and floodplain sediments of Dagu River. PE, polyethylene; PP, polypropylene; PVC, polyvinyl chloride; PS, polystyrene; PET, polyethylene terephthalate; ABS, acrylonitrile-butadiene-styrene copolymer; PA, polyamide; PC, polycarbonate; and PPS, polyether plastics.
PP and PE were the major polymer types of microplastic particles in surface waters and floodplain sediments of the Dagu River. The main land-use type in Dagu River Basin is cultivated land (89%)(Wanget al., 2014). A previous study showed that the main polymer types of microplastics were PP and PE in the suburbs of Shanghai(Liuet al., 2018). It indicates that agricultural non-point source pollution may bring a large number of PP and PE microplastics. PP and PE are common lightweight plastics and are easily processed as colored materials due to their relatively low density, which is likely caused by the widespread use of packing material and plastic bottles. And they are most likely to be found in surface waters and floodplain sediments (Engler, 2012; Zhouet al., 2020).PS, PVC, and PPS are mainly used in industrial production and building materials. There are frequent human activities around the Dagu River, and building activities such as house repair and renovation may be the main sources of these microplastics. Lack of effective waste management and the discarding of household garbage such as clothing, plastic cups, and plastic bags might cause a large number of colored microplastic pollution,and the PET, PA, ABS, and PC detected in this study may come from these sources.
4 Conclusions
1)The present study found that microplastics are widely distributed in the surface waters and floodplain sediments of the Dagu River. Compared with investigations of microplastics from rivers in China and other countries, these results show that there is moderate microplastic pollution in the Dagu River. Both in surface waters and floodplain sediments of the Dagu River, the main particle size of microplastics was 0.1 – 1 mm, with colorless microplastics accounting for about 85%. Fiber microplastics account for approximately 90% of the total count, and the main chemical composition of microplastics is PP, PE, and PVC.
2)According to the particle size, color, shape, and polymer types, the main sources of microplastics in Dagu River might be related to the emissions from the planting industry, textile industry, and household garbage. These results support the argument that human activities are the most important cause of microplastic pollution.
3)This study shows that microplastics exist in large quantities in freshwater systems such as rivers and reservoirs, which is of significant concern. In the future, tracing the sources of microplastic solution in the Dagu River basin and the migration, transformation, ecological effects, pollution source identification, and other issues need to be further studied. Societal concern should strengthen the management of plastic waste and reduce the sources and transport of land-based microplastic pollution to the ocean.
Acknowledgements
The study was financially supported by the National Major Special Project for Water Pollution Treatment and Control ‘Technology Integration of Watershed Ecological Function Zoning Management’ Project (No. 2017ZX073 01-001)and the National Key Research and Development Program of China (No. 2018YFC1407601).
杂志排行
Journal of Ocean University of China的其它文章
- A Theoretical Model for the Microwave Emissivity of Rough Sea Surfaces
- Mechanism of Regional Subseasonal Precipitation in the Strongest and Weakest East Asian Summer Monsoon Subseasonal Variation Years
- Analytical and Experimental Studies on Wave Scattering by a Horizontal Perforated Plate at the Still Water Level
- Theoretical Prediction of the Bending Stiffness of Reinforced Thermoplastic Pipes Using a Homogenization Method
- Penetration Resistance of Composite Bucket Foundation with Eccentric Load for Offshore Wind Turbines
- Application of Converted Displacement for Modal Parameter Identification of Offshore Wind Turbines with High-Pile Foundation
