DARTS—Drone and Artif icial Intelligence Reconsolidated Technological Solution for Increasing the Oil and Gas Pipeline Resilience
2022-12-14PremkumarRavishankarSeokyonHwangJingZhangIbrahimKhalilullahBernaErenTokgoz
Premkumar Ravishankar · Seokyon Hwang ·Jing Zhang · Ibrahim X. Khalilullah ·Berna Eren-Tokgoz
Abstract The need for safe operation and eff ective maintenance of pipelines grows as oil and gas demand rises.Thereby, it is increasingly imperative to monitor and inspect the pipeline system, detect causes contributing to developing pipeline damage, and perform preventive maintenance in a timely manner. Currently, pipeline inspection is performed at pre-determined intervals of several months, which is not suffi ciently robust in terms of timeliness. This research proposes a drone and artif icial intelligence reconsolidated technological solution (DARTS) by integrating drone technology and deep learning technique. This solution is aimed to detect the targeted potential root problems–pipes out of alignment and deterioration of pipe support system–that can cause critical pipeline failures and predict the progress of the detected problems by collecting and analyzing image data periodically. The test results show that DARTS can be eff ectively used to support decision making for preventive pipeline maintenance to increase pipeline system safety and resilience.
Keywords Artif icial intelligence · Asset management ·Drone application · Midstream industry · Pipeline resilience · Predictive maintenance
1 Introduction
Pipelines are the primary assets of the oil and gas midstream industry. There are currently 2.8 million miles of regulated pipelines in the United States alone (PHMSA 2021a). The oil and gas pipelines, which typically serve a greater transportation demand than trucks and trains can handle, are responsible for moving about 64% of the U.S. energy commodities across the nation (PHMSA 2021a). In the present era, the role of pipelines is crucial as the consumption of natural gas rises every year. Natural gas consumption in 2020 increased by approximately 21% to 30.4 trillion cubic feet,compared with 24.08 trillion cubic feet in 2010 (EIA 2021).Despite their indispensable role, pipelines are vulnerable to various types of risk. According to PHMSA, about 12,505 pipeline incidents occurred in the United States between 2001 and 2020, resulting in 270 fatalities, 1176 injuries,and USD 9.9 billion in property damages (PHMSA 2021b).Apart from the property damages and environmental loss,Jackson et al. ( 2014) stated that more than USD 3.1 billion worth of natural gas was lost and unaccounted for annually between 2005 and 2010 in the United States.
Pipelines can fail due to various causes, such as corrosion(internal and external), pipeline misalignment, deterioration of support structures, overgrown vegetation, equipment failure, improper operation, and other external forces (Fazzini et al. 2009; PHMSA 2021c). Meanwhile, a large portion of failures can be prevented by increasing pipeline system resilience through timely problem detection and preventive maintenance. To this end, this study proposes DARTS(drone and artif icial intelligence reconsolidated technological solution) to monitor and inspect pipeline conditions and support preventive maintenance of pipelines. This solution is particularly aimed at identifying the targeted root causes of pipeline failure–misalignment and deterioration of supporting structures–and assessing the pipeline system resilience by processing image data. The research objectives of this study are: (1) to examine the current practices for pipeline inspection; (2) to create a model for integrating artif icial intelligence and drone technologies for image data collection; (3) to develop deep learning algorithms for detecting the targeted problems from collected image data;and (4) to develop a resilience assessment model. The results of our research indicate that the proposed methodology helps evaluate pipeline conditions and in assessing strategies for preventive maintenance.
This article is organized as follows. Section 2 summarizes the literature related to the pipeline system and inspection practices, drone-based image data collection systems, and the resilience of pipelines. Section 3 discusses the research methodology, including a testbed for experiments and drone technology used for data collection. The proposed pipeline inspection method for detecting the root causes of pipeline failures is outlined in Sect. 4. Section 5 describes the resilience model. Section 6 presents the test results of the proposed method, followed by the discussions and conclusion of the present study in Sects. 7 and 8.
2 Literature Review
This section summarizes the literature review in three subject areas: the pipeline systems and their inspection practices, the drone-based image data collection system, and the resilience of pipelines.
2.1 Pipelines and Inspection
A pipeline is comprised of various parts, including pipes,pipe connectors, and pipe support systems. All connected pipes must stay in their design positions, supported by pipe support systems. The alignment is the centerline of the actual pipeline on a scale in any direction, and deviation from the centerline can lead to misalignment in pipelines. The ASME B31.3 Standard (ASME 2020) provides the allowable tolerance for angular misalignment, lateral misalignment, and combined angular-lateral misalignments, which must be identif ied early. In a pipe rack, pipes are aligned parallel to each other, and the piping engineers must ensure a minimum gap between the pipes to provide the sideway thermal movement of pipes. Jia and Feng ( 2011) stated that the minimum safe distance between two pipelines is critical for protecting the pipelines.
Proper design and maintenance of these supports per the codes and guidelines are required to produce an acceptable life cycle for the piping systems (ASME 2020). Nayyar( 1999) described three types of loads acting on the pipe and support systems:
(1) Sustained loads are likely to exist throughout regular plant operation, including gravitational forces acting on the pipe, pressure, f luid weight, and so on;
(2) Expansion loads are due to displacement of piping from its designed positions, caused by seismic movements,thermal expansion, contraction, and so on; and
(3) Occasional loads are expected at irregular intervals during operation, such as from wind, earthquake, and f luid transients.
Pipe support systems can fail when these loads exceed the maximum principal stress and shear stress. Nayyar ( 1999)specif ied f ive failure modes that occur in piping systems:failure by general yielding, yielding at sub-elevated temperature, yielding at elevated temperature, brittle fracture,and fatigue loading.
A pipe support system typically consists of pipe fasteners,a supporting structure, and a foundation. Pipe fasteners are used to hold pipes in position on the supporting structure.A supporting structure is a structural system that carries pipe loads (dead and live) down to a foundation. A foundation is a structure that supports the supporting structure and transfers all loads exerted on it to the ground. Pipe support systems are constructed with protective measures to resist severe blows, absorb shocks, and stand extreme events with tolerable loss levels (Peng and Peng 2009). Structures of a pipe support system should also be thoroughly planned to discard water; otherwise, stainless steel can act as a cathode that can accelerate the corrosion process of support structures (Paczkowski and Skibicki 2019). Mohan and Poobal( 2018) pointed out that cracks on the concrete surfaces are the signs of degradation of the structure, which can lead to servere damage to the entire pipe support system.
Fatigue damage can alter the shapes and structural integrity of pipes and components of a pipe supporting system.For instance, when a spring-type fastener fails due to accumulated fatigue, the resulting impact can ultimately cause damage to pipes (Huff et al. 2015). In the Denali fault zone,bumper restraint supports were applied to control lateral seismic movement, and the pipeline shoes were lengthened to dampen seismic energy (Sorensen and Meyer 2003).The collapse limit state of structural members rose from 0 to 59% when the dynamic analysis was used as an assessment approach for determining fragility curves regarding soil movements in near and far-f ield conditions (Di Sarno and Karagiannakis 2020). As per the American Society of Mechanical Engineers (ASME), the allowable stress is dependent on the specif ied minimum yield strength of the pipe material (ASME 2019). The allowable stress in ASME for gas transmission and distribution piping systems depends on specif ied minimum yield strength and temperature, reducing the permissible values when the temperature increases more than 120 °C (ASME 2021).
The abovementioned issues are commonly inspected via visual observations by the third-party inspection contractor.Inspectors usually walk in pre-established areas to detect pipeline leakages and various defects in pipelines and pipe support systems (Ramalli et al. 2016). The existing practice is inherently limited due to the potential failure to notice the damage during visual observations and heavy concentration on relatively more vulnerable areas, leaving some areas unchecked. Other signif icant drawbacks include inconsistent inspection standards, a shortage of qualif ied inspection workforce, and increasing labor costs and resulting f inancial burden.
2.2 Application of Drone Technology for Image Data Collection
Drone technology has received intensive attention in many research areas recently because of its data collection capability. Unmanned aerial vehicles can provide high-resolution photos and videos in a much more convenient and f lexible way than traditional methods. Meanwhile, the rapid development of advanced machine learning (ML) and deep learning (DL) algorithms has achieved many breakthroughs in various research areas. Artif icial intelligence (AI)-based approaches have naturally been applied to solve challenging pipeline inspection and monitoring problems. For example, Alharam et al. ( 2020) implemented a system that uses a drone equipped with a thermal camera that can monitor oil and gas pipelines to detect leakages and cracks in pipelines in remote and risky areas. Diff erent machine learning algorithms were tested and compared. Mattar and Kalai ( 2018)developed a wall-sticking aerial robot platform that can approach any place of the structure by f lying and sticking to the target place. The robot is equipped with electromagnetic hold mount elements to stick the sensor probe on the structure’s surface and performs ultrasonic thickness testing at random spots.
Deep learning models VGG-16 and mask R-CNN were employed in Ghorbani and Behzadan ( 2021) to identify and locate oil spills. The VGG16 model was used for image classif ication to predict the existence of an oil spill in an image. The mask R-CNN model and PSPNet model were used to detect oil spills and mark their boundaries at the pixel level. A dataset named Nafta containing 1,292 images taken by UAVs, satellites, or f irst-person cameras from previous oil spill accidents is used for performance evaluation.A bilateral segmentation network (Chen et al. 2022) and a fast R-CNN model (Jiao et al. 2019) were also applied for oil spill detection. Fedorova et al. ( 2020) developed a mathematical model to determine the composition of the group of drones and its basing method for the oil pipeline monitoring task. The model can also calculate the cost of surveillance for a specif ied period. It is suitable for oil pipelines, gas pipelines, and other similar objects. Sudevan et al. ( 2018)presented research focusing on vertical structure inspection in the oil and gas industry. The introduction of robotic technologies such as UAVs and wall climbing drones provides a possible solution for challenges in vertical structure inspection by increasing effi ciency, reducing risks, and lowering costs.
Lee et al. ( 2017) proposed a method to model the response to pipeline failure regions detected by f ixed sensors using UAV-enabled sensing with ground-based maintenance crews. When a failure occurs, a f ixed sensor network f irst ref ines the search area to a certain subset of the network,and then two mixed-integer programming formulations were used to optimize the UAV exploration time and maintenance vehicle travel time to minimize the time elapsed from the time of failure to the time of repair. Phung et al. ( 2019)presented a real-time control system for surface inspection using multiple UAVs. The UAV formation is established using the angle-encoded particle swarm optimization that generates an inspecting path and redistributes it to each UAV based on an Internet of Things board. An online image processing technique was developed and implemented using histograms to detect potential damage or defects.
2.3 Resilience of Pipelines
The literature reveals a variety of explanations for resilience from diff erent perspectives depending on the nature and characteristics of f ields. Concerning pipeline resilience, a large group of researchers has focused on the ability of a system to absorb and adapt to disruptive events and to recover after events (Hosseini et al. 2016). Taleb-Berrouane and Khan ( 2019) proposed a dynamic resilience model for pipe corrosion by applying Stochastic Petri-nets (SPN) linked with Monte Carlo simulation to model and measure resilience metrics. Kim et al. ( 2020) investigated the feasibility of replacing the current contact displacement gauges with an image processing technology. This study concluded that non-contact displacement measurement was possible with an error rate of 3.3%. Timashev and Bushinskaya ( 2016)took into consideration pipelines’ limit states concerning the ultimate permissible lateral displacement by a structural element due to local deformations and extended fracture caused by crack propagation. Despite these previous studies, there is still much room to explore to increase pipeline resilience.
3 Research Methodology
This section describes the drone used for image data collection and the experimental details about common defects identif ied through the literature review and implemented in the testbed, as shown in Table 1.

Table 1 Categories and types of root causes of pipeline failure targeted in this research
3.1 Testbed
The testbed was constructed to create the root causes listed in Table 1. The testbed simulates a typical raised pipeline system that consists of pipes, pipe fasteners, supporting structures, and foundations. The typical defects identif ied through the literature review were applied to the testbed. The data collected from the experimental bed concern three common types of defects–misalignment, missing components,and defective components. Table 1 lists the types of defects implemented. Figure 1 a presents the pipe support design.Figure 1 b and c show the alignment defect where the spacing between the pipes from the center should have a minimum clearance of 1 inch. Figure 1 d demonstrates that the pipe has moved to the edge of the supporting structure due to thermal expansion and is about to fall off . Figure 1 e shows displaced pipe shoe support from its designed position. Since the supporting structure can deteriorate over time, attachments can drop from the support rapidly with the corrosion catalyst, as shown in Fig. 1 f. Vibration loads from f luid transients, wind,and surroundings can loosen the bolts and nuts in the pipe foundation and pipe attachments, as shown in Fig. 1 g, h, and i. A pipe guide allows a pipe to expand and contract within the limits of the guide due to thermal, mechanical, wind,or seismic loadings without a rigid attachment to the structure. Figure 1 j, k, and l illustrate the missing and deformed guides. Early detection of these components can prevent the alignment defect and ultimately damage to the pipe.
3.2 Data Collection
We used a DJI Mavic Pro drone to collect the videos in this study. The captured drone videos have a resolution of 3840× 2160 pixels at 30 frames/s. Mavic Pro extends Mavic’s maximum range to around four miles and stays airborne for 24 consecutive minutes. The top and side videos were recorded to segment pipe and pipe support for each defect.The top view video was suffi cient to detect the alignment issues of the pipe. However, the top and side view videos were required to notice missing and deformed components.DJI Mavic Pro is equipped with a Global Positioning System (GPS) that records the GPS data and can determine the defect’s location for timely maintenance. This study used Dash-ware software to link the video and the GPS data, giving the location per frame with longitudinal and latitudinal coordinates and showing the drone height from the ground,vertical speed, and takeoff distance. The experiment was assembled at the Reese Construction Management Program Lab, Beaumont, Texas, United States. The experiment was conducted in the early morning, midday, and late evening. The drone videos were taken when the weather was clear, partially cloudy, and overcast. The experiment was conducted at an average speed of 1.5 m/s (5.1 ft/s) and an elevation of 4.5 m (15 ft) from the pipeline, complying with Federal Aviation Administration (FAA) regulations (FAA 2020).
3.3 Application of Deep Learning Neural Network
Advanced deep learning neural network is applied to detect and segment pipelines and other supporting components from drone videos. SegNet (Badrinarayanan et al. 2017), FCN(Long et al. 2015), DeconvNet (Noh et al. 2015), CRFASRNN (Hong et al. 2015), and DeepLab (Chen et al. 2018) are widely used segmentation network architectures. To achieve pixel-wise image segmentation, these network models have similar encoder-decoder designs. The encoder network takes the original image as the input and generates a feature-level representation in a latent space. In contrast, the decoder network maps the feature-level representations back to the image space with pixel-wise segmentation. The main diff erence among these segmentation networks lies in the decoder part.The DeepLabV3+ semantic segmentation model from Chen et al. ( 2018) was adopted in this study for pipeline segmentation due to its high performance on street view image segmentation and effi ciency regarding memory and computation time. DeepLabV3+ has no fully connected layers and can vastly reduce the number of trainable parameters of the entire network. This measure is eff ective in minimizing memory consumption and improving inference time without sacrif icing performance. This adopted network was pre-trained using the PASCAL VOC dataset (Everingham et al. 2010), which has 11,530 annotated images with 20 diff erent classes. Those images include airplane, bicycle, bird, boat, bottle, bus, car,cat, chair, cow, dog, horse, motorbike, person, sheep, sofa,table, potted plant, train, and TV/monitor. This dataset is a widely used benchmark for semantic segmentation. Networks pre-trained by PASCAL VOC have been successfully applied for street view image segmentation, medical image analysis,gait classif ication, and so on.

Fig. 1 The testbed: a pipeline support structure design; b misaligned pipes; c lack of minimum clearance between pipes; d pipe on the verge of falling off from the pipe rack; e displacement of pipe shoe;f missing bracing; g missing bolt; h missing nut of U-bolt; i missing nut in pipe shoe; j deformed guide; k deformed guide; and l displaced guide.
4 Proposed Pipeline Inspection Method
Computer vision algorithms are used to analyze the extracted pipeline system for damage and defect inspection. Figure 2 presents the flowchart of the proposed method. The proposed pipeline inspection procedure consists of the following four significant steps:

Fig. 2 Flowchart of the proposed drone and artif icial intelligence (AI)-based pipeline inspection system
(1) Preprocessing: The captured drone videos are first decoded into frames. Then, the drone video frames are preprocessed to remove image noise. Image f iltering techniques are applied in the preprocessing step;
(2) Segmentation: A deep learning neural network is modif ied to segment the pipeline system from drone videos.Transfer learning is used to retrain the network to create a model for the pipeline segmentation using the manually created ground-truth dataset;
(3) Postprocessing: After the pipeline segmentation, postprocessing steps are applied to remove misclassif ied objects by geometric information, such as area, shape,and aspect ratio; and
(4) Inspection: Based on the prior knowledge and the properties of the pipeline system, the detected pipelines and their supporting components are inspected to f ind defects or damages.
4.1 Preprocessing for Drone Video
The captured drone videos are saved in the MOV format,so they must be decoded into video frames before being input into the neural network for pipeline segmentation at the image level. Meanwhile, because the testbed has a complex background and many surrounding objects, a 5× 5 averaging filter is applied to smooth the image and remove the noise in the image.
4.2 Pipeline and Supporting Component Segmentation
The f iltered video frames are fed into the deep learning neural network for the pipeline and its supporting component segmentation, which is the most critical step in the presented system. In this study, the captured pipeline frames are classif ied into eight classes in order to inspect each component: (1) Pipeline; (2) Supporting structural frame; (3) U-bolt; (4) Crossbar; (5) Bolt; (6) Nut; (7) Concrete foundation; and (8) Other (all other objects except previous seven classes). Figure 3 a and b show an input image and its manual segmentation, used as the ground truth. Figure 3 c shows the segmentation result of the proposed system using Fig. 3 a as the input image. The segmentation output has a high similarity to the ground truth shown in Fig. 3 b.
The original DeepLabV3+ model is modif ied and uses the transfer learning technique to retrain the network to make it applicable for pipeline segmentation:(1) The class labels are imbalanced because the number of pixels in the pipeline and supporting structure are much more than those in other classes. This imbalance can impact the learning process and cause a bias in favor of the dominant classes. The distribution of class labels and class weight is computed and used for training to avoid the problem.
(2) The original DeepLabV3+ model has 101 convolutional, ReLu, pooling, batch normalization, and classif ication layers. A new convolution layer replaces the last convolutional layer with 4 × 4 stride and 2 × 2 cropping.
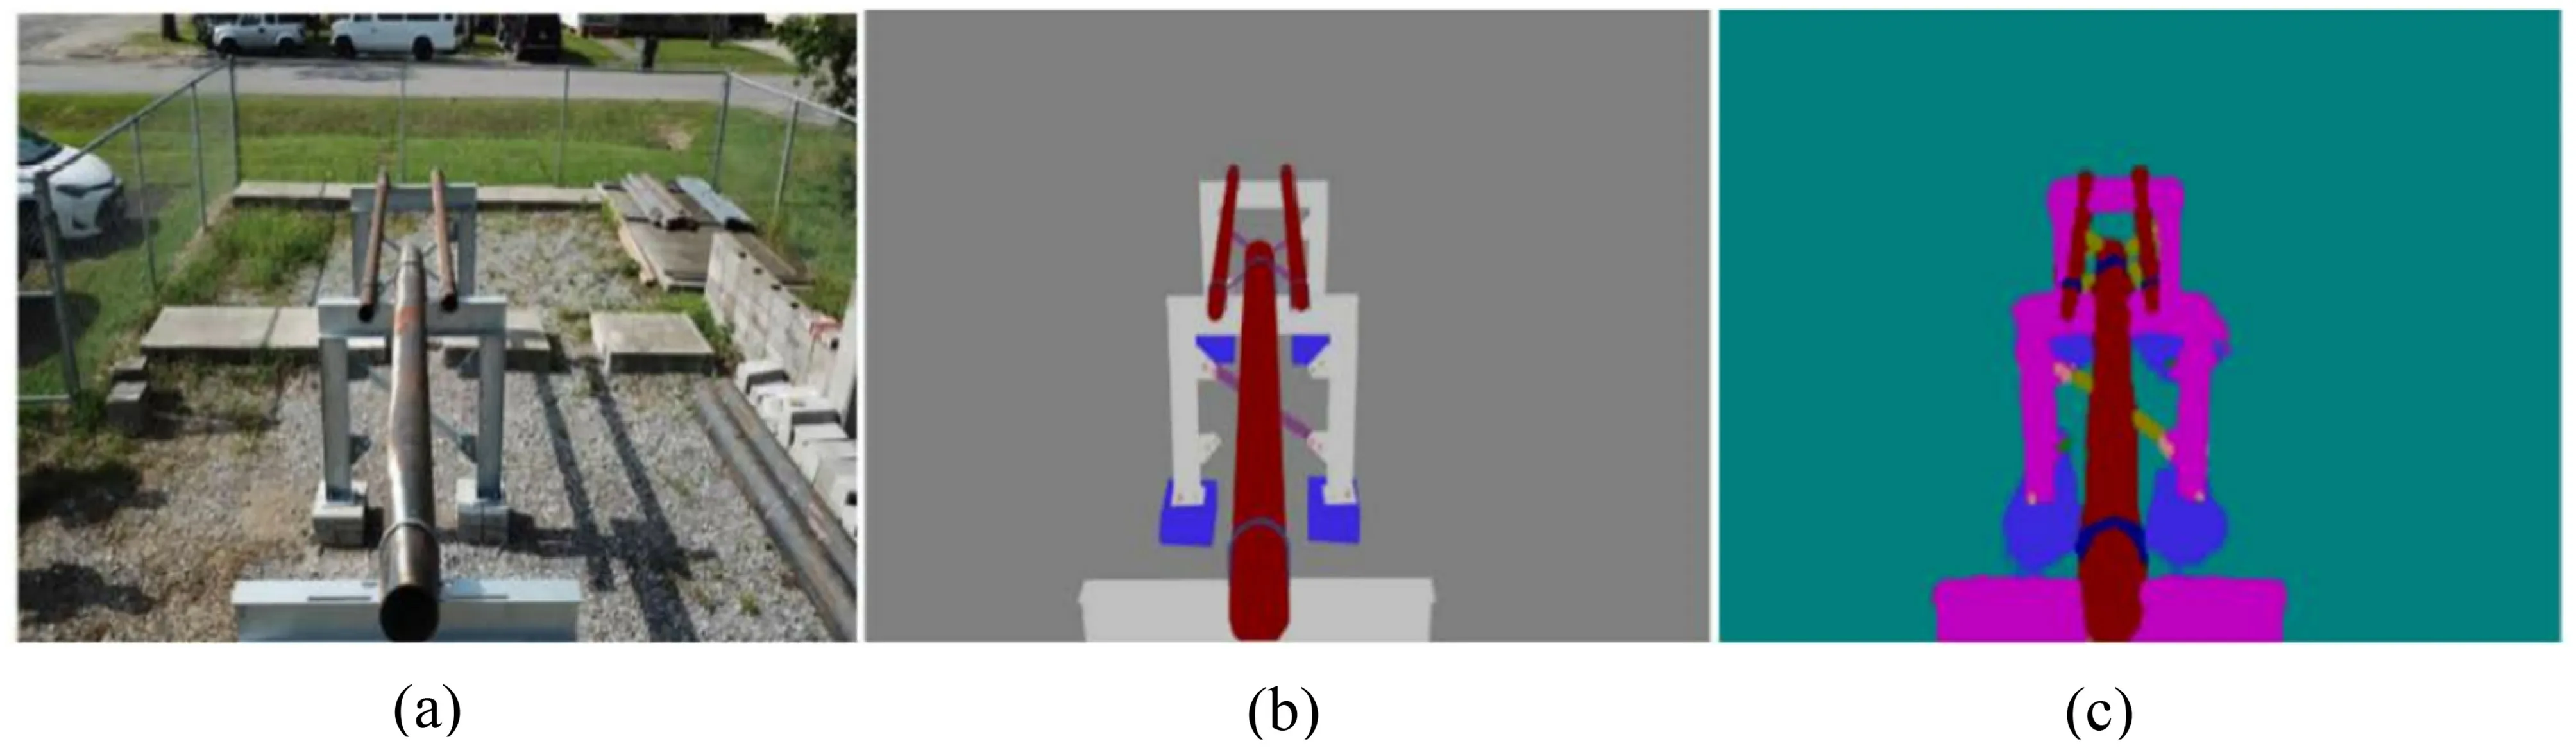
Fig. 3 Pipeline segmentation process: a input drone frame; b ground truth of a drone frame segmentation with eight classes; and c segmentation output of the proposed system.
(3) The pixel classif ication layer in the original network is replaced by a new pixel classif ication layer using computed class weights.
(4) The study annotated 51 video frames manually to create a training dataset. Data augmentation is applied to enlarge the sample numbers and add variety to the training dataset by randomly transforming the original data. The augmented training dataset has 1,581 images.Instead of training the network from scratch that needs a very large training dataset, the transfer learning technique is used for the network training, which can transfer the knowledge learned from the PASCAL VOC dataset to the collected pipeline image dataset for this project. The parameters in the modif ied network are optimized during the training phase.
4.3 Postprocessing
Postprocessing is applied after the pipeline segmentation to remove misclassif ied regions by geometric information, such as area, shape, and aspect ratio. The image morphological erosion, dilation, and open and close operations are used in the step. The isolated pixel groups are removed, and the spikes on the edges are also eliminated from the input. The postprocessed images are fed into the next step for pipeline component inspection.
4.4 Inspection
After the segmentation, the detected pipelines and supporting components need to be separated for defects and damage inspection. The three types of defects were detected as follows:
(1) Pipeline alignment issues: Each pipe is marked as a connected component to get property information.Then, the skeleton is extracted from each corresponding component by medial axis transform. The Hough transform is applied to f ind a straight-line segment to approximate the pipe. Finally, the angles of all line functions computed from pipes are analyzed to detect misalignment.
(2) Crossbar issues: Each support structure has two braces(prior knowledge) that can be used to detect missing braces. Similar steps used for misalignment analysis are applied to get the line segment approximation of each bracing. Because two braces are crossed, the corresponding two-line segments should have an intersection and a 90° angle between them. Therefore, if a support structure has only one brace or the braces are not well f ixed, then no intersection exists, or the angle is not close to 90°, which indicates a missing brace.
(3) Pipeline corrosion issues: Corrosion can cause color changes on the pipeline surface, so a color-based clustering method is used to cluster the pipeline surface into regions based on their color similarities. The regions with average colors (that is, cluster center) close to standard corrosion colors are marked as the corrosion regions. Their areas can be measured for corrosion and resilience analysis.
5 Resilience Model

Fig. 4 Resilience framework based on the DARTS application
Pipelines, including support structures, are constructed with protective measures to resist severe blows, absorb shocks, and stand extreme events with tolerable loss levels. The pipeline resilience framework was developed to address f ive critical issues–misalignment, deformation,missing parts, cracks, and broken components–that can aff ect the performance and safety of pipelines. Figure 4 illustrates the resilience framework based on the five critical performance-aff ecting issues. Since color change on the pipe can be due to dust or grease, resilience for corrosion issues is not evaluated due to the higher possibility of false detection. Any misalignment, missing, cracked,or broken components can induce imminent, large-scale damage to the pipeline. Therefore, a pipeline system having such issues is considered “non-resilient,” as shown in Fig. 4. On the contrary, the deformed components are further evaluated to determine the state of the pipeline system. Based on the detection of the alignment issue,deformed components can be categorized into two diff erent resilient states. If a deformed component is identif ied and the pipeline alignment issue is not detected, the system is in an alarming resilient state as the deformation is within the elastic region. However, if a deformed component and the alignment issue are detected together, then the system is in a non-resilient state, as deformation might be in the plastic region or near to rupture phase.
6.1 Drone System and Datasets
From a drone video, 51 frames were selected, and eight classes were labeled in each frame. Of these, 41 images were used for training and 10 images for validation. Data augmentation was applied to enlarge the training data size and add more variety to the training dataset by randomly transforming the original training samples, improving the network’s segmentation performance. The same random transformations were used for both image and pixel label data. The random functions applied are random left/right ref lection and random horizontal/vertical translation from− 10 to + 10 pixels. Each training sample image and its label are augmented to 40 images, so there are 1681 (41+ 41 × 40) images. Each validation sample image is also augmented to 20 images, resulting in 210 images.
6 Results
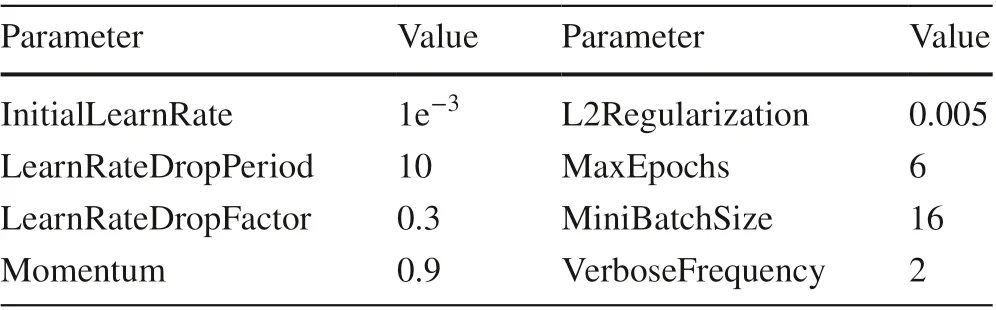
Table 2 Parameter setting for the network training
This section explains the datasets used for training and validation. The results and details of segmentation and inspection test results are shown in subsections.Table 3 Segmentation accuracies of pipeline and supporting components

Fig. 5 Pipeline and supporting component segmentation results

Class Segmentation results(intersection over union)(%)Pipeline 82.98 Supporting structural frame 80.80 U-bolt 64.18 Crossbar 75.65 Bolt 61.23 Nut 58.96 Concrete foundation 76.13 Other 97.17
6.2 Segmentation Results
The algorithm was implemented using Matlab R2020b.The computer has Ubuntu Unix operating system, 16 GB memory, and Nvidia 1080GT GPU. The training parameter settings are listed in Table 2. The training time is 125 min and 20 s. These resulted in the f inal training accuracy of 99.20, the f inal training loss of 0.08, the f inal validation accuracy of 97.58, and the f inal validation loss of 0.14.Some segmentation results are shown in Fig. 5, which overlap with the original drone video frames.
Table 3 lists the Intersection over Union (IoU) for each class to show segmentation performance. Pipeline, frame,crossbar, and foundation classes are well segmented with decent IoUs because they have big areas and are robust to small segmentation errors. But U-bolt, bolt, and nut classes are much smaller and, therefore, very sensitive to segmentation errors–a small error (for example, a few pixels) can cause a big IoU drop. In this study, we focused on the inspection of pipeline and crossbar-related issues using segmented drone frames.
6.3 Inspection Results
The proposed inspection method was evaluated using the prepared testbed. Videos were taken from the top and side views with a camera angle of approximately 60°. The resilience model was used to def ine the system state of the pipelines. The following discusses the results of the inspection experiments:
(1) Pipeline alignment issues: The misaligned pipelines in the testbed were applied, as shown in Fig. 6 a. It shows the detected pipelines highlighted in red and the line segment generated by the Hough transform of each pipeline. It can be seen that two-line segments are not parallel to each other and have an intersection, which indicates that the pipelines are misaligned and the system state is non-resilient. Therefore, pipeline alignment problems can be detected by the proposed system.
(2) Crossbar issues: There are two supporting structures in the testbed. One has two crossbars, and the other has only one. Figure 6 b shows the crossbar detection results highlighted in red color. It shows the line segments generated by the Hough transform. The f irst supporting structure has only one line segment, and the second one has two crossed line segments with a 90° angle.Therefore, the missing component of the f irst supporting structure can be detected, and the system state is def ined as non-resilient.
(3) Pipeline corrosion issues: The corrosion detection result is shown in Fig. 6 c. The detected pipelines are highlighted in red color, and the detected corrosion regions are highlighted in blue. A closeup of the detected corrosion on the pipeline surface can be seen in Fig. 6 c. The resilience is not evaluated because the color contrast can also be due to dust or grease on the pipeline.
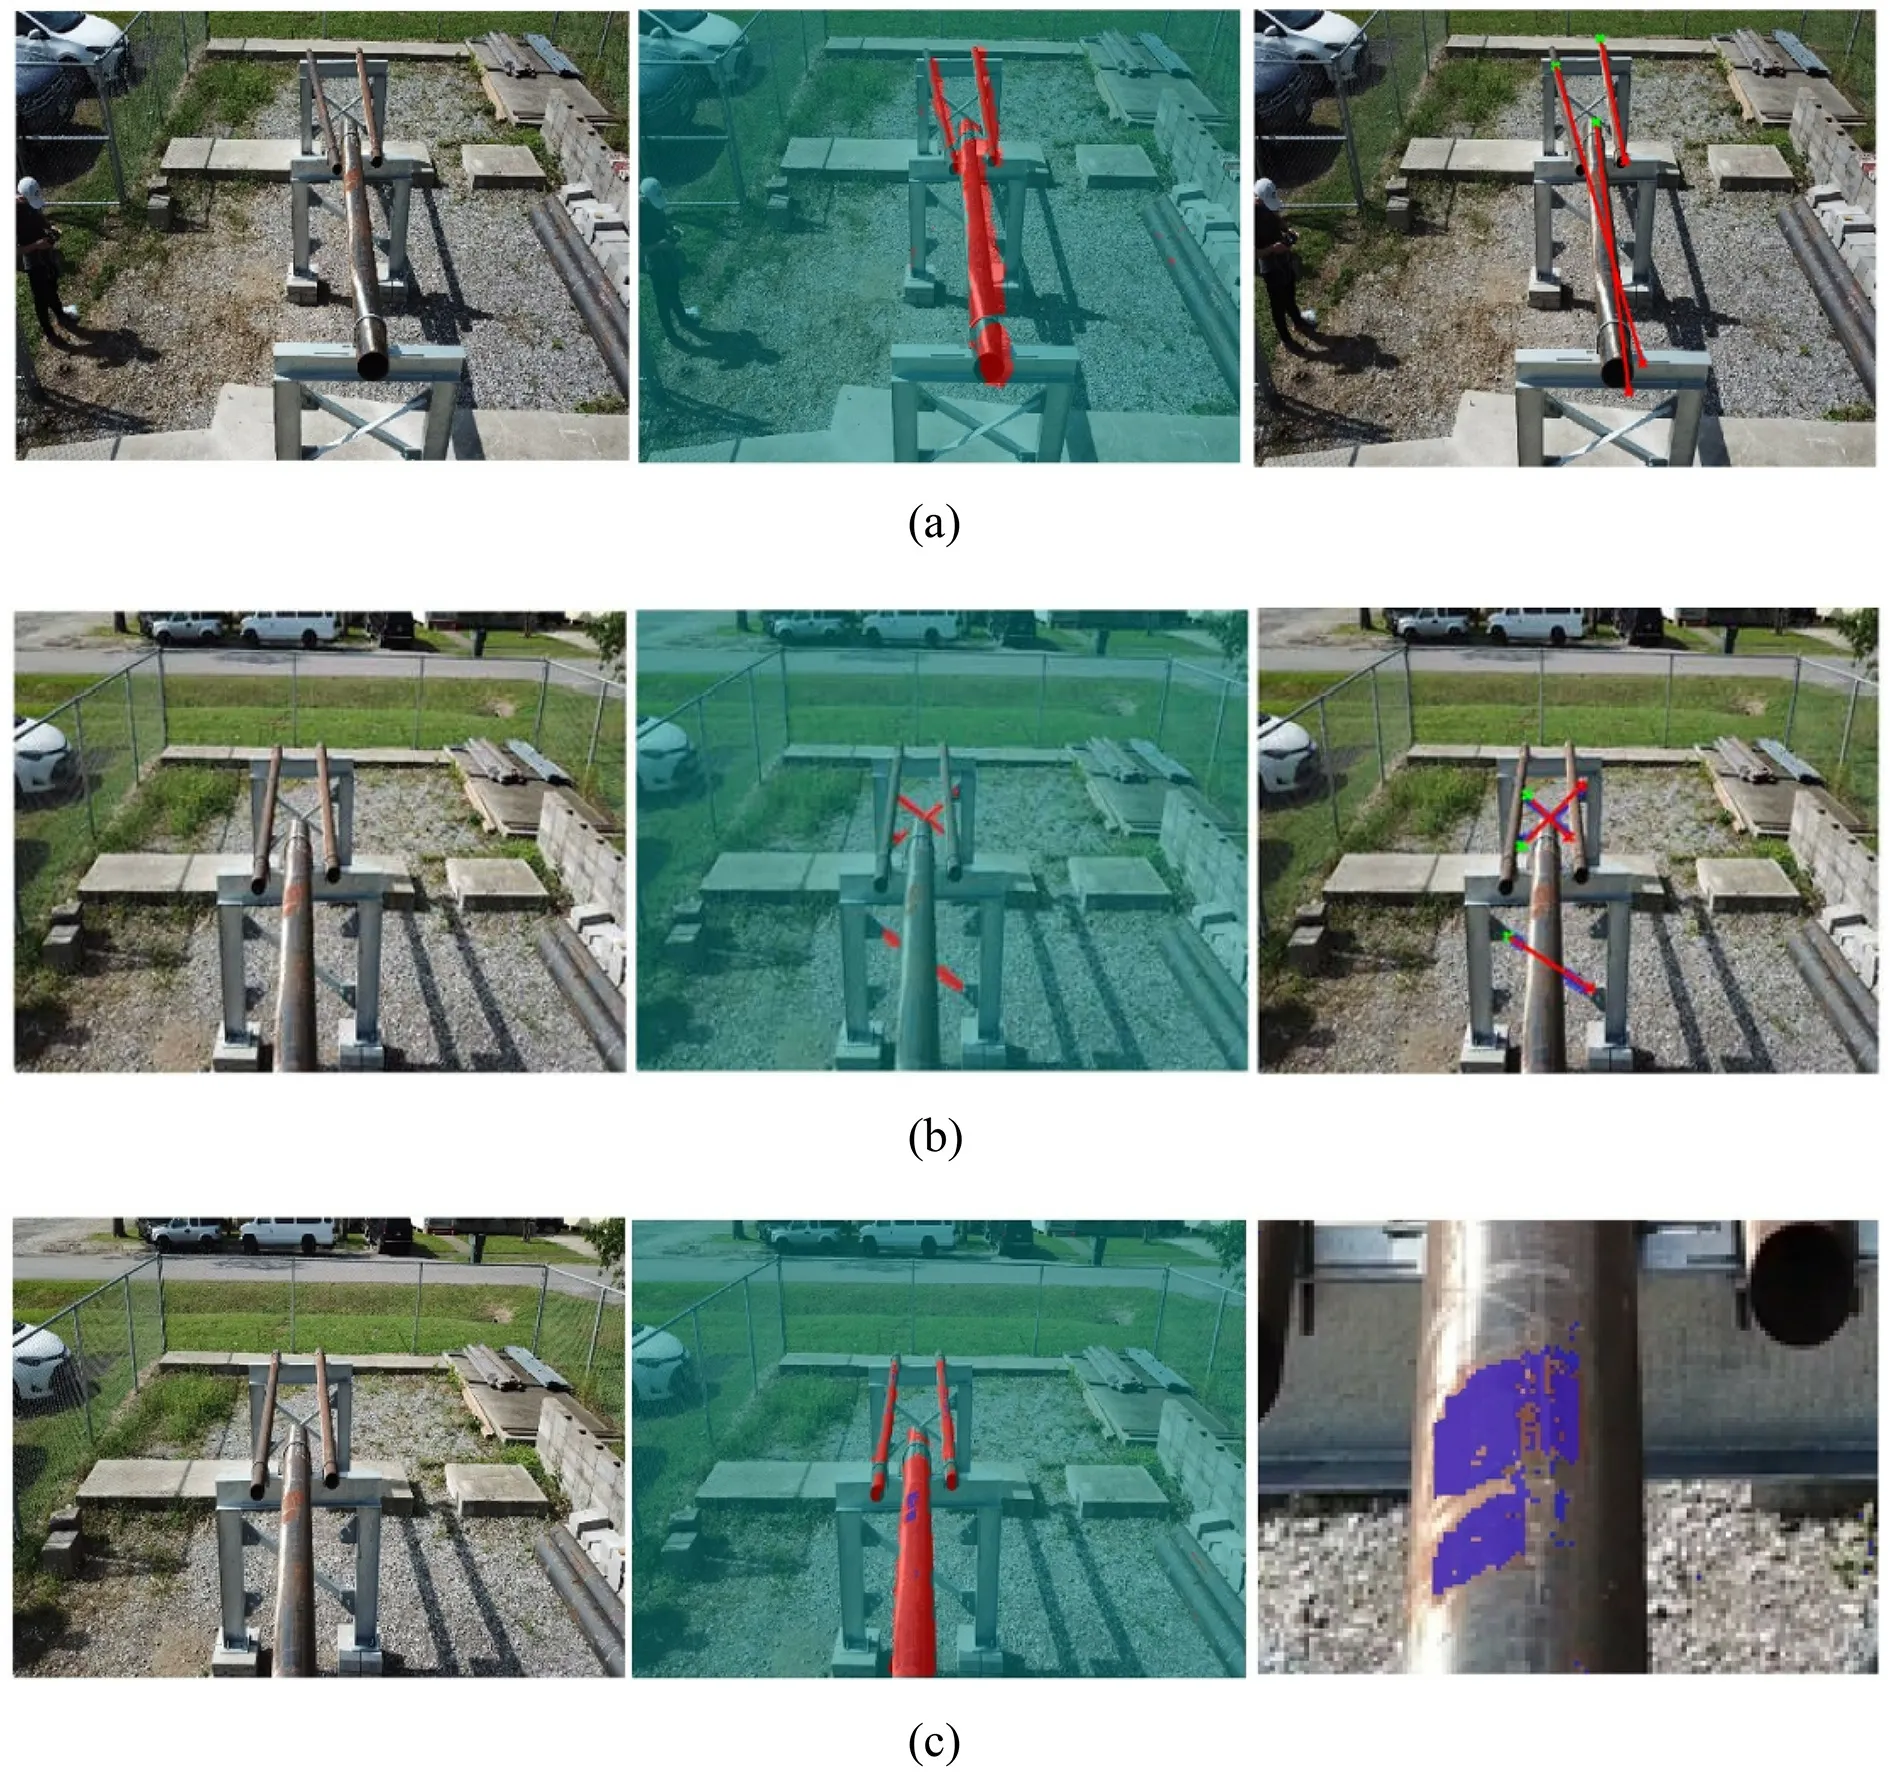
Fig. 6 Inspection results: a pipeline alignment detection; b missing crossbar detection; c pipeline corrosion detection.
7 Discussions
The limitations of human observation-based inspection of oil and gas pipelines have been well recognized in terms of time, cost, accuracy, safety, and accessibility (Ramalli et al. 2016; Alharam et al. 2020). To overcome these limitations, various research and development eff orts have been undertaken in the academia and industry. Some of these eff orts resulted in meaningful progress in advancing pipeline monitoring and inspection practices by utilizing advanced technologies such as UAVs, photogrammetry,sensors, and artif icial intelligence. This advancement has consequently contributed to improving pipeline inspection and thereby allowing more timely problem detection and preventive maintenance. Meanwhile, most of the previous studies on the application of advanced technologies for monitoring and inspection of oil and gas pipelines have heavily focused on oil and gas leakage (El-Abbasy et al. 2014; Iqbal et al. 2017; Alharam et al. 2020; Asadzadeh et al. 2022). The present study applied UAV and artif icial intelligence to f ill a research gap by focusing on the advancement of the inspection of the potential root causes–misalignment and deterioration of pipeline supporting structures–of various pipeline failures, including oil and gas leakage.
Compared with traditional inspection methods, the proposed DARTS system has signif icant advantages. Drones can effi ciently capture the images and videos of pipelines that are diffi cult to access. Computer-based automatic visual inspection can avoid human errors with low cost.Data are stored in a database for timely assessment. The scalability is robust because of non-contact detection.
The experimental results demonstrate that DARTS can achieve decent inspection performance on the constructed testbed. Furthermore, DARTS is also a generalized framework that can be applied to monitor a wide range of aboveground pipeline systems with attention to the following issues and limitations. Since there are a variety of pipeline systems with diff erent structures and pipe supports as per loads acting on the pipeline, the deep learning neural network needs to be retrained using a new training dataset collected from every new pipeline system. Some defects may not be completely detected using single-angle drone videos where drone images have blind spots from each angle. Therefore, multiple drone videos with diff erent angles are required to detect specif ic issues in the pipe support systems. Dust, dirt, or grease residue can change the color and appearance of pipeline components and thereby decrease detection accuracy. The application of the drone image-based method can be aff ected by adversarial weather conditions.
8 Conclusion
In this study, we proposed a method to integrate drone technology for automatic f ield data collection with AIbased image processing concerning the status of pipelines.The f indings of this study are expected to benef it the oil and gas midstream industry in various ways, providing the enhanced ability to monitor pipeline conditions and conduct resilience assessments. The proposed method can improve the monitoring and inspection of pipelines by saving time and workforce for collecting f ield data, improving response time for correcting or removing problems,improving pipeline monitoring access using a drone, and enhancing the assessment of pipeline resilience.
The authors plan on improving the segmentation and inspection methods, especially for small parts (that is,bolts and nuts), by optimizing network structure and parameters. Datasets collected from real pipeline systems will be used for comprehensive performance evaluation.A professional drone with an onboard computer and highresolution camera will be utilized to achieve real-time analysis.
Acknowledgement This project was partially supported by the Center for Midstream and Management Science at Lamar University,Beaumont, Texas, USA.
Open AccessThis article is licensed under a Creative Commons Attribution 4.0 International License, which permits use, sharing, adaptation, distribution and reproduction in any medium or format, as long as you give appropriate credit to the original author(s) and the source,provide a link to the Creative Commons licence, and indicate if changes were made. The images or other third party material in this article are included in the article’s Creative Commons licence, unless indicated otherwise in a credit line to the material. If material is not included in the article’s Creative Commons licence and your intended use is not permitted by statutory regulation or exceeds the permitted use, you will need to obtain permission directly from the copyright holder. To view a copy of this licence, visit http:// creat iveco mmons. org/ licen ses/ by/4. 0/.
杂志排行
International Journal of Disaster Risk Science的其它文章
- Sendai Framework’s Global Targets A and B: Opinions from the Global Platform for Disaster Risk Reduction’s Ignite Stage 2019
- Perceptions About Climate Change in the Brazilian Civil Defense Sector
- Is Being Funny a Useful Policy? How Local Governments’Humorous Crisis Response Strategies and Crisis Responsibilities Inf luence Trust, Emotions, and Behavioral Intentions
- The Eff ect of Natural Hazard Damage on Manufacturing Value Added and the Impact of Spatiotemporal Data Variations on the Results
- Understanding Farmers’ Preferences Towards Insurance Schemes that Promote Biosecurity Best Management Practices
- Institutional Capacity and the Roles of Key Actors in Fire Disaster Risk Reduction: The Case of Ibadan, Nigeria