Network Structure Optimization Method for Urban Drainage Systems Considering Pipeline Redundancies
2022-12-14JiahuiLuJiahongLiuYingdongYuChuangLiuXinSu
Jiahui Lu · Jiahong Liu,2,3 · Yingdong Yu ·Chuang Liu · Xin Su
Abstract Redundancy is an important attribute of a resilient urban drainage system. While there is a lack of knowledge on where to increase redundancy and its contribution to resilience, this study developed a framework for the optimal network structure of urban drainage systems that considers pipeline redundancies. Graph theory and adaptive genetic algorithms were used to obtain the initial layout and design of the urban drainage system. The introduction of additional water paths (in loop)/redundancies is suggested by the results of complex network analysis to increase resilience. The drainage performances of the urban drainage system with pipeline redundancies, and without redundancies, were compared. The proposed method was applied to the study area in Dongying City, Shandong Province,China. The results show that the total overf low volume of the urban drainage system with pipeline redundancies under rainfall exceeding the design standard (5 years) is reduced by 20–30%, which is substantially better than the network without pipeline redundancies.
Keywords China · Pipeline redundancies · Structure optimization method · Urban drainage systems · Urban hydrology · Urban resilience
1 Introduction
The urban drainage system is one of the important infrastructures for a modern city. How to optimize the design of urban drainage systems economically and technically is a crucial research topic. Previously, a summary of the main layout optimization processes was provided by Bakhshipour et al. ( 2019) and Duque et al. ( 2020). A variety of optimization methods have been proposed for pipe hydraulic design:simulated annealing (Yeh et al. 2013); modif ied particle swarm optimization algorithm (Navin and Mathur 2016); a Storm Water Management Model (SWMM)-based algorithm(Shao et al. 2017); and ant colony optimization (Moeini and Afshar 2017). Sustainable urban drainage systems (SUDS)are promising options that can facilitate f lood management,while enhancing the quality of stormwater runoff (La Rosa and Pappalardo 2019; Chen et al. 2021). However, SUDS also have some restrictions. For example, SUDS reduce the runoff , according to Mentens et al. ( 2006), Carter and Jackson ( 2007), and Mora-Melià et al. ( 2018). But these strategies are ineff ective during extreme rain events. Implementation of mitigation measures such as Low Impact Development (LID) in urban areas to reduce f lood volume has benef its that are more apparent when there is a shorter return period of heavy rainfall (Sun et al. 2021).
Climate change has led to an increase in the number and severity of extreme precipitation events in many parts of the world, and the resulting rainstorms and f lood disasters have had a signif icant negative impact on communities and assets (Cheng et al. 2020). As f lood volumes increase,urban drainage networks encounter more diffi culties, raising the possibility of infrastructure failure. In order to reduce the magnitude and duration of f lood hazards, the concept of resilience has been applied to numerous urban infrastructures (Hu et al. 2020; Fu et al. 2021; Sen et al.2021). The adaptability of cities could be considerably increased by building a resilient drainage system. The analysis on the resilience of a system focuses on identifying and quantifying the system’s reaction to extreme stress. Research on the resilience of urban drainage systems can help mitigate urban f lood hazards (Wang et al.2019). Redundancy is an important feature of urban water system resilience (Mugume, Diao, et al. 2015; Mugume,Gomez, et al. 2015). Redundancy implies having multiple components that provide similar functions or having alternative elements to reduce the likelihood of a system failure overall (Hesarkazzazi et al. 2020; Farahmand et al. 2021).
In urban drainage systems, resilience is def ined as the degree of stability and recoverability of the system under extreme conditions that exceed the design standard (Butler et al. 2018). Improving urban drainage system resilience through redundancy (Ke et al. 2016) can be accomplished in three ways by: (1) implementing best management practices, such as building storage facilities like reservoirs and rainwater tanks; (2) replacing critical pipes; and (3) optimizing the rainwater network topology, such as the introduction of parallel pipes or loops to increase redundancy(Mugume, Diao, et al. 2015; Mugume, Gomez, et al. 2015;Hesarkazzazi et al. 2020). Numerous investigations have been conducted on the f irst and the second methods (Tao et al. 2014; Bartos and Kerkez 2019; Jia et al. 2019; Ngamalieu-Nengoue et al. 2019; Wang et al. 2021). Therefore this study focused on the third method–the introduction of loops in the urban drainage system to increase redundancy. Using this method, it is necessary to consider where to introduce additional pipes to better improve the resilience of the urban drainage system. According to Hesarkazzazi et al. ( 2020), adding redundant pipelines downstream can make the water f low out eff ectively. However, it is yet unclear how to locate additional pipes with accuracy.
Typically, a complicated system is a research object that can be transformed into a complex network. Currently,urban water system studies and social sciences, biochemistry, transportation, and communication research, for example, all make extensive use of complex network analysis(Jenelius and Mattsson 2015; Sitzenfrei et al. 2020). Complex network analysis is a useful technique for studying complicated systems. In order to determine vulnerability, it has, for instance, been used to model f lood control infrastructure as a directed graph (Farahmand et al. 2021).Sitzenfrei ( 2021) enhanced the evaluation of water quality in extensive water distribution networks by employing a complex network analysis-based approach. Due to the spatial and temporal behavior of pipe networks based on the structure and the interaction of the edges (pipes) and nodes (manholes), the urban drainage system is typically quite complicated. The analysis of a complex network is helpful for examining structural stability, determining the crucial nodes of the pipe network, and facilitating network structure optimization.
This study developed a method for determining the specif ic location of additional pipelines for improving the redundancy of the urban drainage system. We also analyzed the contribution of the increased redundancies to the improvement of the resilience of the system.
2 Methodology and Datasets
This section introduces the methods used including layout selection, hydraulic design, and complex network analysis,and then applies them to a study area in Dongying City of Shandong Province in China.
2.1 Overview
The research framework is shown in Fig. 1. The proposed framework primarily consists of three steps: (1) determine the initial layout of the urban drainage system by applying graph theory algorithm; (2) obtain the optimal hydraulic design according to the adaptive genetic algorithm; and(3) determine the crucial nodes for increasing loop and redundancy based on the complex network analysis, and evaluate the resilience performance. The evaluation mainly focuses on the performance of urban drainage systems when subjected to functional failure. Thus, two indicators were selected: total overflow volume (TOV) and mean flood duration (MFD) (Mugume, Gomez, et al. 2015). The TOV is the volume of stormwater that f lows out of the drainage channel when the runoff discharge is more than the drainage capacity.
2.2 Methodology
The urban drainage system network is created using layout selection and hydraulic design as a foundation, and complex network analysis is used to further optimize the network structure.
2.2.1 Layout SelectionLayout selection mostly involves determining the position and quantity of manholes, choosing the pipes involved, and determining the water f low direction. In general, graph theory algorithms are used to choose layouts (Navin and Mathur 2016; Turan et al. 2019). A graph is a collection of vertices and edges. Manholes and pipelines are analogous to vertices and edges, respectively. As the foundational graph, all potential pipes are connected. The loop-by-loop cutting algorithm forms a feasible tree layout by cutting the undirected base graph step-by-step (Haghighi 2013). Figure 2 is a summary of the layout selection methodology used in this study: (1) to construct the base graphG(V, E), whereVis the collection of vertices andEis the collection of edges, and identify all the loops in the base graph; (2) to take any loop, remove an edge in the loop, and update the remaining edges (maintain connectivity during the edge removal process); (3) to check if there are still loops in the graph, and if so, go back to (2),if not, go to (4); and (4) to get all subgraphs that do not have loops (Fig. 2).
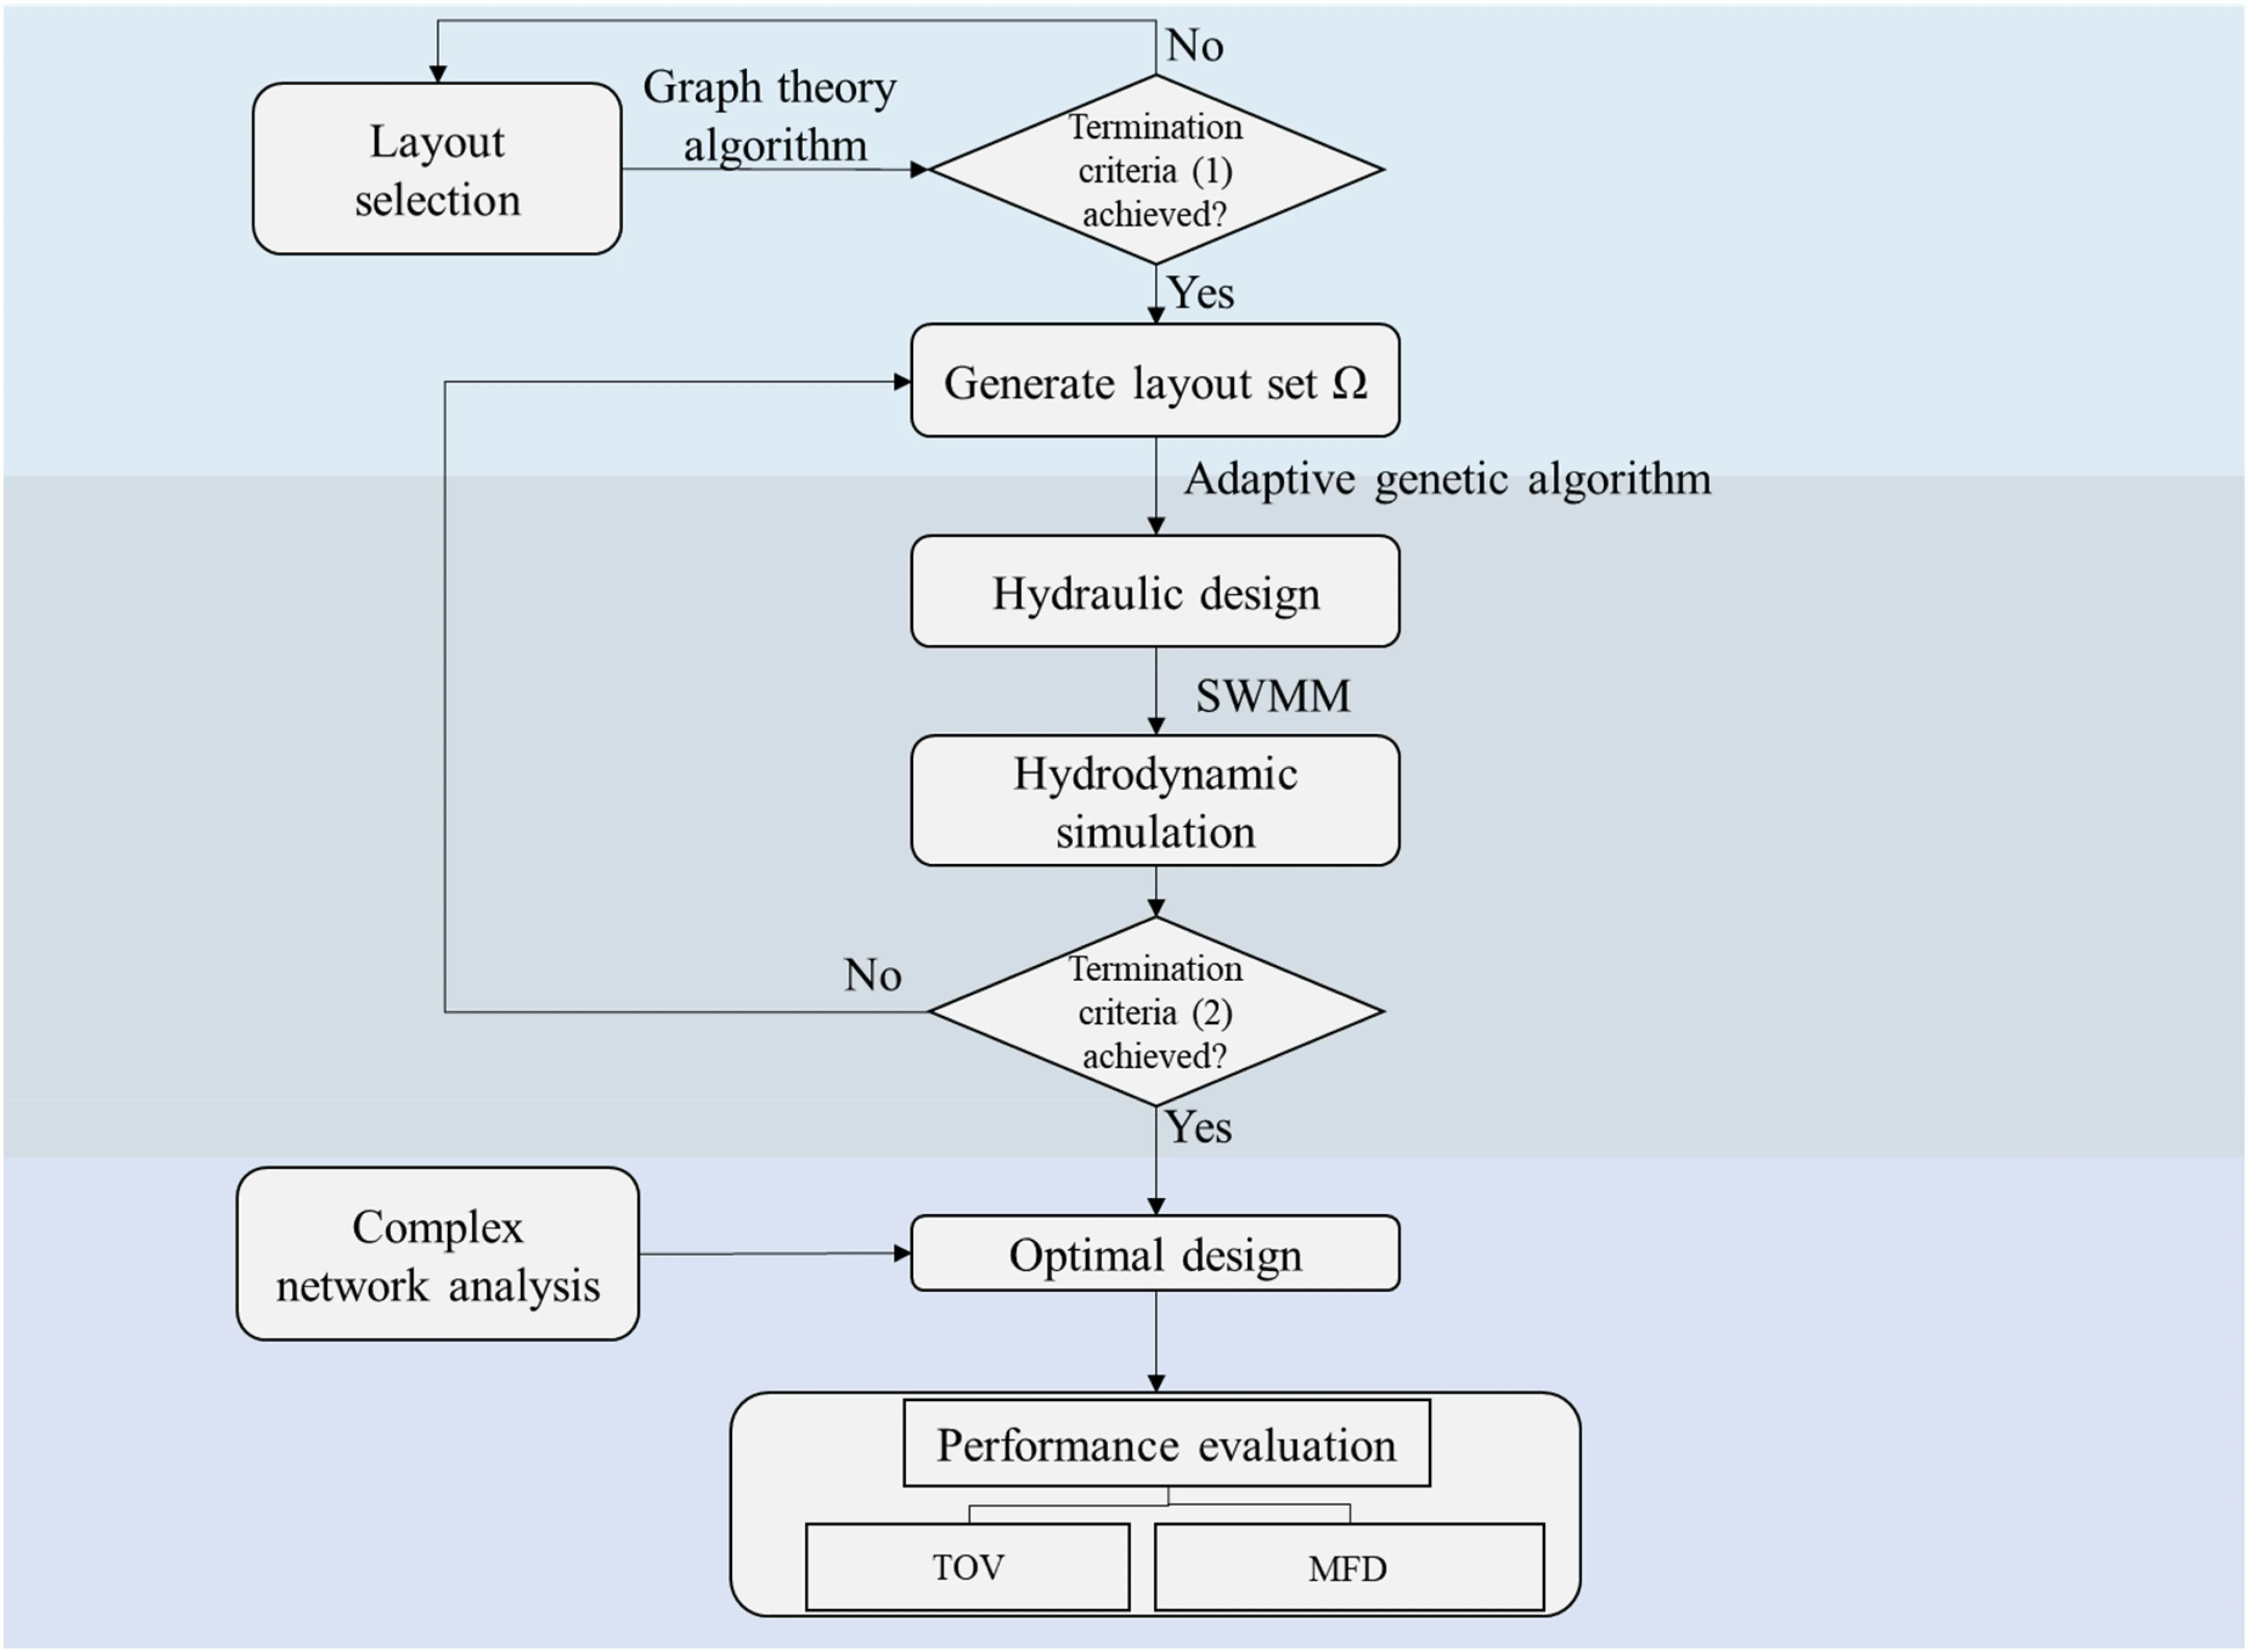
Fig. 1 Overview of the proposed research framework. Termination criteria (1): get all the subgraphs; termination criteria (2): all layouts in Ω are hydraulically designed. SWMM storm water management model; TOV total overf low volume; MFD mean f lood duration
2.2.2 Hydraulic Design
The hydraulic design is mainly used to determine the diameter and slope, with the criteria of avoiding the use of pumping stations and pressurized pipes.
(1) Objective function
The problem of optimization of an urban drainage system may be expressed as:

where F is the objective function;Nis the total number of pipes;C iis the construction cost of pipei;D iis the diameter;H iis the buried depth; andL iis the length of the pipe.
(2) Design constraints

Fig. 2 Layout selection

The hydraulic design of the urban drainage system needs to meet the corresponding pipe diameter constraints,f low velocity constraints, and buried depth constraints:nated from Darwin’s theory of biological evolution. It searches for optimal solutions by simulating the process of natural selection and biological evolution. Genetic algorithms are used for optimal hydraulic design optimization (Palumbo et al. 2013; Hassan et al. 2018).Figure 3 illustrates the steps of adaptive genetic algorithm for hydraulic optimization.
whereDminis the minimum pipe diameter;Dis the pipe diameter;Dmaxis the maximum pipe diameter;Ddownis the downstream pipe diameter;Dupis the upstream pipe diameter;D sis an optional set of pipe diameters;vis the f low velocity;vminis the minimum f low velocity;vmaxis the maximum f low velocity;dhminis the minimum buried depth;His the buried depth; anddhmaxis the maximum buried depth.
(3) Adaptive genetic algorithm for optimization
Genetic algorithm was originally proposed by Holland( 1975), and it is often used to solve combinatorial optimization problems with particularly large solution space after development. Genetic algorithm origi-
• Integer coding. Integer encoding can improve computational effi ciency.
• Generate initial population. The initial population is the initial solution generated according to the coding rules. The individuals in the initial population are the parameters of the pipes.
• Decoding. The related parameters are decoded for the hydraulic calculation of the pipes.
• Fitness evaluation. The selection of the f tiness function directly aff ects the convergence speed of the genetic algorithm and whether the optimal solution can be found. Every time f tiness is calculated, it will be sorted from largest to smallest. In this study, the reciprocal of the cost of the network is selected as the objective function. The f tiness function is expressed as:

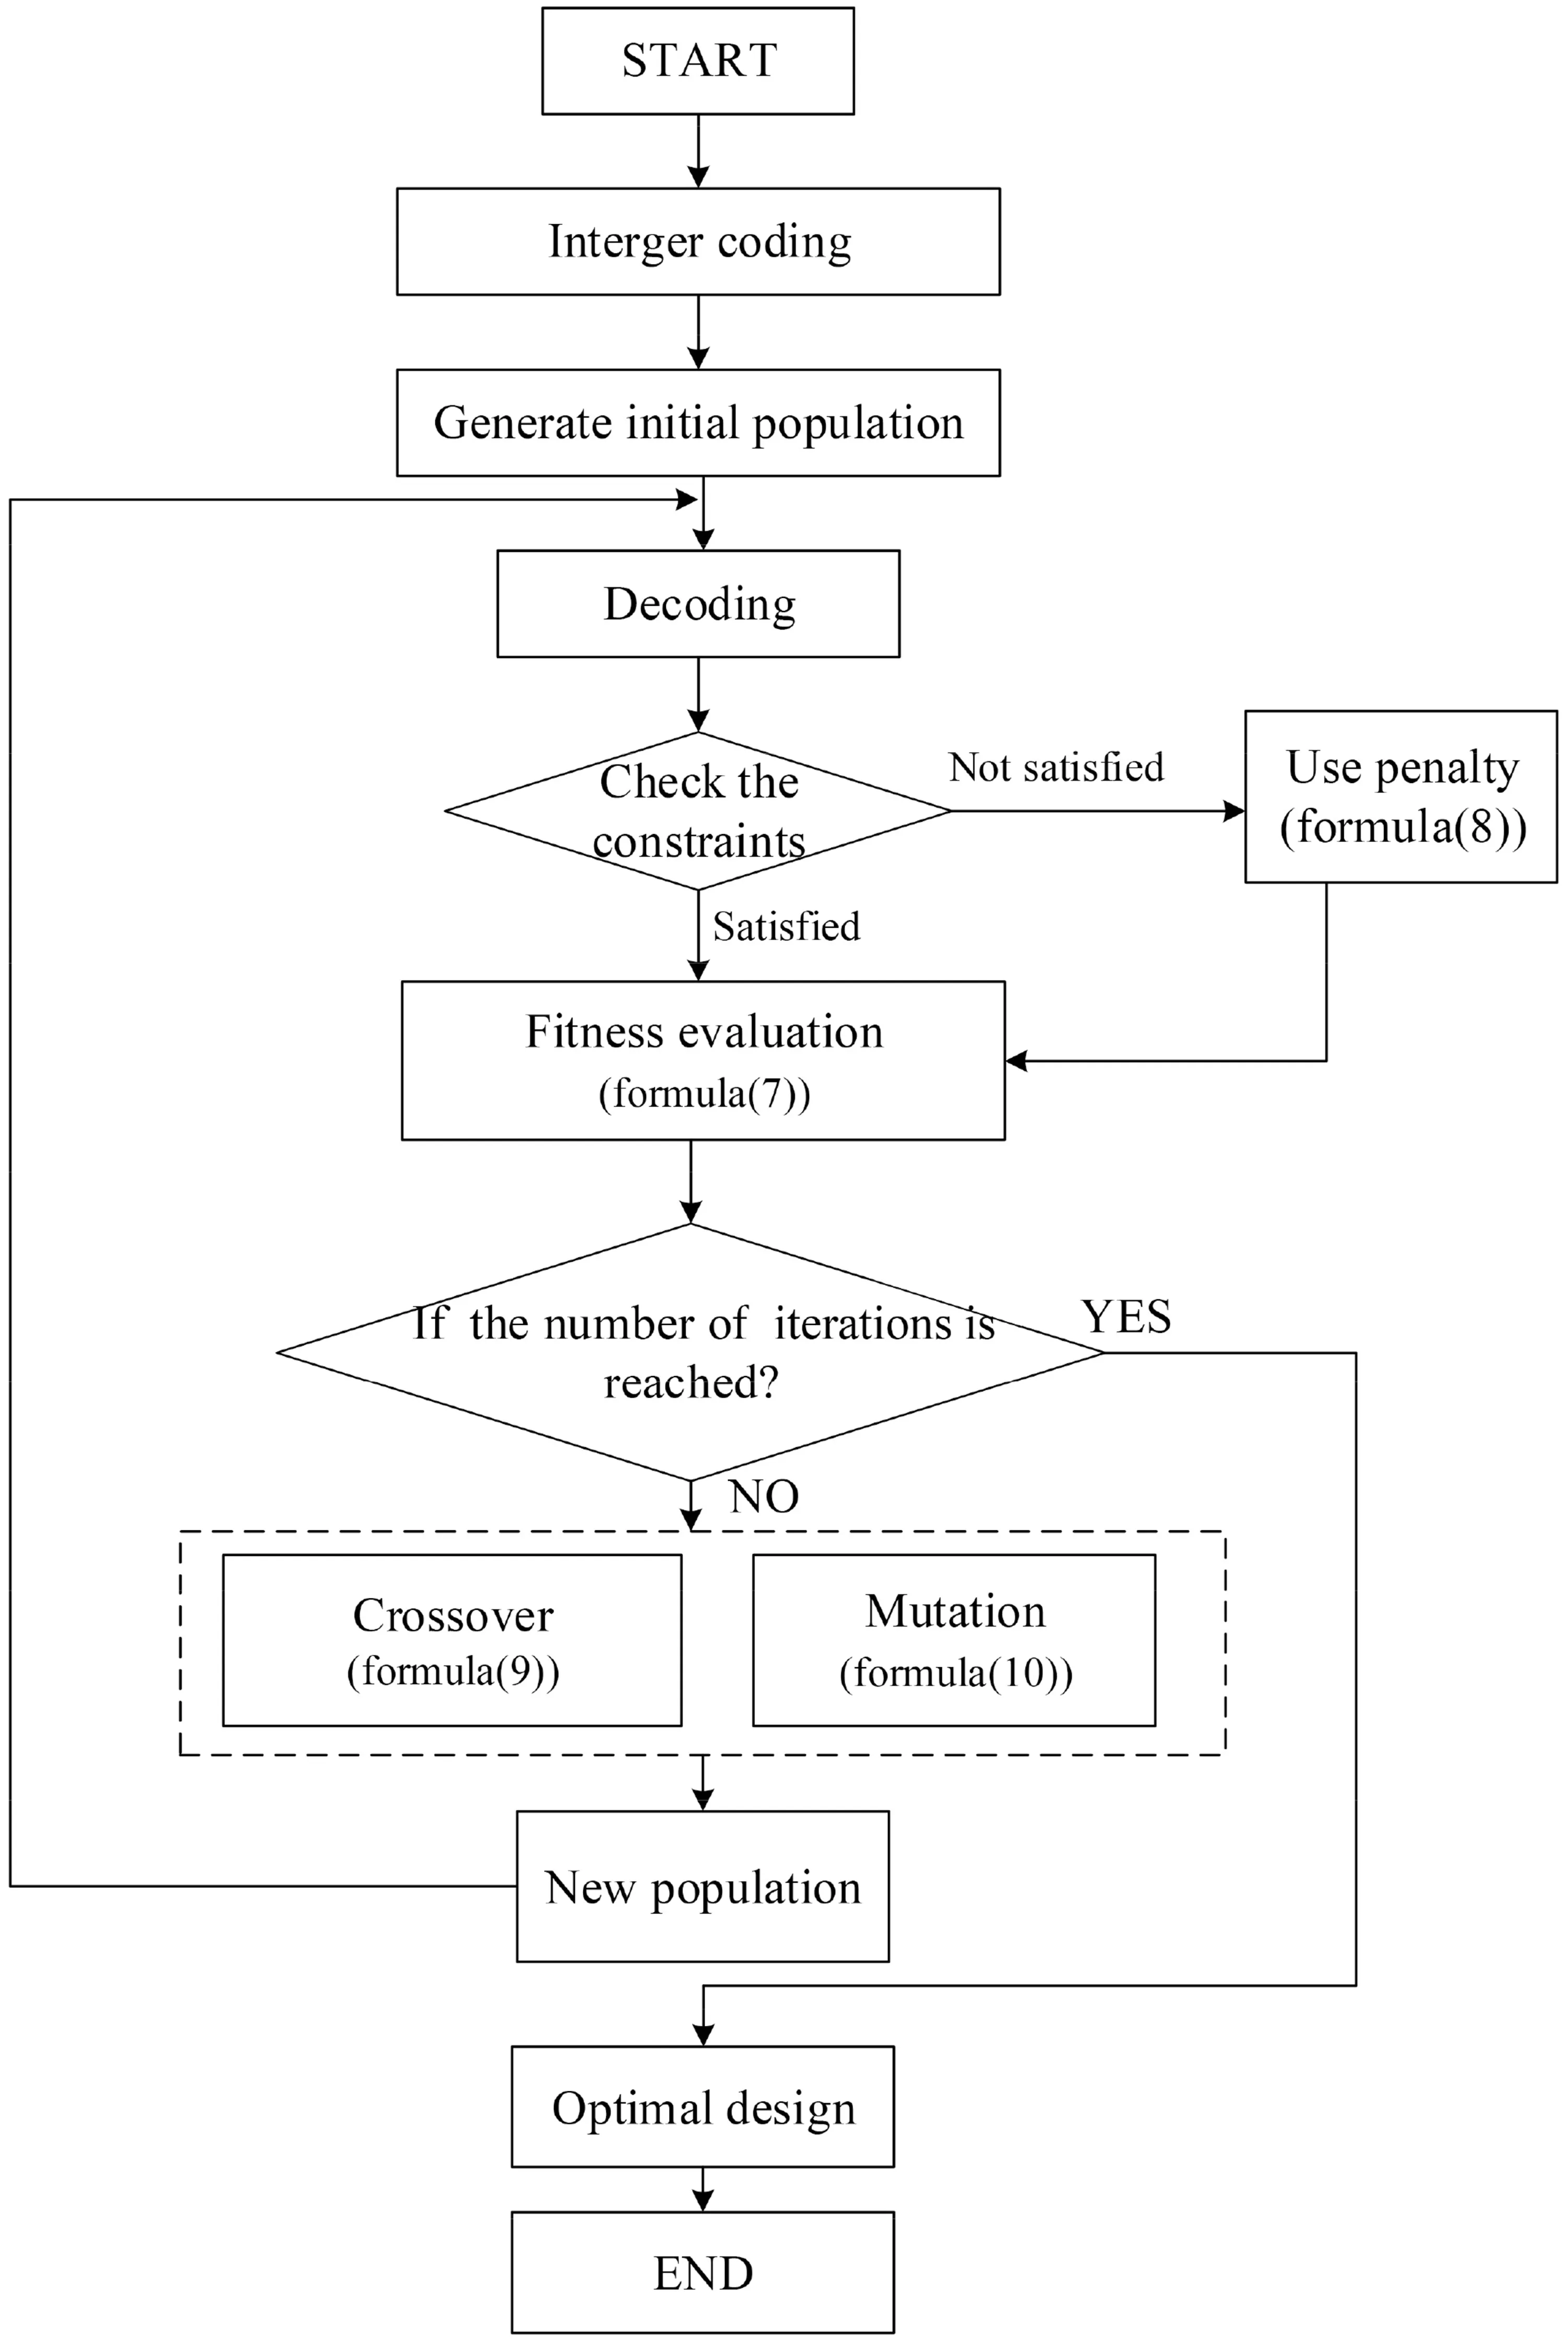
Fig. 3 Flowchart of adaptive genetic algorithm

wherefis the f itness;Gis the penalty function, when the constraints are not met,P i= 1, and the penalty function is executed on the f itness; a is the coeffi cient(mainly because the construction cost of the drainage pipe network is relatively high, to avoid the reduction of the optimization potential due to inadequate adaptation to obtain a local optimum).
• Crossover. Adaptively adjust the crossover probability. The crossover probability calculation formula is:
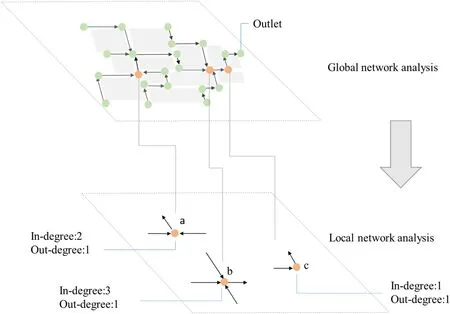
Fig. 4 Relationship between the global network analysis and the local network analysis

The termination criterion of the algorithm is to achieve the preset number of iterations.
2.2.3 Complex Network AnalysisTwo-layer complex network analysis is developed, consisting of a global network analysis for all nodes and a local network analysis applied individually for each node (Fig. 4).
(1) Global network analysis
Global network analysis is applied to f ind the crucial nodes in the urban drainage system. The role of particular nodes in the graph and their eff ects on the network may be determined using centrality, which can aid in the identif ication of signif icant nodes. Betweenness centrality and closeness centrality are essential in network analysis (Freeman 1977; Brandes 2001). In a big water distribution system, demand was indicated by the betweenness centrality (Sitzenfrei 2021). The edge betweenness centrality for sewage systems was adjusted by Hesarkazzazi et al. ( 2020) to ref lect how frequently an edge is included in the shortest path from the source vertices to the outlet. In this study, customized modif ications are introduced:betweenness centrality refers to the frequency at which a node appears on the shortest path in the network; closeness centrality represents the average distance from a node to the outlet:

whereC B(v) is the betweenness centrality;s,v,tare nodes;Vis node set;σst(v) is the number of shortest paths fromstotthroughv;σstis the number of shortest paths fromstot;C c(v) is the closeness centrality;Gis the graph;dG(v,t) is the minimum length of any path connecting nodesvandtinG;Iis node value; andw1 andw2 are weights determined by the Analytic Hierarchy Process. In this studyw1is 0.2,w2is 0.8. The Analytic Hierarchy Process analysis was done according to Zhang et al. ( 2022).
(2) Local network analysis
Local network analysis, which includes degree (d), indegree (din), out-degree (dout), and maximum degree (d m), is a focused investigation of nodes with higher values derived from global network analysis. Degree describes how many edges are connected to a node; in-degree describes how many edges enter the node; out-degree describes how many edges leave the node; and maximum degree describes how many edges can connect to the node:

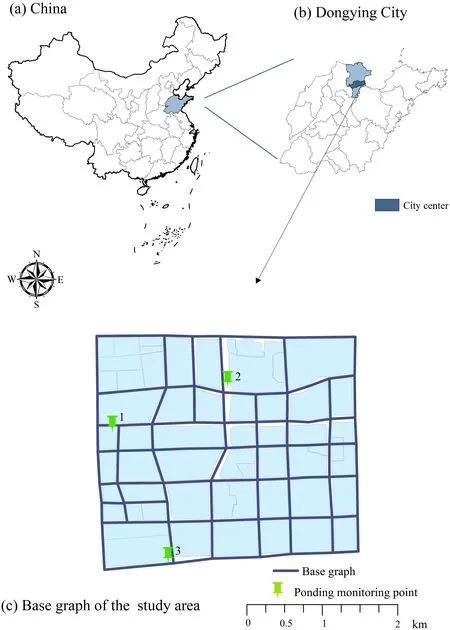
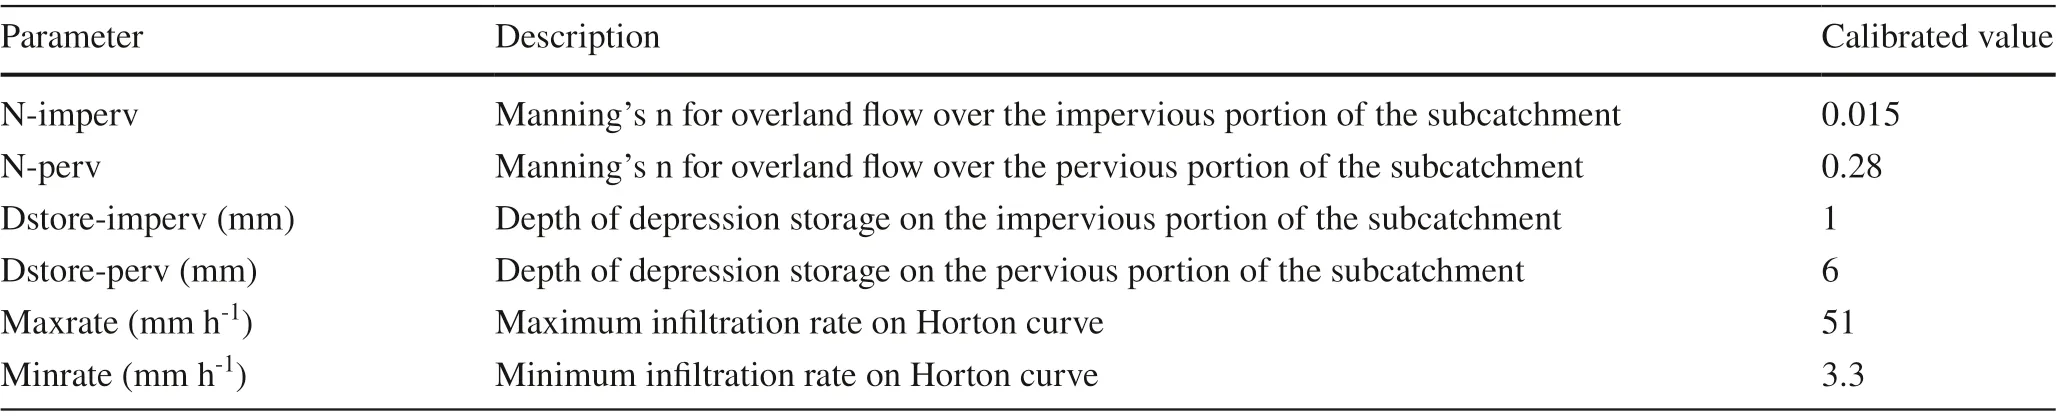
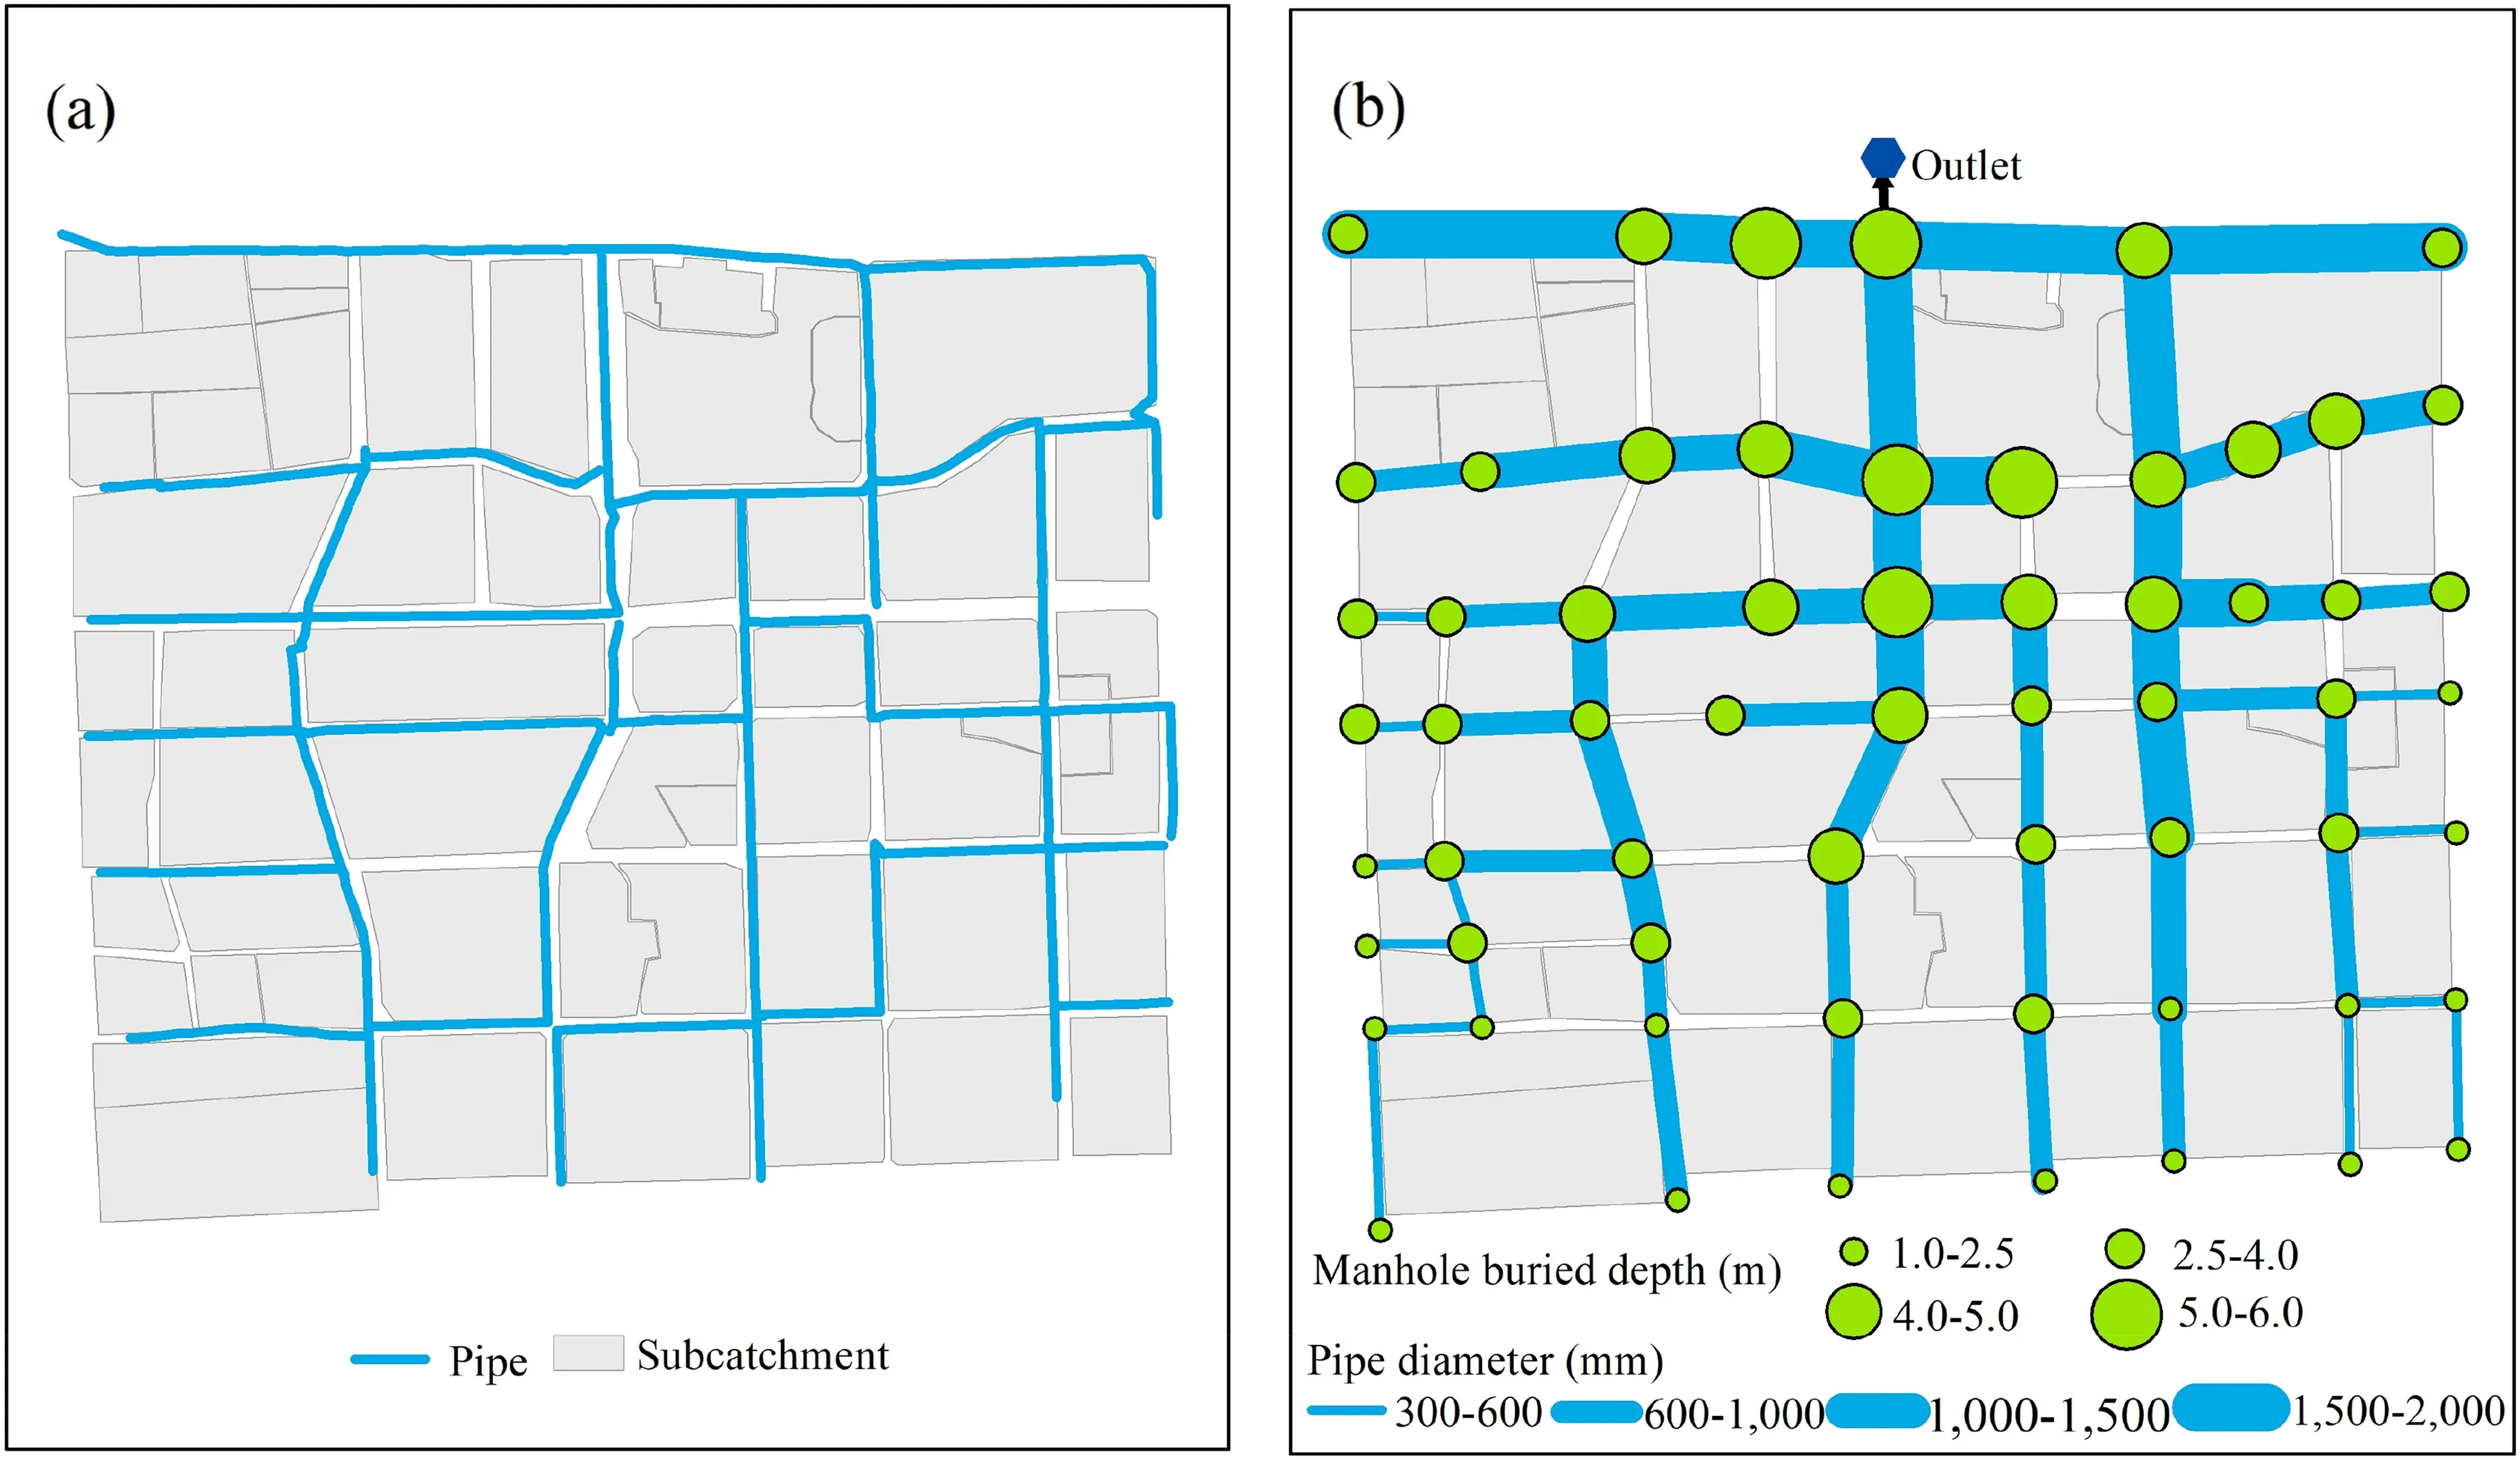
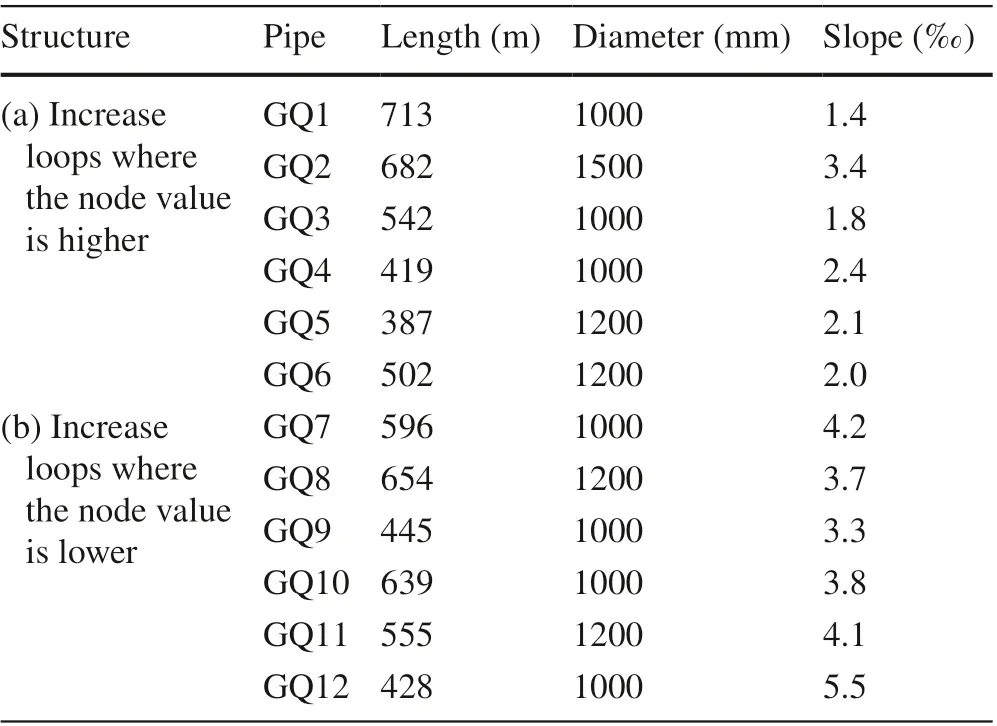
Ifd The study area is located in the eastern part of the Dongying City center, Shandong Province, China, with an area of 8.916 km 2 (Fig. 5). The Storm Water Management Model(SWMM) was used for hydraulic simulation (Rossman 2015). The characteristics of the subcatchment and original stormwater engineering were obtained through a digital elevation model dataset and current status. The elevation of the study area is high in the south and low in the north. The impervious coverage rate is 90.9%. We used elevation data with a resolution of 30 m × 30 m, and land use data with a resolution of 10 m × 10 m (Fig. 6). The total length of the original drainage pipe is 25,142 m, and the pipe density is 2.82 km/km 2 . The pipe diameter ranges from 300 to 2000 mm. The research area has monitoring equipment for ponding points as well as a rain gauge station nearby. The rainfall data were recorded by the rain-gauge station from 18 to 20 August 2018, and the data of the three waterlogging points’f looding depth are used to calibrate the parameters (Fig. 7 a).The model is acceptable because all errors are within 10%(Table 1). The f inal calibration parameter values of SWMM are shown in Table 2. The verif ication results show that the coeffi cientR eis greater than 0.9, indicating that the validity and accuracy of the model are acceptable (Table 1). The calibrated values of the parameters for SWMM are shown in Table 2. There is a strong correlation between street networks and urban water infrastructures–around 80% of total sewer networks correlate with 50% of the street networks (Mair et al.2017). Subcatchments are divided according to the distribution of buildings and streets in the study area. The digital elevation model is subjected to a spatial analysis to ascertain the f low direction. The design return period of drainage pipes in important areas is 3–5 years. The study area belongs to the northern residential area of Dongying City, which is a relatively densely populated residential area. The return period for design pipes is f ixed at 5 years for safety concerns.For the hydraulic assessment of the urban drainage system,rainfall with 10-year and 20-year return periods is used (see Fig. 7 b). The rainfall of 10-year and 20-year return periods is 80.7 mm and 92.3 mm, respectively. According to the rainstorm intensity formula of Dongying City (Di et al. 2017),the rainfall design is shown in Fig. 7 b. The local drainage system’s layout is f irst obtained using the methods and datasets described in Sect. 2; then, the hydraulic performance of the drainage system is assessed before and after optimization; and lastly, the system performance with or without redundancy is examined. The base graph is a fully looped system in which all possible conduits are connected. The initial optimized layout obtained by applying the graph theory algorithm (see Sect. 2.2.1) and the adaptive optimization algorithm (see Sect. 2.2.2) is shown in Fig. 8 b. The total length of the optimized network is 23,527 m, with one drainage outlet. Themaximum diameter of the pipe used is 2000 mm, and the minimum diameter is 300 mm. The minimum buried depth and maximum buried depth of the manholes are 1.0 m and 6.0 m, respectively. The layout of the urban drainage system before optimization is shown in Fig. 8 a. Fig. 5 Location of the study area in Dongying City, Shandong Province, China. a China;b Dongying City; c Base graph of the study area A comparison of the hydraulic performance of the optimized urban drainage network with the original drainage network in the study area shows that the total overf low volume (TOV) of the optimized network has a reduction of 65.7% and 59.6%,respectively, under the 10-year and 20-year rainfall scenarios.The mean f lood duration (MFD) of the optimized drainage network is lower than that of the original network (Table 3). Under the 20-year rainfall scenario, the pipes’ surcharge rate is higher than it is under the 10-year rainfall scenario(Fig. 9). Most of the surcharged pipes of the two networks are distributed downstream. This is due to the fact that the f low through the pipe increases when water f low is focused downstream, which causes the pipes to be surcharged.As a result, it is conceivable to think about adding pipes downstream to improve redundancy and lower the downstream pipelines’ drainage pressure. Fig. 6 Overview of the study area. a Ground elevation; b land use Fig. 7 Rainfall data used in the study. a Rainfall event used for calibration; b design storm under diff erent return periods (5-year, 10-year, and 20-year): 2-h design hyetograph The software Gephi is used to show the data and perform complex network analysis of the urban drainage system(Bastian et al. 2009). Gephi is free and open source software for graphics and network visualization.1For download and installation, visit https:// gephi. org/The nodes’color shade represents the betweenness centrality, and the size of the nodes denotes the closeness centrality (Fig. 10).be increased. Figure 11 a and b present the introduction of pipes with higher node values and lower node values,respectively. Table 1 Flooding depth of the three waterlogging points According to the results of the complex network analysis, the network structure of the existing drainage system is optimized. To prove the eff ectiveness of the complex network analysis method, the position with lower node value is selected to increase the redundancy (Fig. 11).Through global network analysis, nodes with higher index values are obtained. To facilitate comparison, the values are normalized, and the calculation results of the index value of each node are shown in Table 4. Local network analysis is applied to nodes with higher index values to determine the locations where pipeline redundancies can Table 2 Calibrated values of the parameters for the storm water management model (SWMM) Fig. 8 Urban drainage network of Dongying City center. a Urban drainage network before optimization; b urban drainage network after preliminary optimization In Table 5, the parameters of the introduced pipes are summarized. Network (a) adds a total length of 3245 m and a maximum pipe diameter of 1500 mm. Network (b) adds a total length of 3317 m and a maximum pipe diameter of1200 mm. The performance of network (a) and network (b)are simulated under diff erent rainfall scenarios. Table 3 The performance of the original urban drainage network and the designed network Fig. 9 Distribution of surcharged pipes. Pipe surcharge rate is the ratio of the length of the surcharged pipe to the total length of the pipe Fig. 10 Complex network analysis results (node attribute value visualization) In Fig. 12, the TOV of network (a) under the 10-year and 20-year rainfall scenarios is 12,610 m 3 and 20,910 m 3 ,respectively, which is 31.6% and 20.2% less than the preliminary optimized network. The TOV of network (b) is 16,690 m 3 and 25,500 m 3 under the 10-year and 20-year rainfall scenarios, respectively, which decreased by 9.5% and 2.7%compared with the network. In comparison to the preliminary optimized network, the mean and maximum f lood duration of network (a) are both decreased, with the maximum f lood duration decreasing more noticeably. The mean and maximum f lood duration both drop in network (b), however the decrease is smaller than in network (a). It shows that the network that introduces pipes at higher node values has better resilience. Through the use of hydraulic design and layout selection,the preliminary optimum urban design network is created. The TOV and MFD of the preliminary optimized urban drainage network are reduced. The TOV of the urban drainage network after optimization is reduced by more than 50% compared with the urban drainage network before optimization. However, in conjunction with the surcharge position of the pipes in Fig. 9, it can be seen that, although the optimized drainage system performs better, its downstream pipes still bear great drainage pressure when faced with rainfall exceeding the design standard. Current urban drainage systems typically have dendritic layouts (Haghighi 2013; Steele et al. 2016; Kwon et al. 2021). The drainage pressure on the main pipes anddownstream will certainly increase as the water collects.As a result, the surcharge of the pipes frequently happens in these locations (Lu et al. 2021). Table 4 Complex network analysis results (index values of nodes) As shown in Fig. 12, when the rainfall exceeds the design standard, the stormwater pipe network (a) and network (b)perform better in terms of drainage than the network without taking redundancy into account. Some studies def ine redundancy as meshness (the number of pipes connected to the node in addition to the source node and the outlet node)(Reyes-Silva et al. 2020). A network with a higher meshness value has shorter f lood duration and smaller node f lood volume than a predominantly branched network. This is in line with the current f indings. Network (a) and network (b) both increase redundancy and provide additional water f low paths and storage capacity. The diff erence is that network (a) shows higher resilience than network (b). If there are not many diff erences between the two networks’ storage capacities, it is presumed that the improved resilience results from better f low distribution. Yang et al. ( 2019) mentioned in their study of stormwater drainage systems that the number of deteriorating pipes is not the decisive factor for node f looding, and the topological location has a considerable impact on performance. The introduction of parallel pipes at reaches with bottleneck problems to increase the loop has higher effi ciency in terms of f lood prevention (Yazdi 2017).In this study, introducing pipes at locations with higher node values can reduce TOV by 31.6% and 20.2%, respectively, under the 10-year and 20-year rainfall scenarios.This f inding suggests that the topological position of the pipes, as opposed to their quantity or length, is more crucial to the drainage system’s performance. This also suggests that adding extra pipes in the right place can improve system resilience. The performance of an urban drainage system depends on the properties of the fundamental components (such as pipes) and the interdependence between the functions of these various components, which is a system-level phenomenon. Complex network analysis identif ies components that need to be prioritized to improve network performance from a system perspective. Fig. 11 Optimized structure considering pipeline redundancies. Network a introduces pipes where the node value is higher; Network b introduces pipes where the node value is lower. PN represents the pipeline node, and GQ indicates the pipe Table 5 Parameters of the introduced pipes Urban floods are becoming increasingly common as a result of urbanization and climate change, and the capacity of urban drainage systems to handle heavy precipitation is crucial for flood management and catastrophe mitigation. How to optimize the network structure of urban drainage systems to have better performance and resilience is a fundamental scientific issue of urban hydrology. This study proposes an optimization method for the network structure of urban drainage systems, which combines graph theory algorithm, adaptive genetic algorithm, and complex network analysis. This method enables the identification of where to increase the pipeline redundancies accurately to optimize the network structure of urban drainage systems. The initial optimum hydraulic design and layout can be obtained using graph theory and adaptive genetic algorithms. Complex network analysis is used to identify key nodes in the network and improve the resilience of the system by increasing the structural redundancy at locations with higher node values. The case study of an urban area demonstrates that increasing pipeline redundancies in the network can improve drainage performance. When compared to a structure that does not take redundancies into account, the one that does can cut TOV by 20–30% and the maximum f lood duration by 2–3 h. According to the f indings, a network with more pipeline redundancies is more eff ective at preventing f looding and has more potential to improve resilience. Fig. 12 Drainage performance comparison between the preliminary optimized network and the optimized networks for 10- and 20-year return periods Urban drainage systems are often very complex because pipe networks have diff erent spatial and temporal behaviors through structure and interaction of edges and nodes. The complex network analysis enables the identif ication of the crucial nodes in the drainage network and then locates the location of additional pipes, which solves the problem of determining where to increase the loop. The developed network structure optimization method off ers a way to increase pipeline redundancies and provides new opportunities for improving the resilience of urban stormwater systems.Future research should investigate the cost-eff ectiveness of increasing redundancy in improving the drainage effi ciency of urban drainage systems. Additionally, resilience indices to evaluate the impact of redundancy on system resilience are recommended for future studies. Acknowledgements This study was supported by the Chinese National Natural Science Foundation (Grant No. 51739011 and 52192671) and the Research Fund of the State Key Laboratory of Simulation and Regulation of Water Cycles in River Basins (Grant No. SKL2022TS11). Open AccessThis article is licensed under a Creative Commons Attribution 4.0 International License, which permits use, sharing,adaptation, distribution and reproduction in any medium or format,as long as you give appropriate credit to the original author(s) and the source, provide a link to the Creative Commons licence, and indicate if changes were made. The images or other third party material in this article are included in the article’s Creative Commons licence, unless indicated otherwise in a credit line to the material. If material is not included in the article’s Creative Commons licence and your intended use is not permitted by statutory regulation or exceeds the permitted use, you will need to obtain permission directly from the copyright holder. To view a copy of this licence, visit http:// creat iveco mmons.org/ licen ses/ by/4. 0/ .2.3 Study Area and Datasets
3 Results
3.1 Layout of the Urban Drainage System
3.2 Hydraulic Performance Assessment


3.3 Redundancy and Optimization


4 Discussion


5 Conclusion

杂志排行

International Journal of Disaster Risk Science的其它文章
- Sendai Framework’s Global Targets A and B: Opinions from the Global Platform for Disaster Risk Reduction’s Ignite Stage 2019
- Perceptions About Climate Change in the Brazilian Civil Defense Sector
- Is Being Funny a Useful Policy? How Local Governments’Humorous Crisis Response Strategies and Crisis Responsibilities Inf luence Trust, Emotions, and Behavioral Intentions
- The Eff ect of Natural Hazard Damage on Manufacturing Value Added and the Impact of Spatiotemporal Data Variations on the Results
- Understanding Farmers’ Preferences Towards Insurance Schemes that Promote Biosecurity Best Management Practices
- Institutional Capacity and the Roles of Key Actors in Fire Disaster Risk Reduction: The Case of Ibadan, Nigeria