Induced Earthquake Hazard by Geothermal Power Plants:Statistical Evaluation and Probabilistic Modeling
2022-12-14AliKhansefidSeyedMahmoudrezaYadollahiGerhardllerFrancescaTaddei
Ali Khansef id · Seyed Mahmoudreza Yadollahi ·Gerhard Müller · Francesca Taddei
Abstract This study statistically evaluated the characteristics of induced earthquakes by geothermal power plants (GPPs)and generated a probabilistic model for simulating stochastic seismic events. Four well-known power plant zones were selected worldwide from the United States, Germany,France, and New Zealand. The operational condition information, as well as the corresponding earthquake catalogs recorded in the vicinity of GPPs, were gathered from their commencement date. The statistical properties of events were studied elaborately. By using this proposed database,a probabilistic model was developed capable of generating the number of induced seismic events per month, their magnitude, focal depth, and distance from the epicenter to the power plant, randomly. All of these parameters are simulated as a function of power plant injection rate. Generally speaking, the model, introduced in this study, is a tool for engineers and scientists interested in the seismic risk assessment of built environments prone to induced seismicity produced by GPPs operation.
Keywords Geothermal power plants · Induced seismicity · Probabilistic modeling · Seismic hazard ·Statistical analysis
1 Introduction
Geothermal energy is one of the newly developed sources of clean energy production in many countries around the world.Geothermal power plants (GPPs) produce electrical energy using the hot water steam of extracted high-temperature water from the Earth’s crust (at depths of 2−10 km) that activates the electrical turbines (Fridleifsson et al. 2008).Since the volume of extracted water is signif icantly large, it is not possible to store it in surface reservoirs. In addition,this high temperature water works as a fuel for the GPPs,and the continuous extraction of water without any replacement would destroy the underground water resources. To overcome these problems, the cooled water is injected back into the Earth under high-pressure. This repeated extraction/injection process may cause some changes in the stress magnitude of the underlying Earth layers, thus creating or extending cracks in the crustal rocks. The fractured rocks may trigger a series of small to moderate magnitude earthquakes over a long period (Kraft et al. 2011). Since many GPPs are constructed close to populated areas, the induced vibrations from the operation of GPPs may cause inconvenience for building residents, and also cause damage to the buildings’ structural and nonstructural components (Zastrow 2019). Such undesired vibrations with a high recurrence rate can bring about claims by building owners that, in some cases, lead to GPP shutdown. For instance, the South Korean geothermal power plant in Pohang City was shut down after a severe earthquake with a magnitude of 5.4 occurred in 2017 (Ellsworh et al. 2019; Zastrow 2019). A Similar problem occurred in Basel, Switzerland, after the 3.2 magnitude earthquake of 8 December 2006 (Mignan et al. 2015) due to the local GPP’s activity. Additionally, Khansef id et al.( 2022a) showed that GPP-induced earthquakes can cause some levels of disruption to the occupants’ life in vulnerable masonry buildings. Accordingly, it is highly important to study the seismic risk of this type of electric power plants.
A review of literature indicates that there are some research works on the induced seismicity of specif ic GPP sites. As an early work, Eberhart-Phillips and Oppenheimer( 1984) studied the microseismicity of the region around Geysers GPP in California and showed that events occur wherever the steam production exists. However, they could not identify any specif ic correlation between the injection rate and the magnitude of seismic events. This issue was raised again in other GPPs such as Wairakei (Allis et al.1985); however, it was shown by Bromley et al. ( 1987) that increasing the power plant production causes a swarm of events triggered by both extraction and reinjection of f luids.In another work, Charléty et al. ( 2007) dealt with the eff ects of f low rate and wellhead pressure on induced earthquake magnitude and its distribution over three main boreholes of Soultz-sous-Forêts GPP in France. In addition, a more comprehensive study of Majer et al. ( 2007) investigated the relationship between the number, distance, and depth of GPPs’induced earthquakes and the injection rate for the Geysers,Cooper Basin, Berlin, Soultz-sous-Forêts, and Basel GPPs.Cuenot et al. ( 2008) simulated the hydraulic water injection in a well of Soultz-sous-Forêts GPP experimentally and traced the wave propagation and microseismic activity of the region using the installed seismological network. It was shown by Nicol et al. ( 2011) that most of GPP microseismic events occur during the injection and extraction process of the water stream, and are clustered at shallow crustal depths.Moreover, Evans et al. ( 2012), based on their observations,believed the sites with sedimentary rocks are less seismogenic than the ones with crystalline rocks, and in both cases,faults located near injection wells can increase the seismic activity signif icantly. In a series of works, Shapiro et al.( 2007, 2010, 2013) attempted to obtain the probability of observing an induced earthquake with a given magnitude.Megies and Wassermann ( 2014) installed several seismometers in the Molasse Basin to trace the induced seismicity by the GPPs located around Munich City, which lead to the recording of several events with a local magnitude of up to 2.4. In some other works, several researchers (Bachmann et al. 2012; Langenbruch and Zoback 2016; Leptokaropoulos and Staszek 2019) tried to evaluate the relationship between the injection rates and the earthquakes’ magnitude in diff erent GPPs. Kwiatek et al. ( 2015) also worked on the induced seismicity in the northern part of Geysers GPP,due to long-term f luid injection. Cheng and Chen ( 2018)performed a statistical analysis on the distance of observed seismic events induced by the Salton Sea GPP operation,and found that the magnitude of events located outside the def ined ring of a GPP (radius of 2−5 km) is f ive times less than the ones located near the power plant. Broccardo et al.( 2020) estimated the seismic risk of the Geldinganes GPP in Iceland. Their study emphasized the need for reevaluation of the risk by using updated data throughout a power plant’s activity. Convertito et al. ( 2021) also performed a time-dependent seismic hazard analysis of the St Gallen geothermal f ield. More recently, Khansef id et al. ( 2022b)worked on recorded ground motions due to GPP activities to develop a set of ground motion models.
Most of the existing work has dealt with the induced seismicity by geothermal power plants from the physicsbased point of view and there are only a few studies (Mignan et al. 2015; Langenbruch et al. 2020) on the seismic risk assessment of such earthquakes, which points to need for probabilistic models, developed based on the statistical characteristics of earthquakes. Accordingly, this research is an attempt, from the engineering perspective, to initially examine the eff ects of geothermal power plant activity on the induced seismicity identif ied in four GPP zones around the world, and then propose a probabilistic model for simulating the seismic events due to the operation of GPPs. First, the general information of GPPs and their injection rates were collected from diff erent sources. All of these GPPs continue in operating status. The induced earthquake data obtained during their operation period were also supplemented from several online earthquake catalogs. These data were f iltered by considering the minimum completeness magnitude of the catalog. Also examined were the eff ects of geothermal activity, especially the injection rate, on the properties of recorded events such as moment magnitude, focal depth, and the distance of events from GPP stations. Using the proposed database, a probabilistic model was developed to simulate,randomly, earthquakes induced by the GPP activity. The model procreates the number of probable events per month,their magnitudes, focal depths, as well as their distance from a GPP station based on the power plant’s average operational injection rate per month. In the last step, the model was validated through application of diff erent methods. Generally speaking, this model is a powerful tool for scientists and engineers who are interested in and in charge of estimation of seismic risk due to the operation of geothermal power plants.
2 Geothermal Power Plants Information
A total of eight active GPPs located in the United States,Germany, France, and New Zealand are selected for further analysis. Each of these power plants contains several active water injection wells. The Geysers geothermal plant is located in northern California, the United States. This GPP started operating in 1960 and is known as one of the biggest natural geothermal sites in the world. The Salton Sea and the Brawley GPPs are constructed in the Imperial Valley region of southern California, the United States, with the startingoperation date of 1982. These two power plants are located in the close proximity to each other. Therefore, they are considered as a single GPP zone called “Imperial.”. In central Europe, four GPPs are operating near the border of Germany and France in the Rhineland area using the enhanced water circulating systems. The Landau and the Insheim GPPs are located in western Germany and have started their operation from the years 2007 and 2012. The Soultz-sous-Forêts and the Rittershoff en GPPs are located in eastern France and have been operating since 2008 and 2016. The four GPPs are grouped as a “Rhineland” GPP zone. The last GPP is Kawerau, which is located near the town of Kawerau inland from the Bay of Plenty, the northern coast of North Island, New Zealand, and its injection wells started operating in 1993.The information summary of these GPP zones is presented in Table 1, while their location map is shown in Fig. 1.
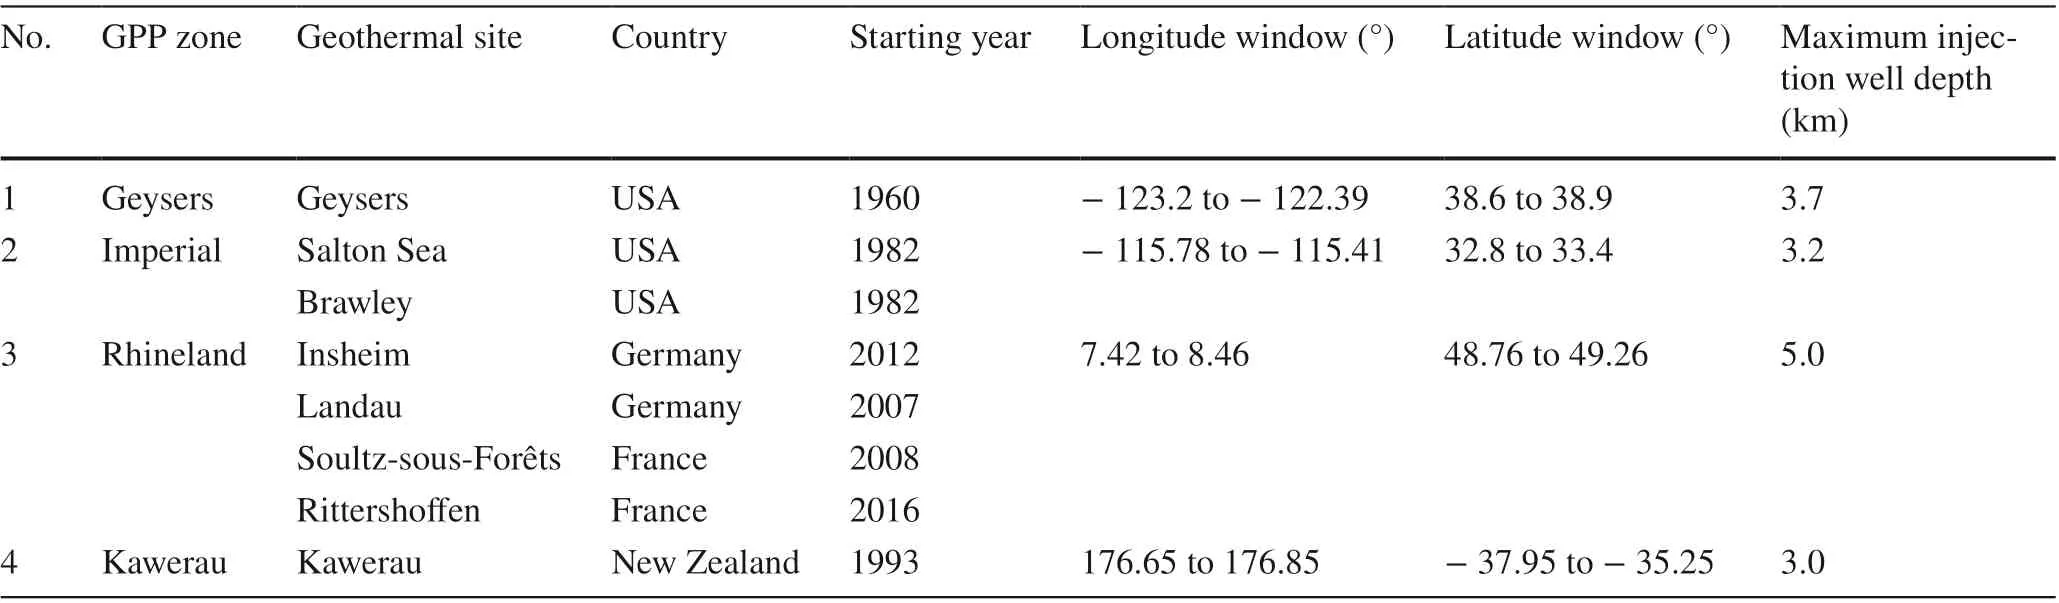
Table 1 Geothermal power plants information
The exact location of the Geysers, Salton Sea, and the Brawley power plants are collected from the Geothermal Prospector (Getman et al. 2015), a web GIS framework developed by the National Renewable Energy Laboratory.The detailed data of monthly water injection throughout geothermal activity are archived in the California Department of Conservation website (California Department of Conservation 2020). The information of GPPs in Germany and France is available on the website of Geothermal Information System, called GeotIS, (Pester et al. 2010), which is supported by the Federal Ministry for Economic Aff airs and Energy of Germany. The location of Kawerau GPP in New Zealand is adopted from the Global Energy Observatory(Gupta and Shankar 2018) website, and the injection rates are available in the Bay of Plenty Regional Council catalog (Bay of Plenty Regional Council 2018). The injection f low rates of all wells per month for each of the GPP zones are shown in Fig. 2. These f low rates are illustrated for the whole period of GPPs operation. Diff erent GPPs report their injection rate with diff erent time windows of daily, monthly,or even yearly. As it can be seen, the GPPs operate in the Imperial, Geysers, and Kawerau zones work with a higher injection rate (2000−3000 l/s) in comparison with the ones in the Rhineland zone (200−400 l/s).
3 Earthquake Catalogs
As is typical of all research work that focuses on the development of probabilistic models to study seismicity, earthquake catalogs play a key role in the f inal quality and accuracy of the model. Since there is no separate earthquake catalog for the events induced by human activities, especially the ones caused by GPPs, a major challenge is to create such a catalog.1The developed event database is accessible via email request from the corresponding author.For the selected GPP zones, diff erent online credible sources of earthquake event catalogs are used. For the Geysers and Imperial zones, the United States Geological Survey ( 2020) is used. In the case of the Rhineland zone,the data published by the International Seismological Center catalog ( 2020) is adopted. For the Kawerau GPP zone, the catalog presented by the Geological Hazard Information for New Zealand ( 2020) is employed to collect the microseismic data. Only some criteria are taken into account to select the seismic data: (1) Events related to the time period of GPP operation are considered for this study; (2) The events that occurred within the shallow focal depth (around 1−10 km)are collected based on the depth of GPP wells varying from 500 m to 5 km (see Table 1); and (3) A spatial window with a radius of approximately 25 km around the power plants is considered as a surrounding possible area of earthquake occurrence.
Since the seismic data are collected from different sources, their magnitudes are reported in diff erent scales,including moment magnitude (M W), local magnitude (M L),and duration magnitude (M D). To homogenize all data,scales ofM DandM Lare converted toM W, which is morefamiliar to the earthquake and structural engineers and scientists who are the target community of the proposed model.Diff erent equations (Table 2) are applied to convert the magnitudes for each of the GPP regions.

Fig. 1 Location map of selected geothermal power plant (GPP) sites, including Geysers, Salton Sea, Brawley, Kawerau, Insheim, Landau,Soultz-sous-Forêts, and Rittershoff en
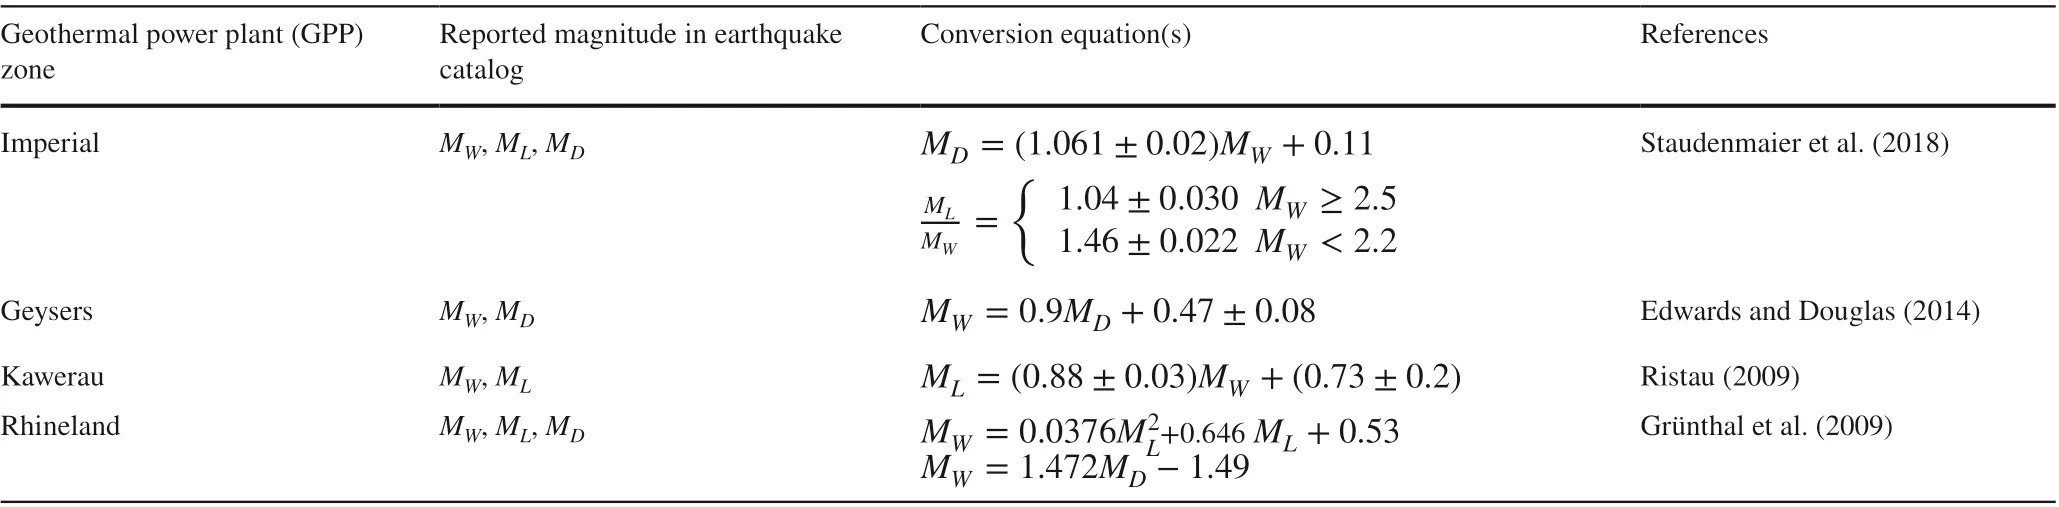
Table 2 Adopted equations for the moment magnitude scale conversion
After homogenizing the earthquake catalogs, it is necessary to ref ine them and remove the events recorded below the magnitude level that the seismometer networks could reliably and consistently record. Accordingly, the minimum completeness magnitude (M C) of each catalog is calculated for the 10 year time-windows using the entire range magnitude method (Ogata and Katsura 1993), which is more comprehensive and stable than many other existing methods in the literature (Woessner and Wiemer 2005). The uncertainties of the completeness magnitude are also considered by obtaining their standard deviation using the Monte Carlo bootstrapping method (Efron and Tibshirani 1993). The results for each of the GPP zones during diff erent time windows are shown in Table 3 along with the maximum moment magnitudes obtained by Kijko’s ( 2004) methodology. With the passing of time, theM Cdecreases in all catalogs, which implies the improvement of seismic networks responsible for recording the events during the decades since a GPP began operation. Fortunately, after eliminating the events with magnitudes lower thanM C, an acceptable number of events remain for each of the GPP zones for further analysis(Table 3). The spatial distribution of the remaining data,showing their magnitudes, is depicted in Fig. 3. Clearly,earthquakes with higher magnitudes occur closer to the GPP stations’ wells.
The last, but not least important issue about the earthquake catalogs is the existence of background seismicity by other possible sources in the GPP zones. In the Geysers and Rhineland GPP zones, there are no considerable seismic events before the commencement of water injection.Therefore, the catalogs contain no tangible background seismicity. In the Kawerau GPP area, there were fewmicroseismic activities before 2006 that are likely induced events connected to that GPP because of their shallow depth and proximity to the power plant. Owing to the lack of available data for injection rates during its early years of operation, the Kawerau GPP is evaluated only from 2006.In the case of the Imperial zone, there were some seismic events before injection began. However, the focal depths of these events, as well as their magnitudes, are considerably higher than the range of events that occurred after the GPP operation starting date. Thus, it can be inferred that the available catalog of the Imperial zone also contains no tangible and aff ecting background seismicity. In the end,after all of these controls for selecting the data, it is still possible that a limited number of unrecognized tectonic earthquakes exists in the catalog.

Table 3 Minimum completeness magnitudes of earthquake catalogs of diff erent geothermal power plant (GPP)zones at diff erent times

Fig. 3 Geothermal power plant (GPP) site locations and the spatial distribution of the earthquake events induced by the GPPs’ operation in all GPP zones
4 Statistical Analysis of Induced Seismicity
The statistical relationships between the frequency and other features of earthquakes and the injection rate of geothermal power plants was studied in previous research works (Majer et al. 2007; Shapiro et al. 2010; Halldorsson et al. 2012;Kwiatek et al. 2015). However, most of these earlier works focused on the statistical analysis of induced seismicity caused by the water injection in a single well. In this study,with a regional perspective, the eff ect of water injection in multiple active wells in the diff erent GPP zones is considered. It is helpful to develop a probabilistic model capable of simulating seismicity considering GPP zones with multiple injection wells. From the risk assessment point of view, it is not enough to know the eff ects of only a single injection well. In an area with several wells, their cumulative eff ects are important on the people, buildings, and other infrastructure of the region. In this regard, the statistical properties of the main characteristics of earthquakes induced by geothermal power plant activity are evaluated for all the GPP zones,including moment magnitude (M W), focal depth (D), and the distance of the epicenter of seismic events to the GPP site(R). All of these parameters are important and eff ective in the imposed seismic risk to the built environments in the vicinity of GPPs.M Wis implicitly a measure of released energy in these earthquakes, while focal depth can show the relationship between the depth of injection wells and the hypocenter of earthquakes. In addition, the distance of the event epicenter to the GPP site shows the radius around the GPP zone, in which the earthquake occurrence is probable.
The frequency and cumulative density function (CDF) of these parameters in each of the GPPs, as well as the empirical cumulative probability density functions of observing an earthquake, with a given value or less for each of the parameters, is illustrated in Fig. 4. The f igure indicates that the moment magnitude of events varies almost from 0.5 to 3, and in very rare cases, it goes above 3, while still remaining below 4. The medians of observed moment magnitudes are 1.10, 1.75, 1.70, and 1.40 for the Imperial, Geysers,Kawerau, and Rhineland GPP zones. Most of these events occur in shallow depths. The focal depth of recorded events ranges from 1 to 10 km (considering the imposed limit on the focal depth) with the medians of 4.3 km, 4.5 km, 5.0 km, and 4.0 km for the Imperial, Geysers, Kawerau, and Rhineland GPP zones. The comparison of these values with the well depths of Table 1 shows meaningful consistency.In some cases, however, the focal depths are higher than the maximum well depth, which can either be due to the changes in the pore pressure level in the deeper crust layers (Brown and Ge 2018) or the uncertainties in their estimation process. In addition, the epicenter-to-GPP distance of catalog seismic events depicts most of the earthquakes occurring close to GPP stations. They started from 100 m,while the medians for the Imperial, Geysers, Kawerau, and Rhineland GPP zones are 2.8 km, 1.3 km, 2.9 km, and 1.8 km, respectively. Approximately, 93% of the induced earthquakes occur within a 10 km radius of GPP zones. It is also important to note that there are some levels of uncertainty in the reported epicentral location of the events, which can aff ect the calculated distance, especially in a short distance range (Woessner et al. 2010). Many of the databases used in our model have increased their accuracy over time. In addition, in the case of a distance calculation, at each GPP site,the GPP central location is f irst calculated by averaging the latitude and longitude of all injection wells. Then a radius of 25 km is considered for selecting the events. After that, the distance of each event is obtained as the distance between the event epicenter and the nearest GPP well in each zone.Therefore, injection in multiple wells simultaneously can leads to a higher range of distances, in comparison with the case of considering earthquakes due to injecting water in only a single well.
The relationship between the injection rate and the moment magnitude is another important variable in understanding the induced seismic events by the GPPs. Fig. 5 represents the variation of monthly injection rate, as well as the average and maximum magnitude of seismic events per month for all periods of GPPs operation. Despite the increase in the injection rate during the operational years,there are no general signif icant changing trends in the average and maximum magnitude of monthly earthquakes. In the Kawerau zone, a slight increase is observable in both parameters, but in the Imperial and Rhineland zones, a gradual reduction is seen. Finally, in the Geysers zone, no signif icant change is visible.
To assess the features of moment magnitudes of induced seismic events more precisely, the Gutenberg–Richter(Gutenberg and Richter 1954) equation in the logarithmic form is considered and its coeffi cients are calculated for each of the four GPPs’ catalog consideringM C.

whereaandbare the Gutenberg–Richter (G–R) coeff icients.Mis the moment magnitude andNis the number of events with a magnitude greater thanM.

Fig. 4 Distribution of seismological properties of induced earthquakes in terms of magnitude, distance, and focal depth

Fig. 5 The average and maximum magnitude of induced earthquakes per month for injection rate prof ile of geothermal power plants (GPPs)during their operation period
To investigate the eff ect of GPPs’ injection rate on the G–R coeffi cients, f irst, the available catalogs for all GPP zones are divided into diff erent groups per their injection rates. Therefore, bins of 500 l/s are considered based on the availability of data at diff erent injection rates. Next, for each group of each GPP zone, a separated G–R equation is f itted, and the coeffi cients are obtained. Fig. 6 shows the f itted G–R equations and observed data for all GPPs,which implies good f itness. Table 4 reports theaandbcoeffi cients of all GPPs for diff erent injection rates (IR).The rise in the injection rates increases thea-value, while theb-values at diff erent zones do not follow a tangible monotonic trend. Theb-values vary around 1.05−1.33,1.06−1.28, 0.73−1.07, and 0.8 for the Geysers, Imperial,Kawerau, and Rhineland, while thea-values of these GPP zones are around 3.5−5.94, 3.11−4.37, 3.18−4.43, and 3.07, respectively. In the previous works, for the Geysers(Leptokaropoulos and Staszek 2019), Imperial (Cheng and Chen 2018), and Rhineland (Cuenot et al. 2008), the average ofb-values equals to 1.05−1.25, 0.78−1.07, and 1.29,respectively. Some of these values slightly diff er from the average ofb-values in this research, which can be due to the usage of diff erent event catalogs. However, by considering the results of Table 4 for diff erent injection rates,the proposed results of previous research works are in the same ranges as those of this study.
We compared the main characteristics of the proposed database in this study with the ones presented and used in the previous research works by other scientists. As is shown in Table 5, the proposed catalog of this research covers a wider range of data from diff erent GPP zones in diff erent countries than does previous research. Also, the covered ranges of injection rates, moment magnitudes, focal depths,and time periods of collected data are signif icantly broader than the available databases. Therefore, this developed database will provide more opportunities for researchers to study the features and characteristics of GPP-induced earthquakes in the future.
5 Probabilistic Model for Simulating Random Seismic Events
In this part of the article, a model is developed through a probabilistic framework to consider the uncertainties related to the induced seismicity by GPPs operation.
5.1 Model Development

Fig. 6 Gutenberg-Richter curves for earthquakes per diff erent geothermal power plant (GPP) injection rates (IRs)

Table 4 Gutenberg-Richter a and b coeffi cients of all geothermal power plant (GPP) zones for diff erent ranges of injection rate (IR)
Most probabilistic models (Shapiro et al. 2007, 2010, 2013;Convertito et al. 2012; Barth et al. 2013) have focused on estimating the occurrence probability of earthquakes with a certain magnitude due to a GPP’s operation. To estimate the regional seismic risk of buildings from an engineering perspective, other earthquake features, such as magnitude,focal depth, and epicenter-to-GPP distance, need to be simulated as well. Accordingly, the proposed model attempts to simulate the number of probable events in the future, their magnitudes (M W), focal depths (D), as well as the distance of the occurred earthquakes from the GPP zone (R) by considering their correlations. All of these parameters may be aff ected by the injection rate of GPPs. Thus, the proposed model considers this parameter as a physical characteristic of GPP activities that control the induced seismicity in the surrounding area. In such a model, the availability of data plays a key role. By considering the number of available data in previously introduced and studied databases, the Imperial,Geysers, and Kawerau GPPs are selected for the next steps.Additionally, 80% of the available data are selected for the model development and the remaining data are used as a part of the validation process.
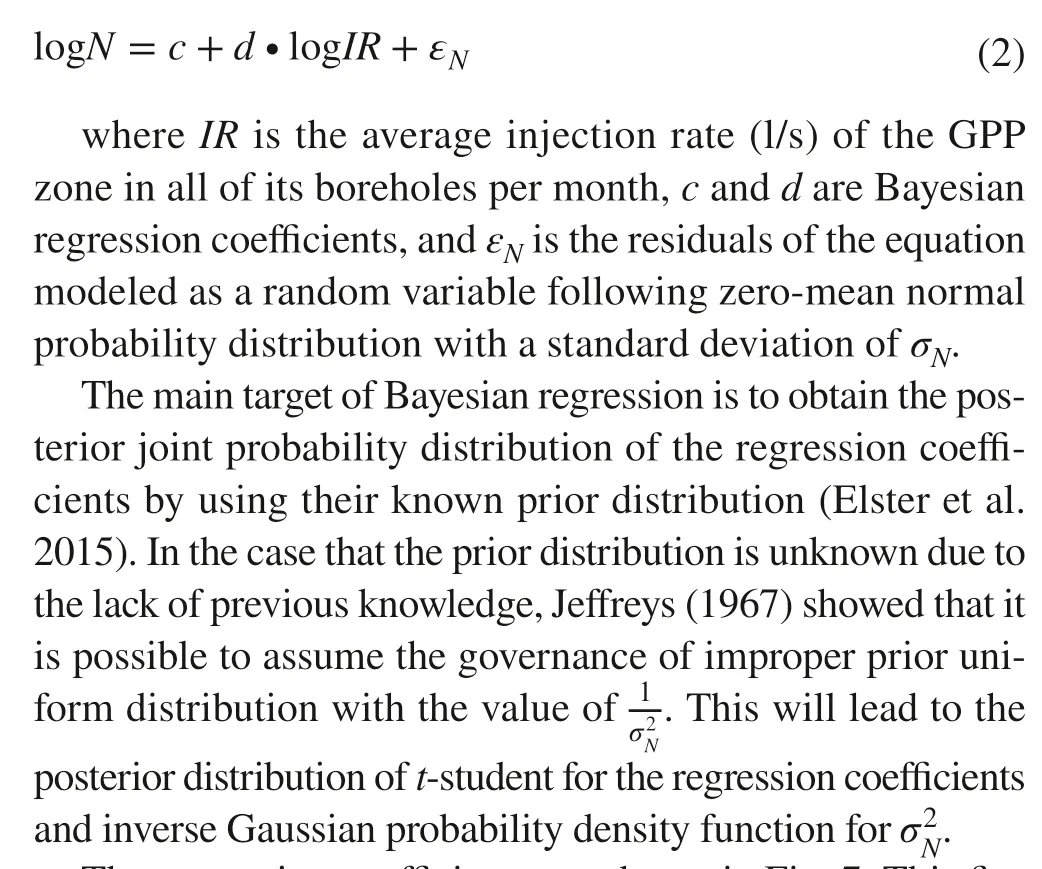
As a f irst parameter, the number of induced events per month (N) is simulated by using the linear Bayesian regression method (Gelman et al. 2004; Bishop 2007),which takes the uncertainties into account within the regression process by considering the regression coeffi -cients as random variables.

Table 5 Comparison of seismological characteristics of studied and proposed catalogs for the induced earthquakes by the geothermal power plant (GPP) operation in diff erent research works
The regression coeffi cients are shown in Fig. 7. This f igure also depicts the number of recorded events per month and their dependency on the GPP injection rate in the same time period for diff erent GPPs separately and also all GPPs together, in the logarithmic scale. The gradual linear increase in the logarithmic form of the number of events is observable in all GPPs by the increase of the injection rate.An appropriate consistency is traced between the f itted model and observed data for each of the GPPs. The regression correlation coeffi cients (R 2 ) of diff erent models range between 0.72 and 0.88, which conf irm the acceptable accuracy of the f itting process. In addition, the histograms of residuals of equation ( 2) prove that the consideration of zero-mean normal distribution for their behavior is an acceptable presumption. Finally, for the case of considering all GPPs together, the mean and standard deviation of obtainedt-student distribution for coeffi cientcare − 1.14 and 0.085, while these values for the coeffi cientdare 0.99 and 0.26, respectively. In addition, the standard deviations of residuals (σ N) are calculated as equal to 0.164, 0.243,0.261, and 0.237 for the cases of Geysers, Imperial, Kawerau, and all GPPs together.
After working on the number of randomly generated events, it is necessary to simulate the events’ magnitudes,focal depths, and distances from the GPP station. These parameters may depend on the injection rate of the power plant. Besides, different sources of uncertainties can aff ect induced seismicity, including the underlying soil layer condition, fault properties, injection well depths and locations, and so on. In this regard, the injection rate of GPPs is discretized and divided into diff erent bins, with a bin length of 20 l/s. For any bin, it is assumed that each of the considered variables, namely,M W,D, andR, follows the lognormal distribution (Pasari 2019) as a well-known function for simulating natural phenomena with the mean and standard deviations of (μMw.σMw) , (μD.σD) , and (μR.σR) ,respectively. To consider the dependency of output variables of the model to the injection rate, these parameters,for all of the variables (M W,D, andR), are considered as a function of injection rate and modeled using a linear Bayesian regression method.
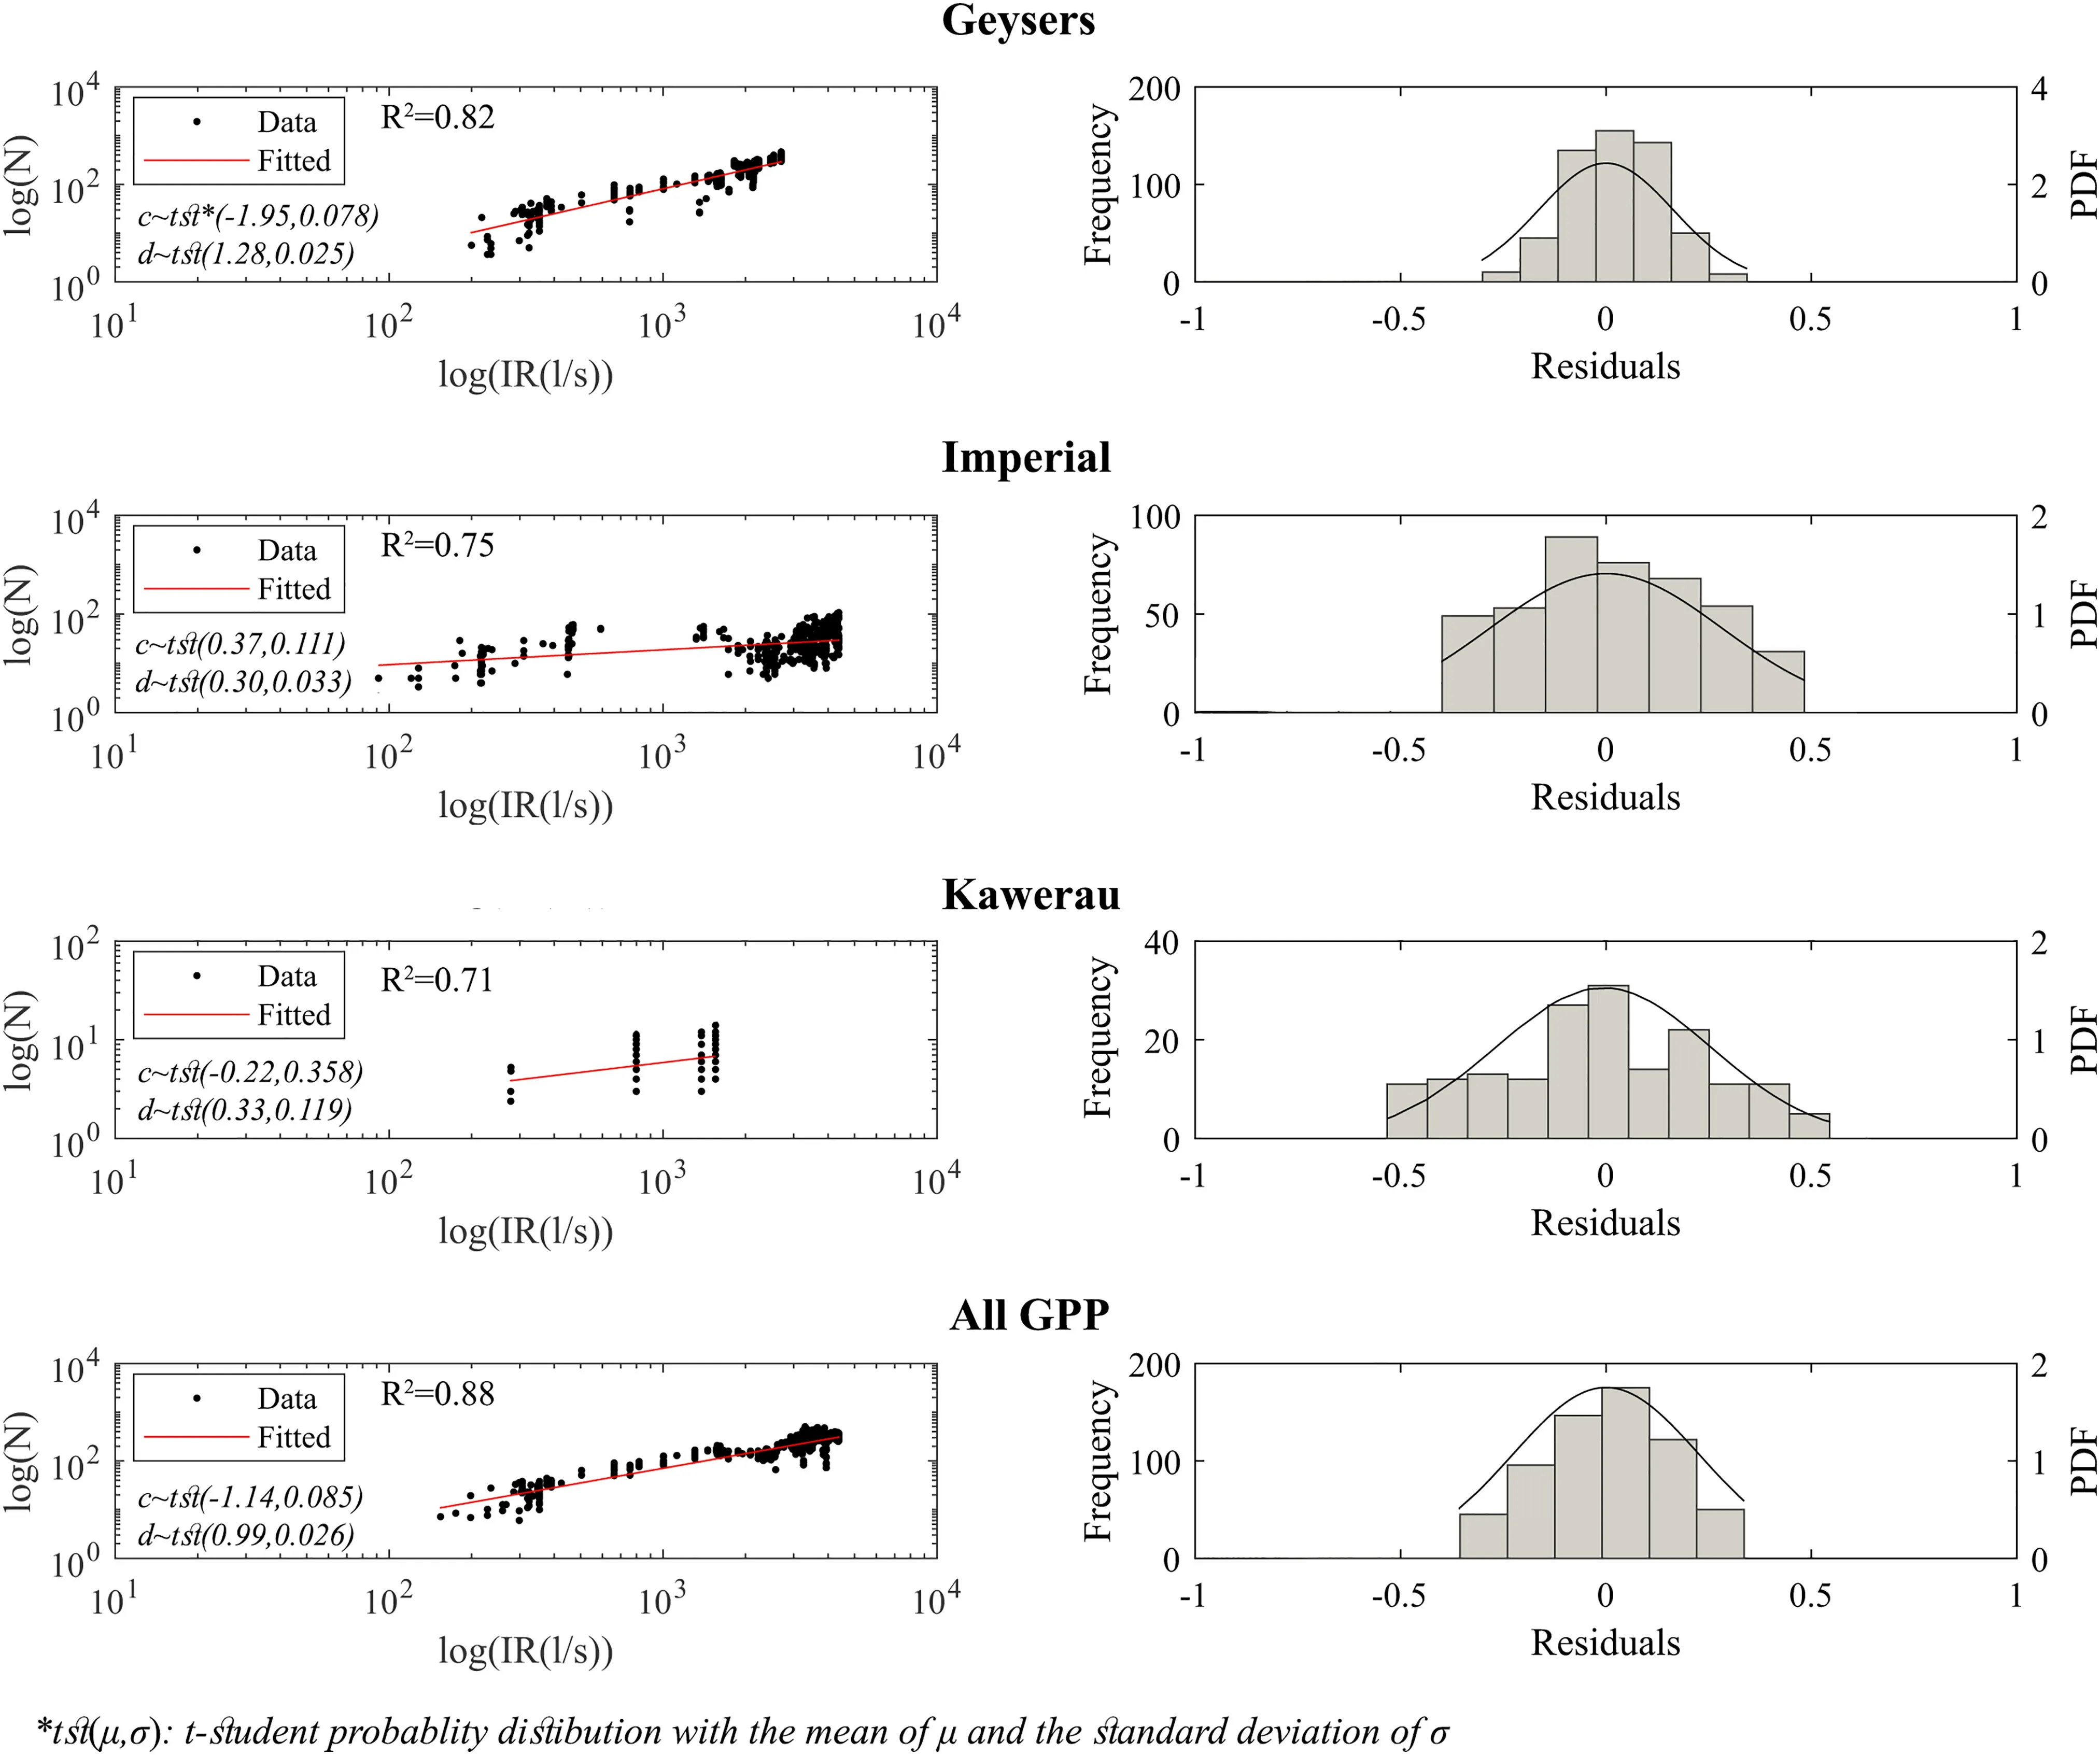
Fig. 7 The number of induced seismic events per month versus geothermal power plant (GPP) monthly injection rate (IR), as well as the frequency and probability distribution function (PDF) of the residuals of (2)
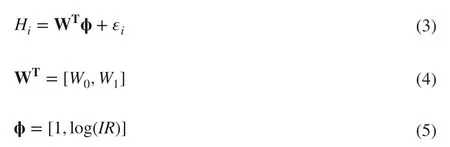
whereHis the outcome of the model,Iis an integer from 1 to 6 standing for outcome variables ofμ Mw, σMw,μ D, σD,μ R, and σR, respectively. W is the regression coeffi cients’probability distribution functions (PDFs) following thet-student distribution, and ϕ is the regressors of the model.ε iis theith parameter regression error, which is a random variable with zero mean and variance ofσ 2 .
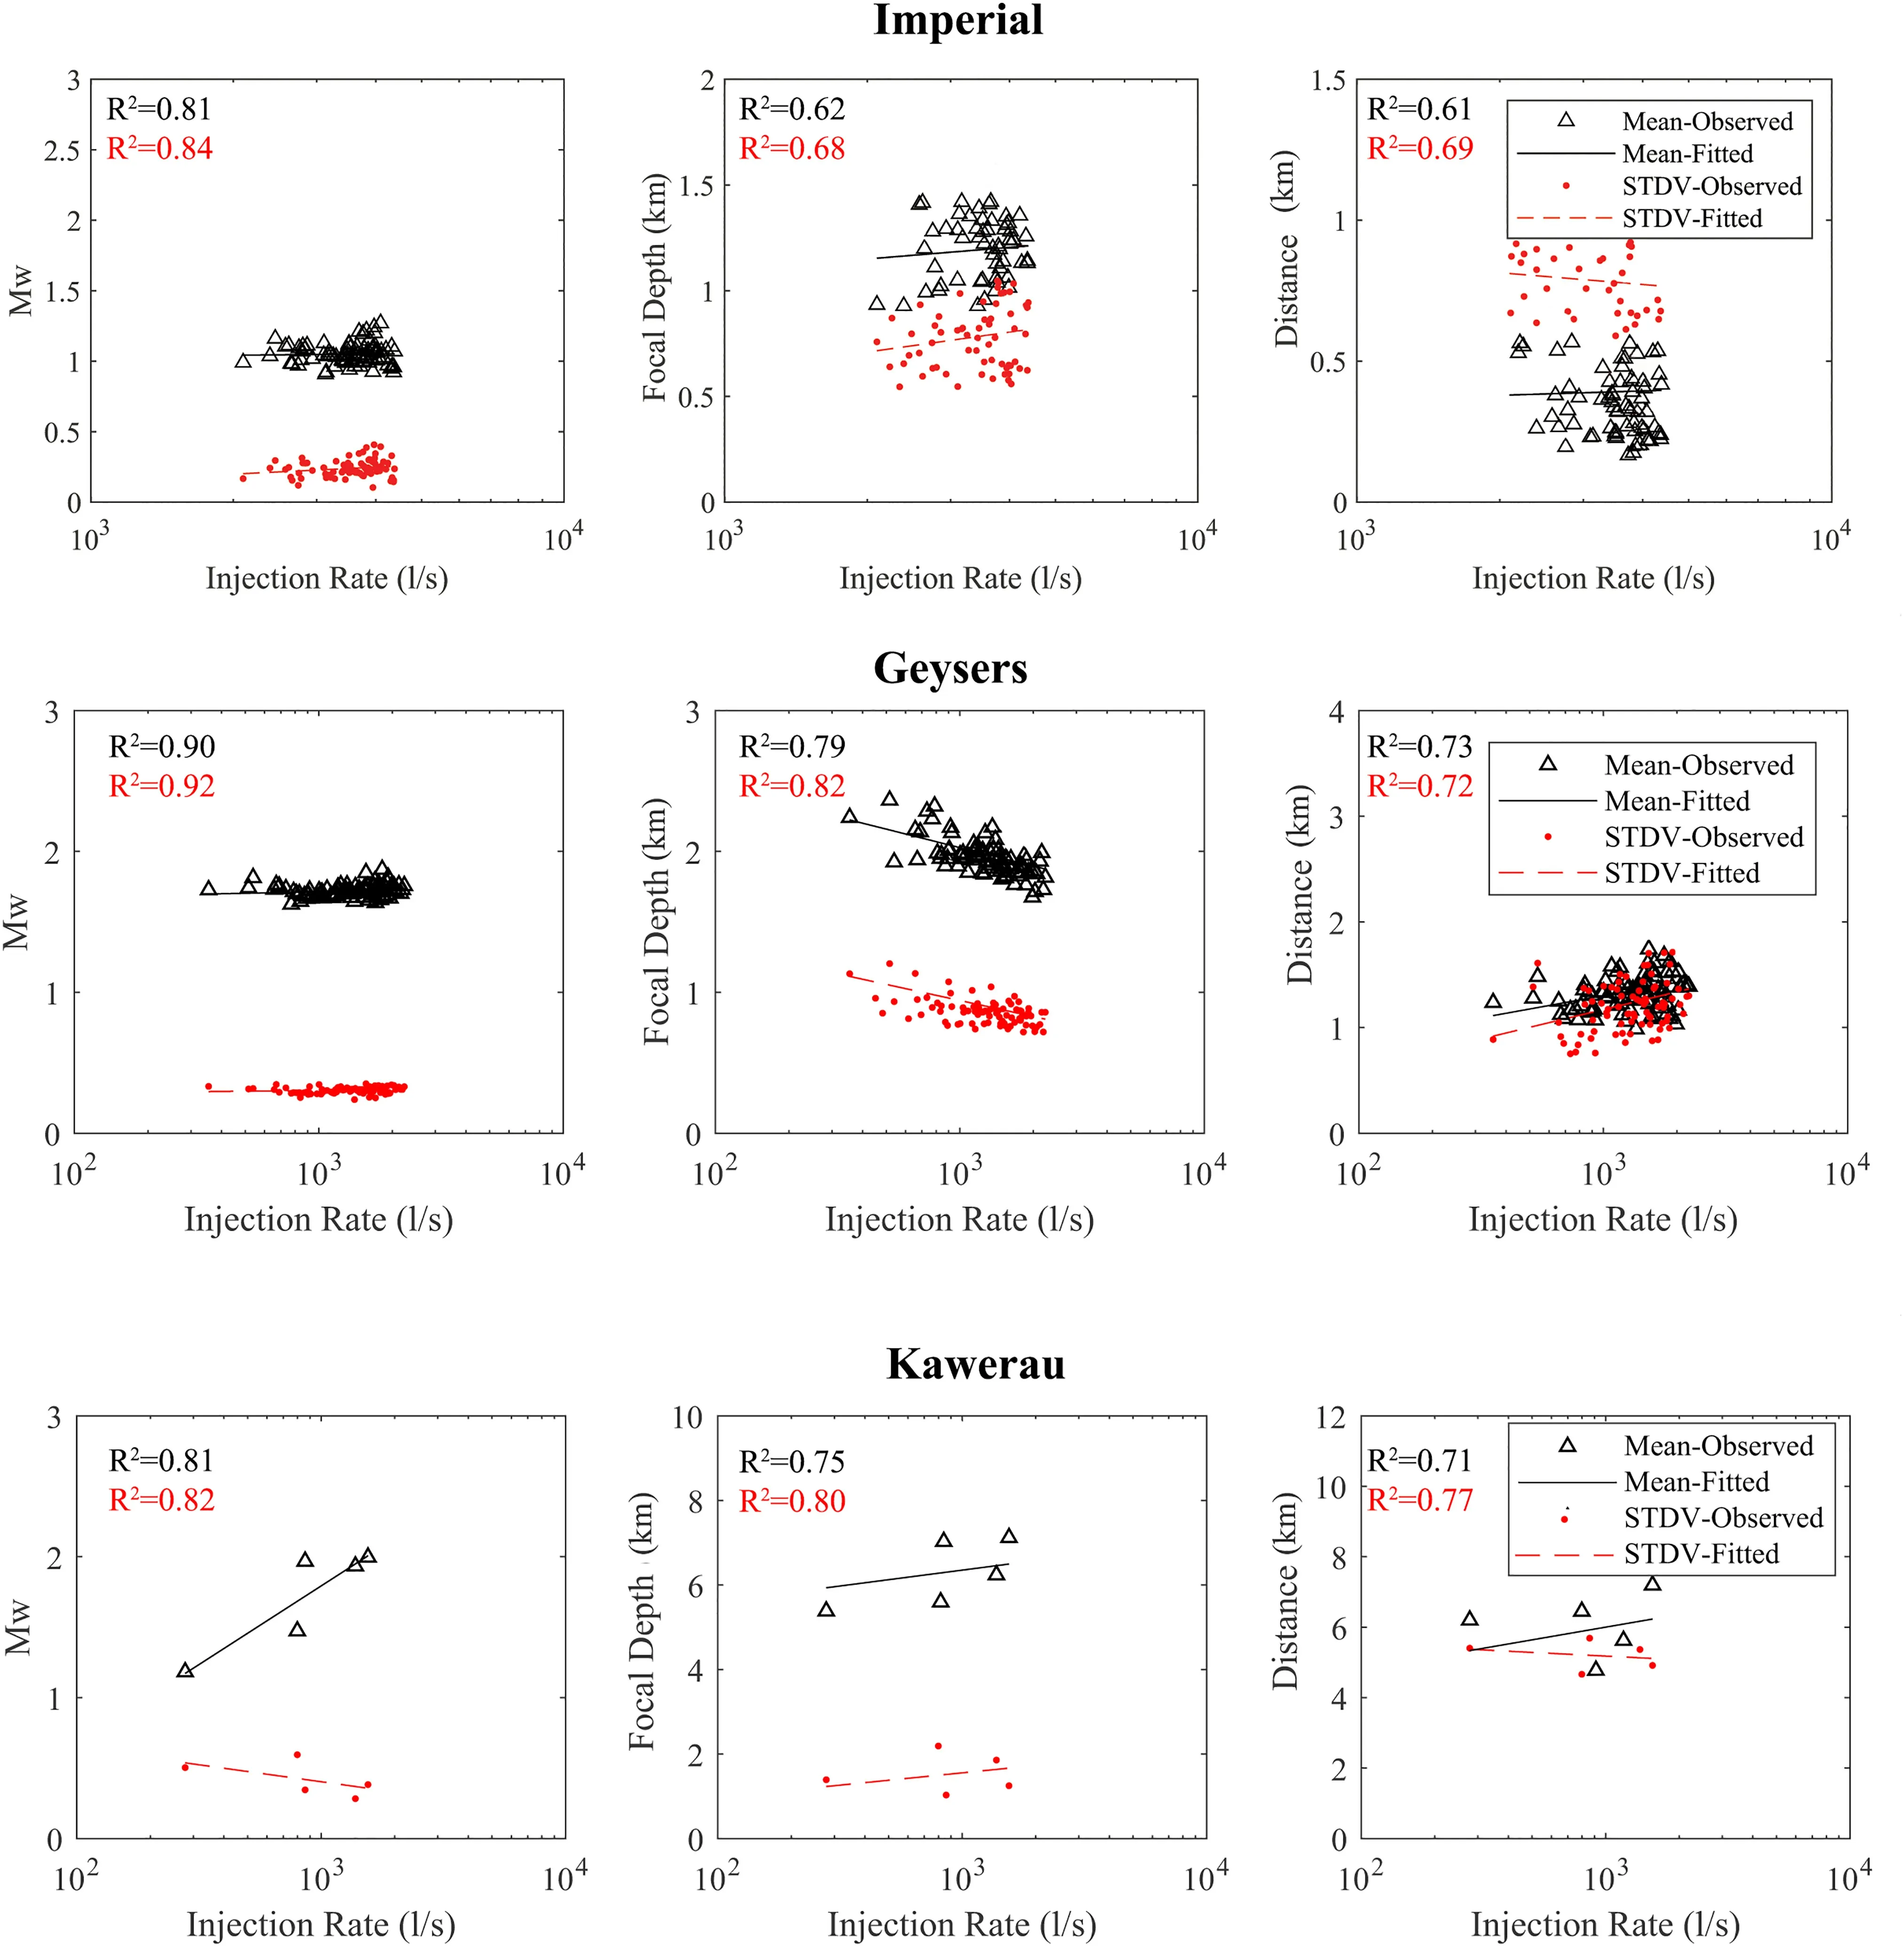
Fig. 8 Dependency of model variables ( M W , D, and R) to the geothermal power plant (GPP) injection rate for both observed data and simulating model at all GPPs
The proposed model is calibrated to the studied database. In Fig. 8, the dependency of mean and standard deviation values of all variables of the model are plotted against the GPPs injection rate. In most of the f itted models, the R 2 coeffi cients of regression correlation are in the suitable range, which implies the acceptable accuracy of the modeling approach. It is depicted that the simulating model follows the general trend of observed data. A very slight increase is seen in the mean value of moment magnitudes with the increase of injection rate for diff erent GPPs. This implies that the event magnitude is not signif icantly dependent on the injection rate. The mean values of distance between the event epicenters and GPP locations increase with the increase of injection rate, which means that the higher injection rate leads to a farther propagation of high-pressure water in the rock layers and fault activates in the far distance. In the case of focal depth, both increase and decrease are observable with the higher injection rates, which could be inferred as a sign that shows that focal depth is not a function of injection rate directly, and perhaps injection well depth and fault geometry are more important parameters. The obtained model parameters, that is, the mean and standard deviation of thet-student PDF of all regression coeffi cients, are reported in Table 6. The correlation coeffi cient and covariance matrices of model output variables are also shown in Table 6. The arrays of correlation matrix with values higher than 0.3 are bolded in this table. The mean value of focal depth and distance have a slight dependency on the moment magnitude withthe correlation coeffi cient varying from 0.34 to 0.36, while the focal depth and distance show a higher-level dependency on each other with a coeffi cient of around 0.5.

Table 6 Values of mean and standard deviation of t-student probability distribution function(PDF) of regression coeffi cients for all output variables of the model per geothermal power plant (GPP) station
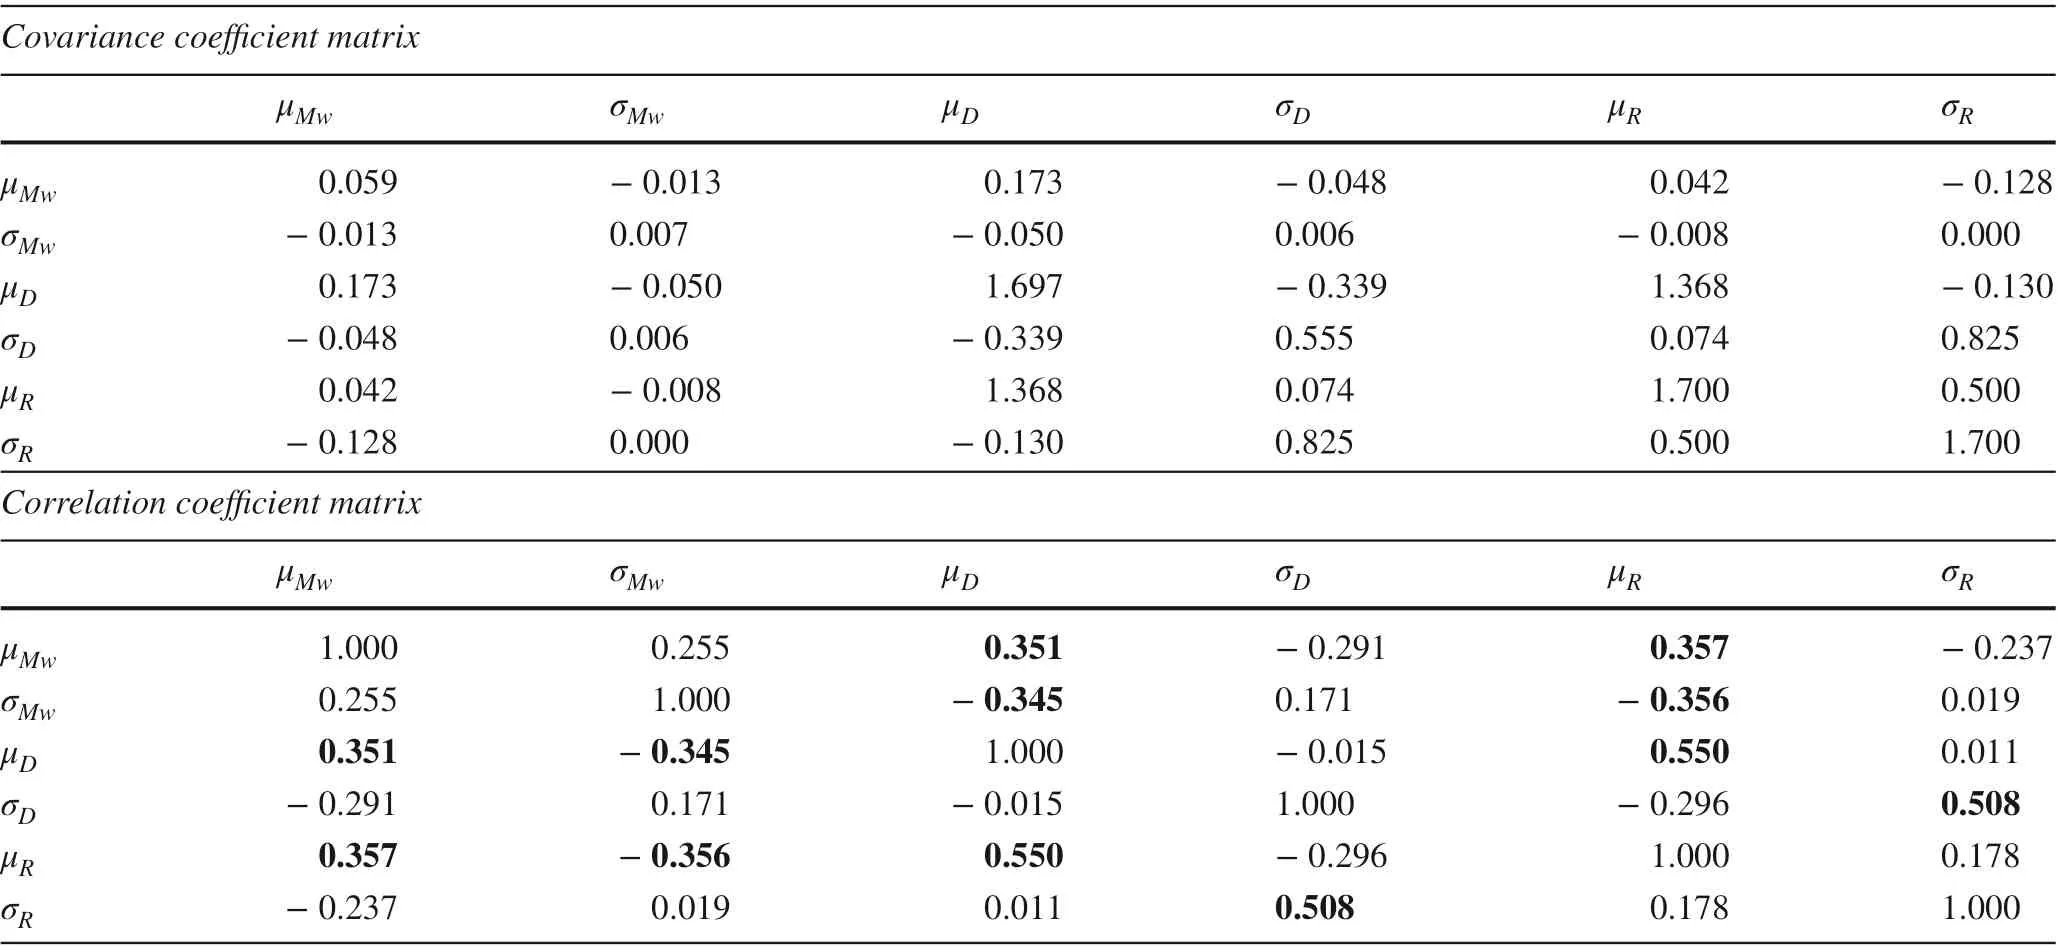
Table 7 Average covariance and correlation coeffi cient matrices of all output variables of the model for all stations
Table 7 shows that there are some levels of correlation between output parameters. To consider this correlation during the simulation process of random earthquakes, the mathematical methodology proposed by Marsaglia and Tsang ( 2000),and also used by Khansef id et al. ( 2019) to generate random correlated variables of earthquake accelerograms, is adopted in this study. Therefore, the random values of earthquake characteristics are generated by the following equation.
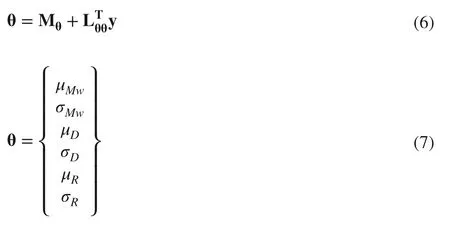
In the above equations, Mθis the mean value of parameters of lognormal distributions obtained via regression equation( 3) without consideringε. Lθθis a lower triangular matrix obtained by Cholesky decomposition of the covariance matrix of model parameters ( θ) proposed in Table 6, and y is a realization of uncorrelated standard normal random variables vector.

Fig. 9 Simulated versus observe values of the model outputs ( M w , R, and D) for 20% of test data of all geothermal power plant (GPP) zones

Fig. 10 Model outputs and observed data for selected months using the Monte Carlo sampling method for all geothermal power plants (GPPs)
5.2 Model Validation
One of the most important challenges in developing any model used for simulating natural phenomena is the model’s validation. The validity of our proposed model is examined via multiple approaches. In the first methodology,as described in the previous section, the model is used to simulate the remaining 20% of data as testing data, which were not used in the f itting processes. As shown in Fig. 9,the result of the simulation follows the overall trend of the observed data. Among diff erent outputs of the model,including moment magnitude, site-to-source distance, and focal depth of events, the f irst one shows the highest correlation coeffi cients (R 2 ) and, consequently, highest accuracy level, respectively.

Fig. 11 Results of bootstrap method for validating the accuracy of the proposed model to simulate the observed data
For more guarantee, another validation process is considered. In this approach, for each of the GPPs, during its operation period, some months are selected randomly, including the 3rd, 5th, and 11th months of years 2011, 2014, and 2018 to check the accuracy of the proposed model. The mean and standard deviation of observed data (M W,D, andR) in these months are calculated. Then by applying the model and the Monte Carlo sampling method concurrently, and considering diff erent numbers of samples in which 7, 25, 50, 100,150, 200, 300, and 500 events are regenerated, the mean and standard deviation values from all samples are calculated. In Fig. 10, the mean and standard deviation values of output variables of the model (M W,D, andR) are compared with the target values of real observed data for diff erent numbers of generated samples in the selected months. It is seen that among diff erent variables,M W,R, andDconverge faster, respectively. Generally, by generating more than 100 realizations, the Monte Carlo simulation results converge for all variables. In addition, the average error of simulated events for estimating the mean of moment magnitude, focal depth, and distance for all GPPs are 6.2%, 10.2%, and 13.4%,respectively, while these values for the standard deviation of variables are 27.2%, 18.5%, and 19.2%, respectively.

Fig. 12 Samples of simulated seismic hazard scenario per month due to the geothermal power plant (GPP) operation for diff erent ranges of injection rates
To achieve a higher reassurance level, the bootstrapping method (Efron and Tibshirani 1993 ) is adopted to validate the model. Accordingly, by using the Monte Carlo sampling approach, diff erent sets (500) of observed data are selected from the recorded events per month for all GPPs. In each of the 500 samples, recorded events at randomly selected months are considered, and the model is used to estimate the target values (mean and standard deviation of parametersM W,D, andRfor all events in a month) via the procedure that was described in the previous paragraph. The results,shown in Fig. 11, emphasize the acceptable accuracy of modeled events. Almost all of the estimated parameters are located in the range of mean ± standard deviation of the observed data, except a few data of focal depth and distance in Kawerau and Imperial GPPs. It is noteworthy that the proposed model is developed for the purpose of seismic risk assessment of buildings and structures via sampling methods such as Monte Carlo. In this case of seismic loss evaluation,the error of 0.1 to 0.3 in estimating the magnitude, or 1−2 km in estimating the distance of epicenter-to-GPP will not have a signif icant eff ect on seismic risk assessment results,which is shown in previous studies (Khansef id 2018, 2021).That is, the accuracy of the presented model is within the acceptable range.
As an example of the application of the proposed model for diff erent ranges of injection rates by use of the Monte Carlo simulation approach (Hahn 1972), more than 18,000 scenarios of GPP-induced earthquake events are simulated and presented in Fig. 12. Each scenario contains all probable events per month. Accordingly, the number of events per month for each scenario, the corresponding moment magnitude, focal depth, and epicenter-to-GPP distances are shown. The moment magnitudes range between 1.5 to 3.0, the focal depths vary from 1.5 to 3.0 km, and the distances start from 3.0 km and go up to 12 km, which are all in the practical and probable range of GPP earthquakes.Such a simulation can be used as an input for the seismic risk assessment of buildings located near the GPP sites as a hazard input scenario.
6 Conclusion
This research dealt with the important challenge posed by induced seismicity initiated at geothermal power plants around the world. Accordingly, power plant information and the corresponding seismic data related to four important GPP zones worldwide were collected. These data are statistically analyzed, and their main characteristics, consisting of event magnitude, focal depth, and epicenter-to-GPP distance, are rigorously examined. From an engineering perspective, a probabilistic model was developed and validated that is capable of simulating random seismic events induced by GPPs. This model is a tool in the hand of the earthquake and structural engineers and scientists who are interested in evaluating the seismic risk of induced earthquakes by GPPs on the built environment via sampling methods such as Monte Carlo since it provides the opportunity to simulate future probable earthquake event scenarios.
AcknowledgmentsThe authors express their sincere gratitude to the TUM Talent Factory division of the Technical University of München for its support by providing a TUM University Foundation Fellowship for Dr. Ali Khansef id.
Open AccessThis article is licensed under a Creative Commons Attribution 4.0 International License, which permits use, sharing, adaptation, distribution and reproduction in any medium or format, as long as you give appropriate credit to the original author(s) and the source,provide a link to the Creative Commons licence, and indicate if changes were made. The images or other third party material in this article are included in the article’s Creative Commons licence, unless indicated otherwise in a credit line to the material. If material is not included in the article’s Creative Commons licence and your intended use is not permitted by statutory regulation or exceeds the permitted use, you will need to obtain permission directly from the copyright holder. To view a copy of this licence, visit http:// creat iveco mmons. org/ licen ses/ by/4. 0/.
杂志排行

International Journal of Disaster Risk Science的其它文章
- Sendai Framework’s Global Targets A and B: Opinions from the Global Platform for Disaster Risk Reduction’s Ignite Stage 2019
- Perceptions About Climate Change in the Brazilian Civil Defense Sector
- Is Being Funny a Useful Policy? How Local Governments’Humorous Crisis Response Strategies and Crisis Responsibilities Inf luence Trust, Emotions, and Behavioral Intentions
- The Eff ect of Natural Hazard Damage on Manufacturing Value Added and the Impact of Spatiotemporal Data Variations on the Results
- Understanding Farmers’ Preferences Towards Insurance Schemes that Promote Biosecurity Best Management Practices
- Institutional Capacity and the Roles of Key Actors in Fire Disaster Risk Reduction: The Case of Ibadan, Nigeria