Electromagnetic Transmission Characteristics of Y-Shaped and Y-Ring-Shaped Frequency Selective Fabrics
2022-12-10GUANFuwang关福旺LIDanYANGZhuli杨竹丽QIUYiping邱夷平
GUAN Fuwang(关福旺), LI Dan (李 丹), YANG Zhuli(杨竹丽), QIU Yiping(邱夷平), 3
1 College of Textiles and Apparel, Quanzhou Normal University, Quanzhou 362000, China
2 Key Laboratory of Clothing Materials of Universities in Fujian(Quanzhou Normal University), Quanzhou 362000, China
3 College of Textiles, Donghua University, Shanghai 201620, China
Abstract: Asymmetrical Y-shaped and Y-ring-shaped frequency selective fabrics (FSFs) were proposed in this paper. They were prepared by computer engraving technology and tested in the anechoic chamber by using the free-space method. The test results of representative samples show that the resonance frequencies and the resonance peak or valley values in two polarization modes are not completely identical but the differentials are small, indicating that the influences of polarization modes are not significant. The transmission coefficient curves of Y-shaped and Y-ring-shaped FSFs with various size parameters are obviously different. For instance, as the unit size D increases by 4.0 mm, the resonance frequencies of patch FSFs decrease by 1.92 GHz and the resonance valleys increase by 12.32 dB. Different size parameters have dissimilar effects on the transmission characteristics and the corresponding influence laws should be analyzed concretely. The work could provide reference for the structural design and characteristics analysis of other FSFs.
Key words: electromagnetic transmission; frequency selective fabric (FSF); computer engraving technology; transmission coefficient; anechoic chamber
Introduction
Frequency selective surfaces (FSSs) are periodic arrays composed of metal patches or apertures within a metallic screen, respectively showing the band-stop or band-pass characteristics[1]. FSSs have been systematically studied over the last decades and they can be widely used in various products, such as radar radome, special shielding clothing, and intelligent wearable products[2-4]. At present, the research work mainly focuses on the development of new structures (including complex patterns, multi-layer FSSs as well as three-dimensional structures[5-7]), the design of new characteristics (such as broadband absorption, narrow-frequency filtering, and multi-resonance characteristics[8-10]), and the structure and characteristics analysis of curved, tunable and active FSSs[11-13]. The existing products are mostly rigid plates or soft membrane materials, and the processing methods are mainly concentrated in laser engraving, chemical coating, vacuum coating,etc. Porous, flexible and lightweight textiles and processing methods are rarely involved[14-15].
Based on the research foundation of FSSs, theoretical feasibility, preparation convenience and potential application advantages of frequency selective fabrics (FSFs) have been analyzed and some research progress has been made in recent years[16-19]. Our research group has successively designed and prepared FSFs with various conductive patterns such as cross-shaped, Jerusalem-shaped, and square-ring patterns, and the frequency selective characteristics have been systematically tested and analyzed[19-24]. However, it is worth noting that the above conductive units are centrosymmetric, namely they would overlap after 180° rotation. The electromagnetic transmission characteristics of such units could be predicted to a certain extent. For instance, the polarization mode would exert little influences due to the ideal symmetry. Therefore, other FSFs with less symmetrical conductive units should be separately investigated.
According to Refs. [25-27], Y-shaped and Y-ring-shaped FSFs are very popular structures. Many research works have been carried out, and some basic conclusions have been made, which could help to design FSFs. However, due to the introduction of flexible and porous base fabrics, the electromagnetic transmission characteristics of FSFs would be certainly affected and should be systematically studied. In this paper, Y-shaped and Y-ring-shaped FSFs are designed by the electromagnetic simulation methods[28]. Then the FSFs are prepared by computer engraving technology, and the electromagnetic transmission characteristics are tested by using the free-space method. By comparatively analyzing the test results of FSFs with two complementary structures and different size parameters in two polarization modes, the design validity is verified and the effects of various parameters on frequency selective characteristics are explored. The research work could provide technical support for the preparation of FSFs and have reference value for exploring the characteristics of FSFs.
1 Experiments
1.1 Sample design
In this paper, Y-shaped and Y-ring-shaped FSFs were proposed. Based on the previous research work, the empirical formula and the electromagnetic simulation method were used for optimization design[24]. The schematics of Y-shaped and Y-ring-shaped FSFs are shown in Figs. 1(a), 1(b), 2(a), and 2(b). The corresponding unit size parameters are respectively shown in Figs. 1(c) and 2(c). By increasing or decreasing the values of unit size parameters, seven groups of Y-shaped FSFs and three groups of Y-ring-shaped FSFs were designed for comparison. Each group includes patch and aperture FSFs. The unit size parameters of Y-shaped and Y-ring-shaped FSFs are respectively listed in Tables 1 and 2.

Table 1 Unit size parameters of Y-shaped FSFs
It is noteworthy that each sample in Tables 1 and 2 contains two FSFs specimens. For instance, 1A# and 1B# respectively refer to the patch and the aperture FSFs. Therefore, there are twenty samples in total.
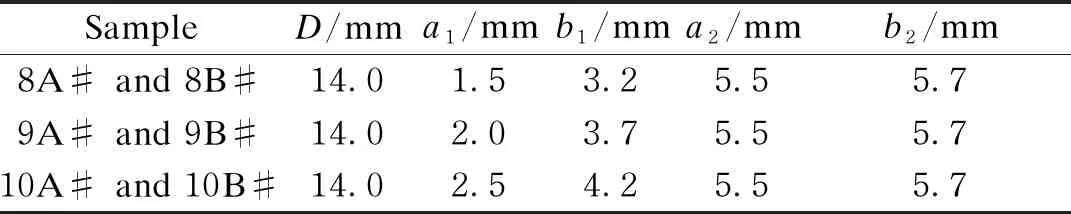
Table 2 Unit size parameters of Y-ring-shaped FSFs
1.2 Sample preparation and testing process
The FSF samples were prepared by computer engraving technology and the preparation process was described detailly in Ref.[20]. The cotton warp backed weave fabric with a thickness of 0.8 mm was adopted for the dielectric layer, and warp and weft yarn densities were 110 end/(10 cm) and 280 pick/(10 cm), respectively. The aluminum foil with a thickness of 0.08 mm and square resistance of 3.62×10⁻⁴Ω was selected to form the conductive FSS layer. The GRAPHTEC CE6000-60 engraving machine(Japan) was driven by Wentai engraving software to periodically cut the fabric-based composites, and the operating parameters, such as tool pressures and speeds, were repeatedly adjusted to prepare the ideal sample with relatively smooth conductive patterns without obvious damage.
The electromagnetic transmission characteristics were tested in the anechoic chamber by using the free-space method. The calibration process must be completed prior to the formal experiment to ensure that the center lines of the two antennas and the testing board are overlapped. The test was respectively carried out with and without the sample in the testing board, and the differential value between the two testing results is the authentic data of the sample. Specific testing principle and process were introduced in detail in Ref.[19]. By adjusting the position of the horn antenna and the absorbing wall, the electromagnetic transmission characteristics of samples in different polarization modes could be tested. Figures 3(a) and 3(b) show the preparation and test of Y-shaped FSF samples.
2 Results and Discussion
2.1 Electromagnetic transmission characteristics of Y-shaped FSFs
2.1.1PolarizationmodeofY-shapedFSFs
To study the influence of the polarization mode, the prepared FSFs were respectively tested in transverse electrical (TE) and transverse magnetic (TM) modes, which mean that the electric vector is respectively perpendicular and parallel to the incident plane. Samples 1A# and 1B# are taken as examples to analyze the testing results, and the transmission coefficient curves in two polarization modes are shown in Fig. 4.
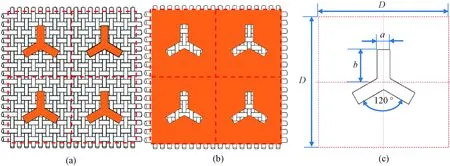
Fig. 1 Schematics of Y-shaped FSFs and unit size parameters: (a) patch FSF; (b) aperture FSF; (c) unit size parameters
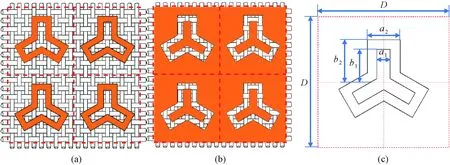
Fig. 2 Schematics of Y-ring-shaped FSFs and unit size parameters: (a) patch FSF; (b) aperture FSF; (c) unit size parameters

Fig. 3 Preparation and test of Y-shaped FSF samples: (a) sample preparation; (b) sample test
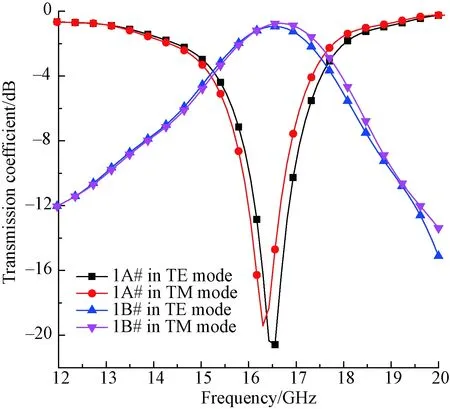
Fig. 4 Transmission coefficient curves of samples 1A# and 1B# in two polarization modes
In Fig. 4, the transmission coefficient curves of samples 1A# and 1B# have obvious resonance valleys or peaks, showing band-stop or band-pass characteristics, which verifies the validity of design process. For the patch FSF, the resonance frequencies are respectively 16.56 GHz and 16.31 GHz in two polarization modes, with the valleys reaching -20.59 dB and -19.41 dB, and -10.00 dB bandwidths are 0.89 GHz and 0.77 GHz, with the difference of 0.12 GHz. For the aperture FSF, the resonance frequencies are respectively 16.56 GHz and 16.68 GHz in two polarization modes, with the peak values reaching -0.93 dB and -0.74 dB, and -3.00 dB bandwidths are 1.91 GHz and 2.17 GHz, with the difference of 0.26 GHz. The transmission coefficient curves in TE and TM modes have a high coincide degree, but there still are slight differences, which can be ascribed to the non-axisymmetry of the conductive units. The above results prove that the polarization mode exerts a certain influence but it is small. The testing results in the TE mode are chosen for subsequent analysis.

Fig. 5 Transmission coefficient curves of Y-shaped FSFs with different a values: (a) patch FSFs; (b) aperture FSFs
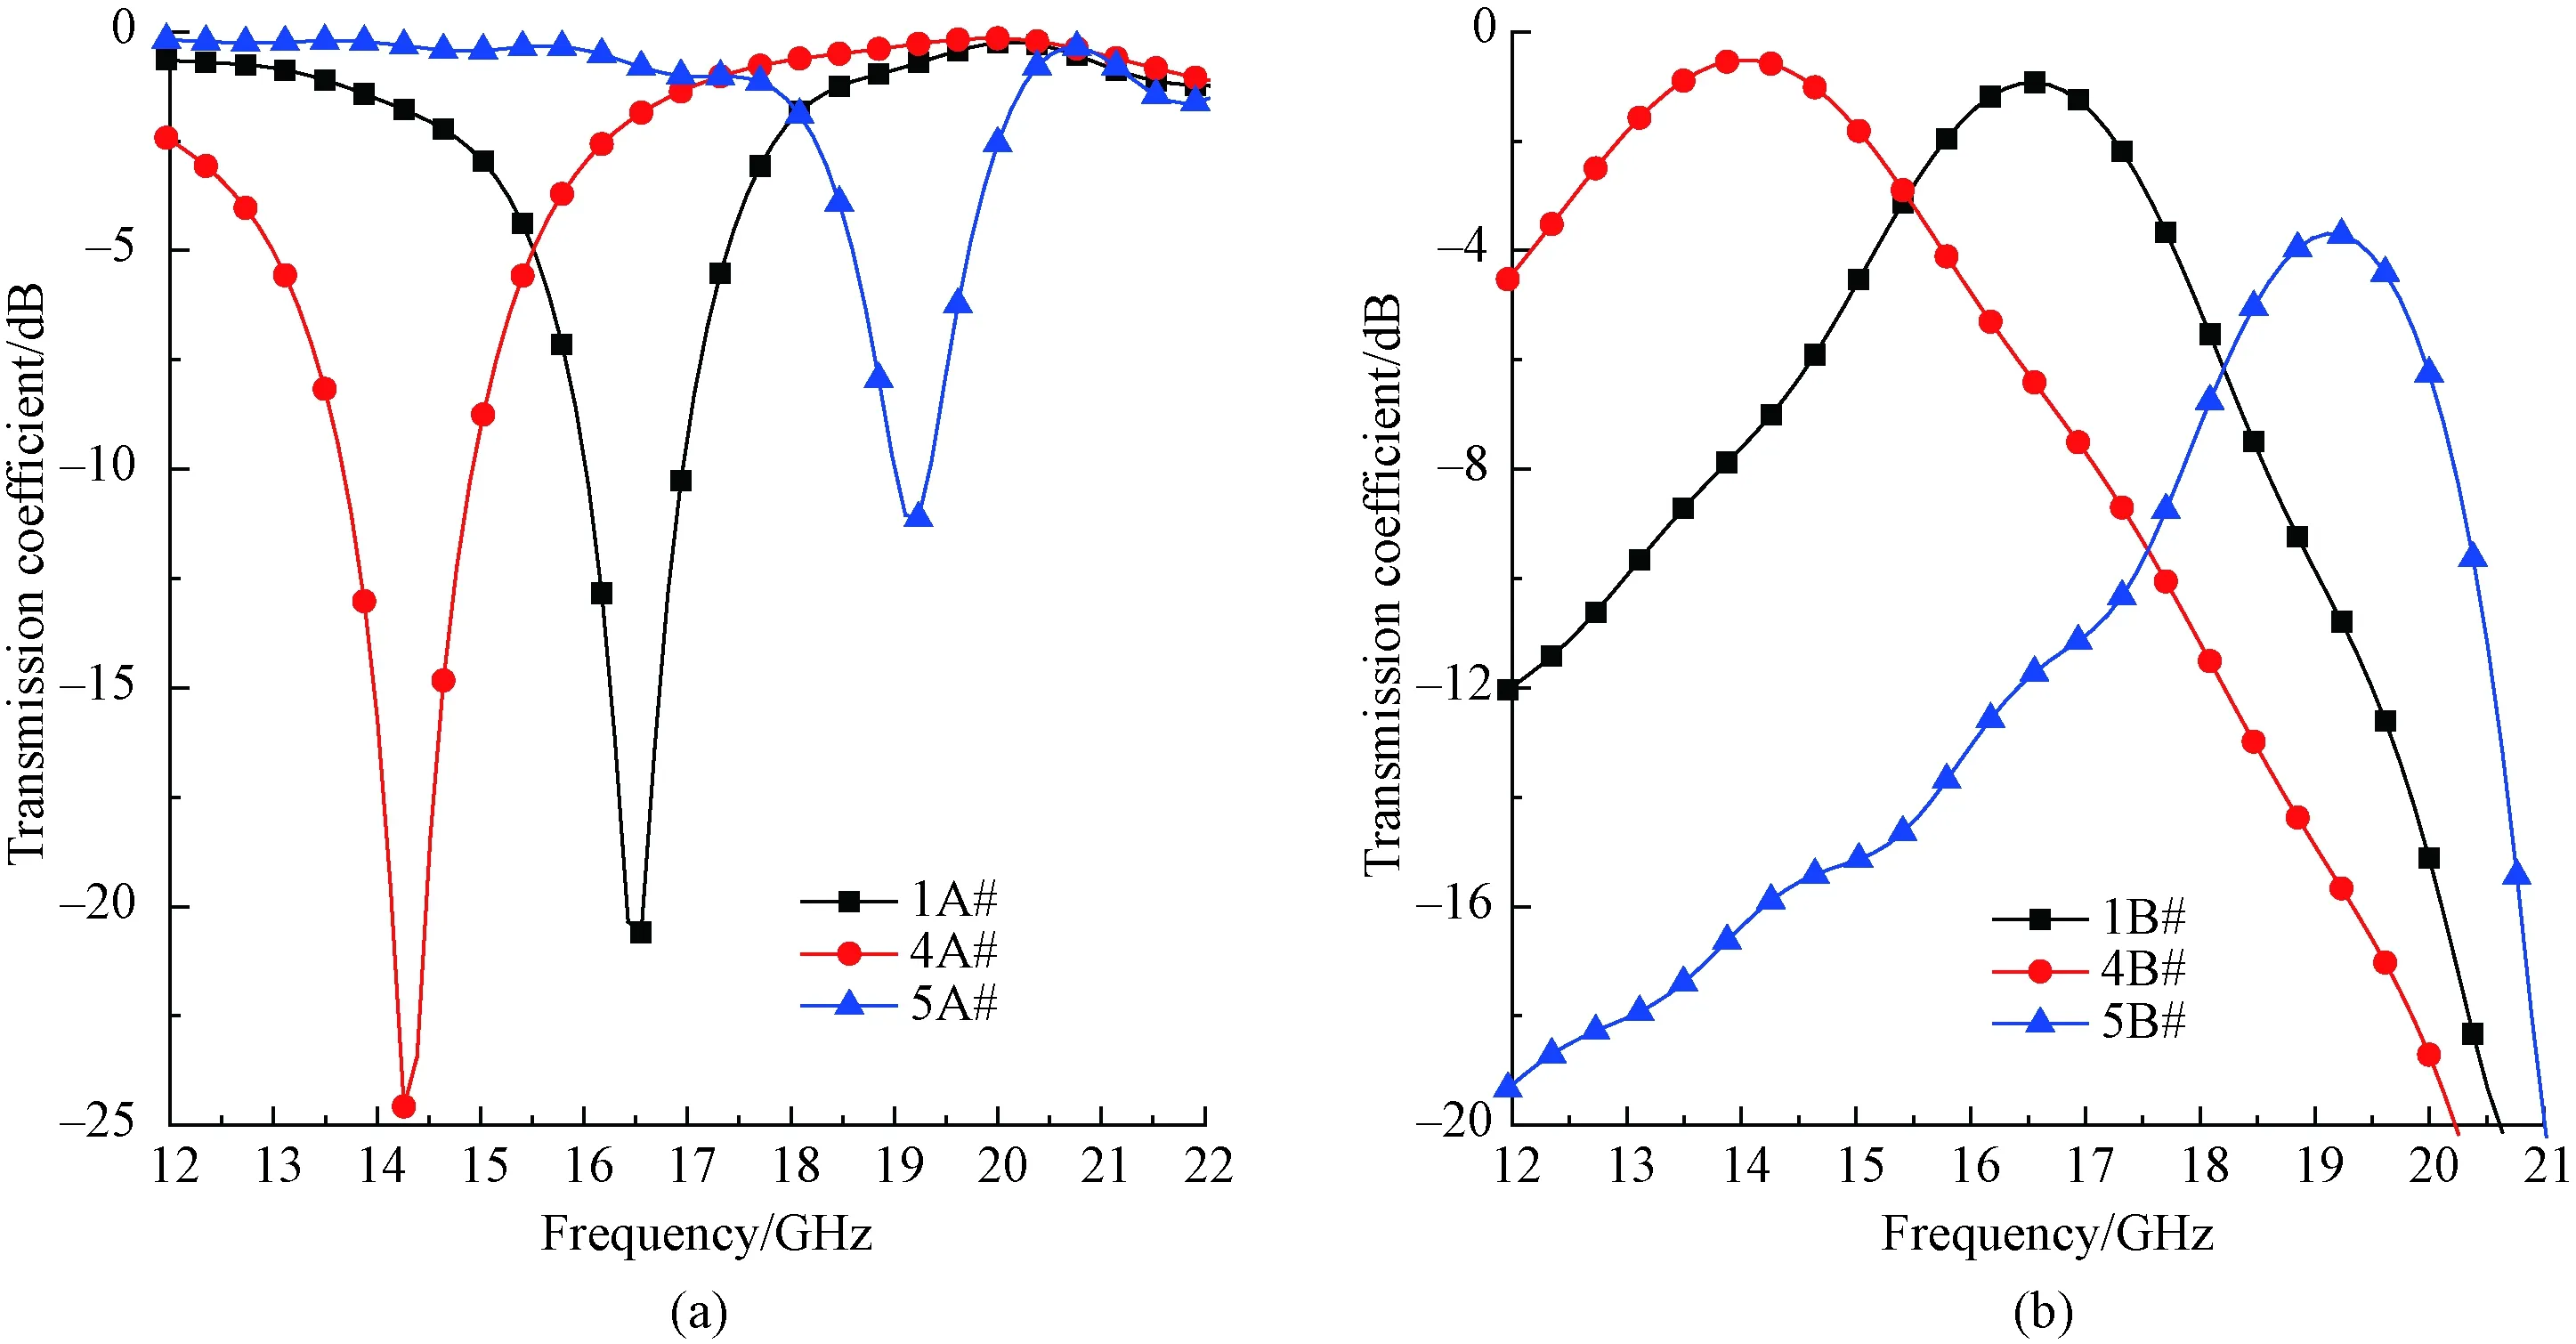
Fig. 6 Transmission coefficient curves of Y-shaped FSFs with different b values: (a) patch FSFs; (b) aperture FSFs

Fig. 7 Transmission coefficient curves of Y-shaped FSFs with different D values: (a) patch FSFs; (b) aperture FSFs
2.1.2UnitsizeofY-shapedFSFs
The electromagnetic transmission characteristics of Y-shaped FSFs with different unit size parameters were tested and deeply analyzed. By comparing the characteristics differences of different FSFs, the influences of parametersa,b, andDcould be explored. The transmission coefficient curves of Y-shaped FSFs with differenta,b, andDvalues are separately shown in Figs. 5-7.
Figure 5 shows that with the increase ofa, the transmission coefficient curves move to a higher frequency region. The valley values of patch FSFs decrease gradually, while the peak values of aperture FSFs increase progressively. Figure 6 shows that asbincreases, the transmission coefficient curves move to a lower frequency region, different from the variation trend in Fig. 5. Figure 7 shows that the change ofDwould exert remarkable influences on the transmission coefficients and the influence rules are identical for patch and aperture FSFs. AsDincreases, the transmission coefficient curves move to a lower frequency region, but the frequency selective characteristics become less ideal. To quantitatively analyze the influences of unit size parameters, characteristic indices including the resonance frequency and the resonance peak or valley, are extracted and shown in Fig. 8.

Fig. 8 Effects of unit size parameters on characteristic indices: (a) resonance frequency of patch FSFs; (b) resonance frequency of aperture FSFs; (c) resonance valley of patch FSFs; (d) resonance peak of aperture FSFs
Figures 8(a) and 8(b) show that the effects of unit size parameters on the resonance frequency are similar for patch and aperture FSFs. On the whole, the unit size parameterahas a positive effect. As the value ofaincreases, the resonance frequency also increases. But the influences of unit size parametersbandDare opposite. According to the results, the variation ofbhas the most significant influence and the resonance frequency decreases by about 5 GHz as the value ofbincreases by 2.0 mm. Figures 8(c) and 8(d) show that for patch and aperture FSFs, the influences of unit size parameters on the resonance valley or peak values are different. However, their frequency selective performance is becoming worse, which can be attributed to the variation of equivalent capacitance and inductance values caused by the change ofD. For patch FSFs,aandbhave negative effects and the influence ofDis positive. It is noteworthy in Fig. 8(c) that the effect ofbis the most remarkable. The influences of size parameters of aperture FSFs are contrary to those of patch FSFs and it seems that the variation trends in Fig. 8(d) are obviously nonlinear, different from the curves in Figs. 8(a) and 8(b).
2.2 Electromagnetic transmission characteristics of Y-ring-shaped FSFs
2.2.1PolarizationmodeofY-ring-shapedFSFs
Based on the study of Y-shaped FSFs, Y-ring-shaped FSFs with different unit size parameters were tested systematically and the electromagnetic transmission characteristics were analyzed deeply. Samples 8A# and 8B# are selected to analyze the influence of polarization modes, and the transmission coefficient curves in TE and TM modes are shown in Fig. 9.

Fig. 9 Transmission coefficient curves of samples 8A# and 8B# in two polarization modes
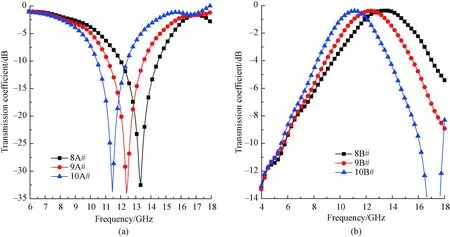
Fig. 10 Transmission coefficient curves of Y-ring-shaped FSFs with different unit size parameters: (a) patch FSFs; (b) aperture FSFs
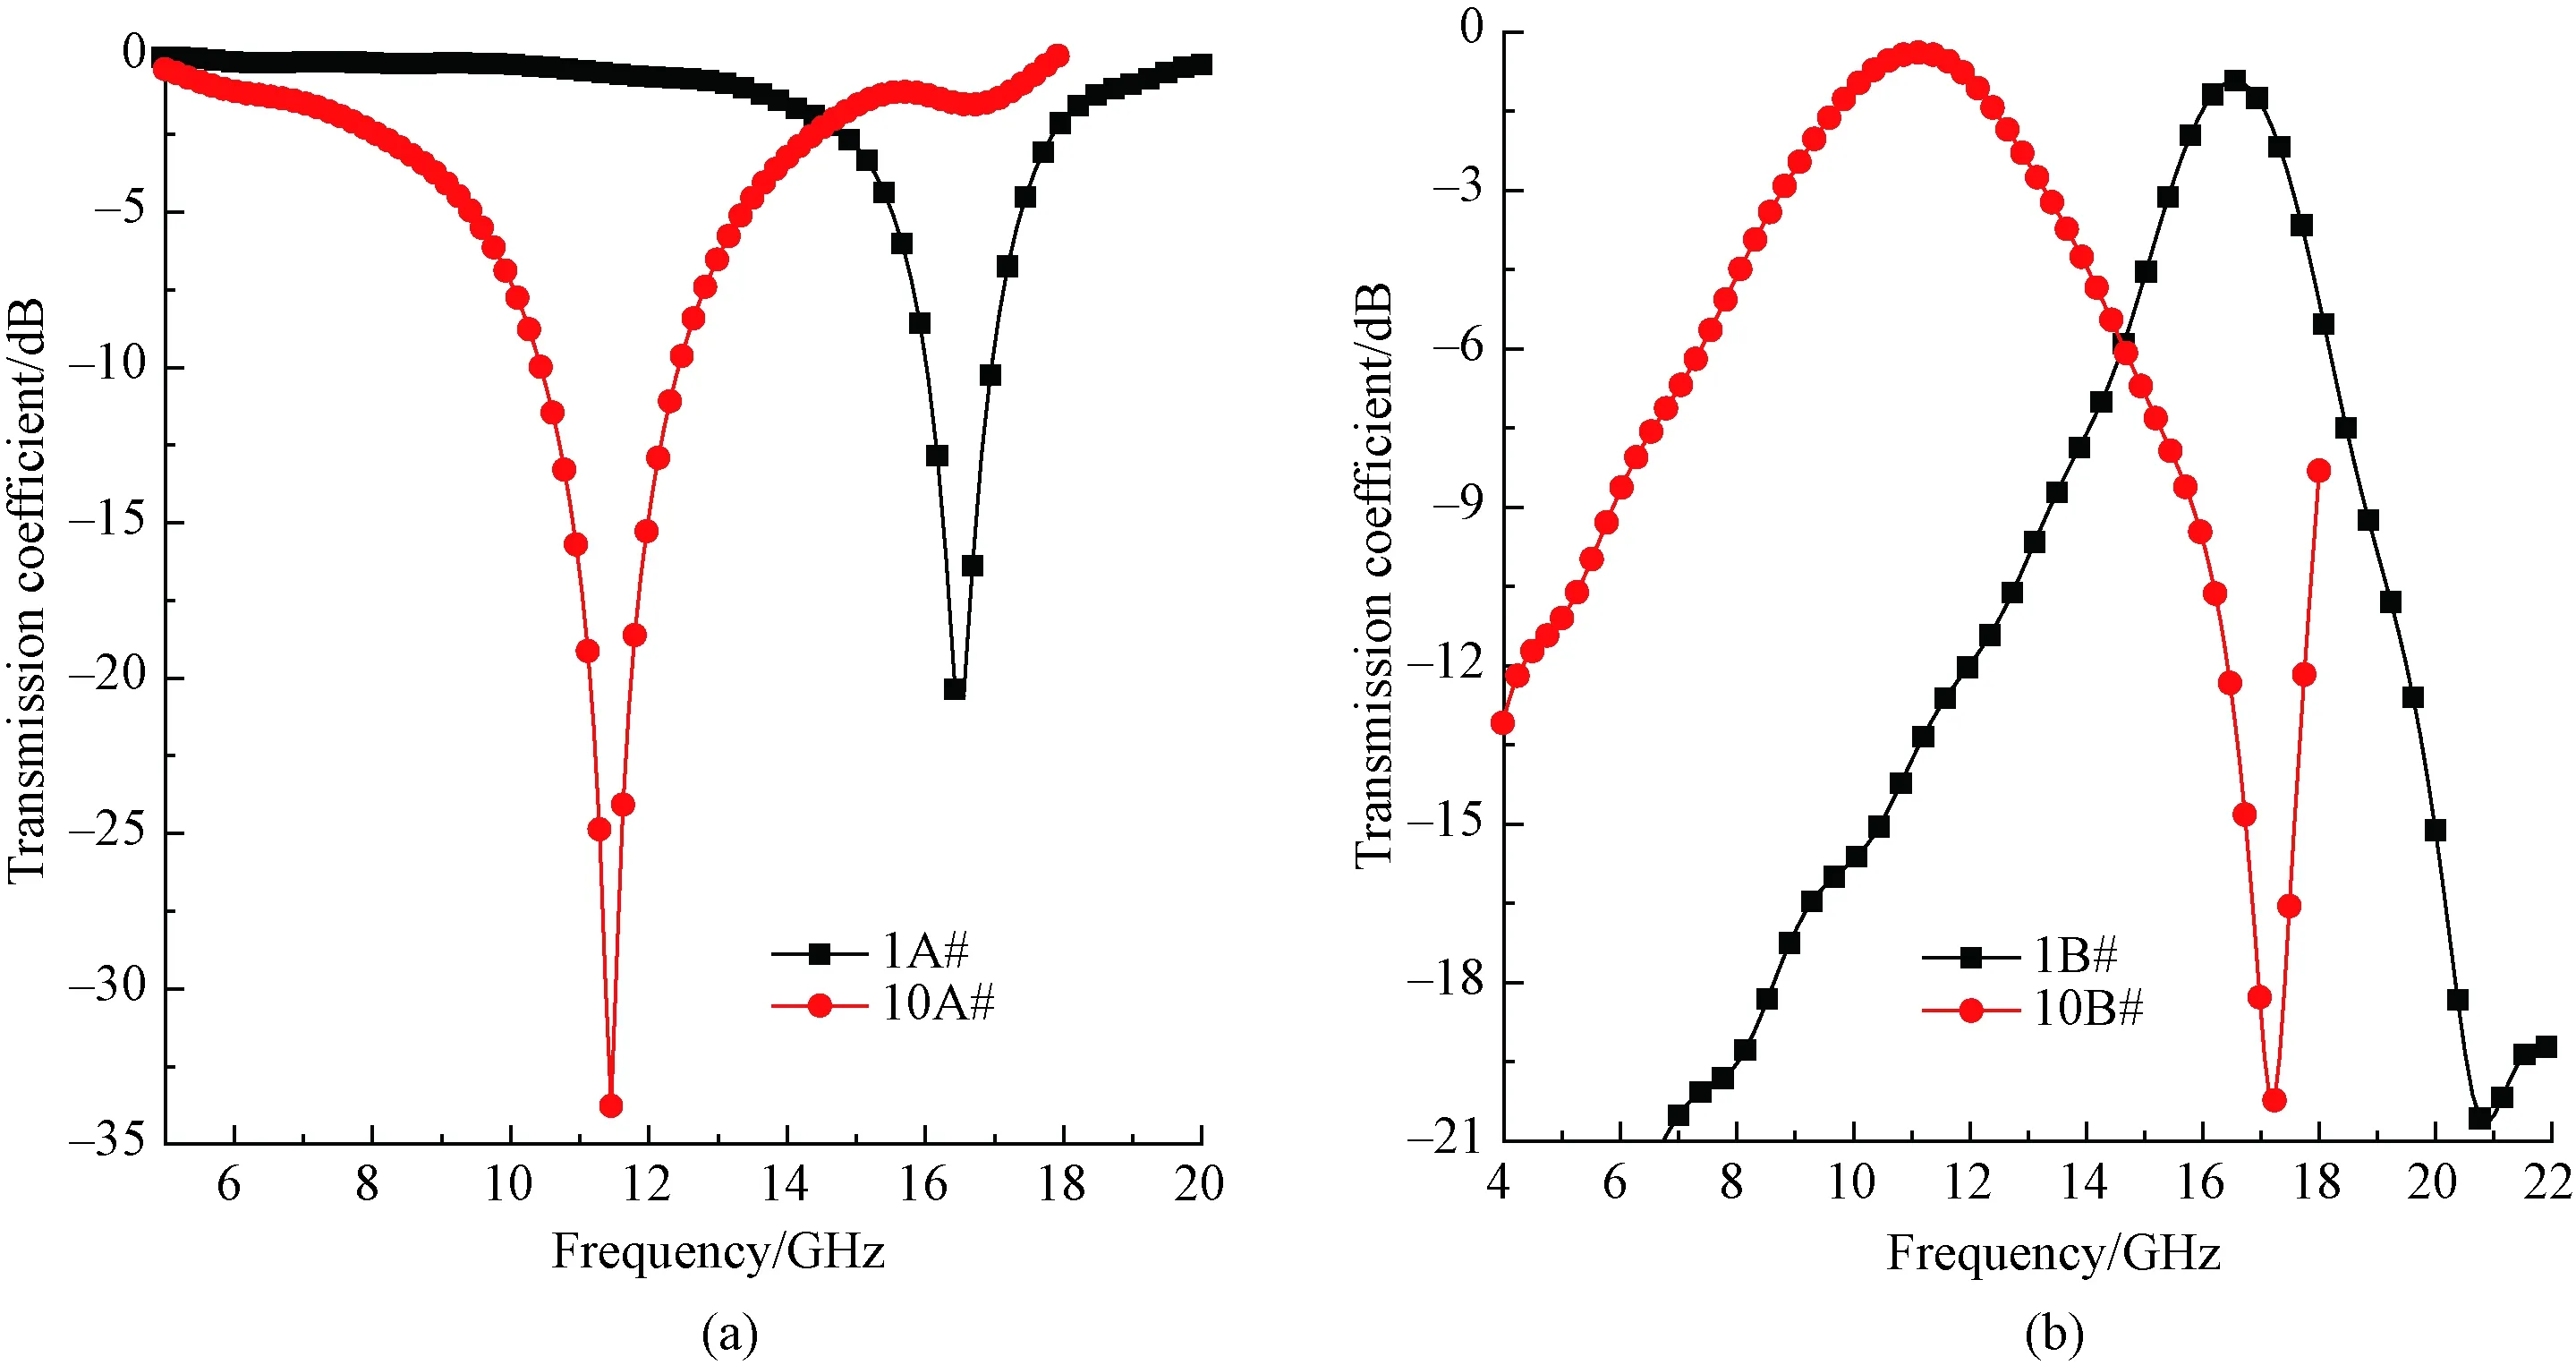
Fig. 11 Comparison of transmission coefficient curves of Y-shaped and Y-ring-shaped FSFs: (a) patch FSFs; (b) aperture FSFs
Figure 9 shows that patch and aperture FSFs respectively exhibit ideal band-stop and band-pass characteristics, proving the validity of the design process.
On the whole, the transmission coefficient curves in two polarization modes are similar but not completely identical. For the patch FSF tested in TE and TM modes, the resonance frequencies respectively appear at 13.33 GHz and 13.92 GHz, with transmission coefficients of resonance valleys reaching -32.53 dB and -38.02 dB, and -10.00 dB bandwidths are separately 2.38 GHz and 2.64 GHz. For the aperture FSF, the resonance frequencies are 13.50 GHz and 12.90 GHz, with transmission coefficients of resonance peaks reaching -0.37 dB and -0.19 dB, and the -0.50 dB bandwidths are separately 1.36 GHz and 1.87 GHz.
2.2.2UnitsizeofY-ring-shapedFSFs
By keeping the outer diametersa2andb2of Y-ring constant and changing the inner diametersa1andb1of Y-ring, six Y-ring-shaped FSFs were designed and prepared. By analyzing their electromagnetic transmission characteristics, the influence of unit sizes could be explored. The transmission coefficient curves of Y-ring-shaped FSFs with different unit size parameters are shown in Figs. 10(a) and 10(b).
Figure 10 shows that transmission coefficient curves of patch FSFs as well as aperture FSFs move to lower frequency regions as the inner diameter of Y-ring increases. Overall, the shape of transmission coefficient curves and the resonance frequencies have no obvious change. To quantitatively analyze the influence of the unit size parameters, the resonance frequencies are extracted and listed in Table 3.
As shown in Table 3, when the internal diameter increases by 1.0 mm, the resonance frequency decreases by 1.87 GHz for patch FSFs, while the variation degree of aperture FSFs is a little larger, decreasing by 2.38 GHz. Different from the Y-shaped FSFs, the unit size parameters only affect the resonance frequency, and the data in Table 3 could provide design basis for determining the unit size parameters.

Table 3 Resonance frequencies of Y-ring-shaped FSFs with different unit size parameters
2.3 Characteristics comparison of Y-shaped and Y-ring-shaped FSFs
To further comparatively analyze the differences of electromagnetic characteristics between Y-shaped and Y-ring-shaped FSFs, samples 1A#, 1B#, 10A#, and 10B# are selected for analysis and the diagram comparisons are shown in Figs. 11(a) and 11(b). Likewise, the characteristics, including the resonance frequency and the resonance peak or valley, are extracted and listed in Table 4.
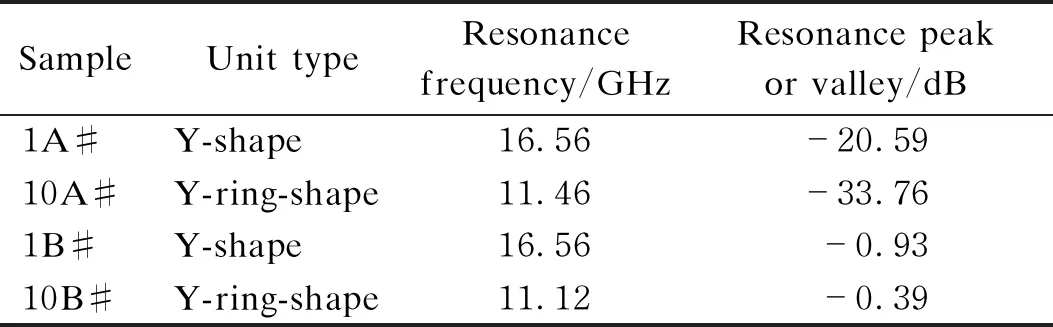
Table 4 Comparison of characteristics of Y-shaped and Y-ring-shaped FSFs
Figures 11(a) and 11(b) show that the electromagnetic transmission characteristics of Y-shaped and Y-ring-shaped FSFs are significantly different. For patch FSFs, the transmission coefficient curves move down and to the left as Y-shaped FSFs vary to Y-ring-shaped FSFs, meaning that both of the resonance frequency and the resonance valley are changing. For aperture FSFs, resonance frequencies and bandwidths present remarkable variance. In Table 4, the differentials of the resonance frequency and the resonance peak or valley are listed, showing that the resonance frequency offset is about 5 GHz for two kinds of FSFs and the resonance valley offset is approximately 13 dB for the patch FSFs.
The above variations can be attributed to the discrepancy of unit features. Although the unit size parameters of two kinds of FSFs are similar, equivalent inductance and capacitance values are obviously different, as the annular region of Y-ring-shaped FSFs could be equivalent to the extra inductor or capacitor. The above comparative analysis could offer design ideas for other ring-shaped FSFs.
3 Conclusions
Y-shaped and Y-ring-shaped FSFs were designed, prepared and tested. Through in-depth comparative analysis, the following conclusions are obtained.
(1) For Y-shaped and Y-ring-shaped FSFs, the polarization mode exerts certain influences on the electromagnetic transmission characteristics, but the effects are minor.
(2) For Y-shaped FSFs, the changes of unit size parametersa,b, andDcan significantly affect the electromagnetic transmission characteristics, but the influences are various. On the whole, the variation ofbexerts the greatest influence on the resonance frequency as well as the resonance valley or peak.
(3) For Y-ring-shaped FSFs, the variation of Y-ring inner diametersa1andb1has an appreciable impact on transmission coefficient curves, but it mainly affects the resonance frequency, different from Y-shaped FSFs.
杂志排行
Journal of Donghua University(English Edition)的其它文章
- Evaluation of Tactile Comfort of Underwear Fabrics
- Classification of Young Females’ Body Shape in Jiaodong Area Based on 3D Morphological Characteristics
- Property of Polyimide/Flame-Retardant Viscose Blended Fabrics
- Adaptive Neural Network Control for Euler-Lagrangian Systems with Uncertainties
- Adaptive Single Piecewise Interpolation Reproducing Kernel Method for Solving Fractional Partial Differential Equation
- Finite-Time Stability for Nonlinear Fractional Differential Equations with Time Delay