Transcriptomic and metabolomic insights into the role of the flgK gene in the pathogenicity of Pseudomonas plecoglossicida to orange-spotted grouper(Epinephelus coioides)
2022-11-29BiaoYuanLingMinZhaoZhiXiaZhuangXiaoRuWangQiFuHuaBinHuangLiXingHuangYingXueQinQingPiYan
Biao Yuan, Ling-Min Zhao, Zhi-Xia Zhuang, Xiao-Ru Wang, Qi Fu, Hua-Bin Huang, Li-Xing Huang, Ying-Xue Qin,Qing-Pi Yan,*
1 Fisheries College, Jimei University, Xiamen, Fujian 361021, China
2 College of Environment and Public Health, Xiamen Huaxia University, Xiamen, Fujian 361024, China
ABSTRACT Pseudomonas plecoglossicida is the pathogen responsible for visceral white spot disease in large yellow croaker (Larimichthys crocea) and orangespotted grouper (Epinephelus coioides). Previously,RNA sequencing showed that P. plecoglossicida flgK gene expression was significantly up-regulated in orange-spotted grouper spleens during infection. To explore the role of flgK in P. plecoglossicida pathogenicity, RNA interference (RNAi) was performed to silence the P. plecoglossicida flgK gene, and the mutant (flgK-RNAi strain) with the best silencing efficiency (89.40%) was chosen for further study. Results showed that flgK gene silencing significantly attenuated P. plecoglossicida motility,adhesion, and biofilm formation. Compared to those fish infected with the wild-type strain of P.plecoglossicida, orange-spotted grouper infected with the flgK-RNAi strain showed a 55% increase in the survival rate and a one-day delay in time of first death, with fewer pathogens in the spleen and fewer white spots on the spleen surface. RNAi of flgK significantly affected the transcriptome and metabolome of the spleen in infected orange-spotted grouper. Kyoto Encyclopedia of Genes and Genomes (KEGG) enrichment analysis showed that the C-type lectin receptor signaling pathway was the most significantly changed immune-related pathway and the mitogen-activated protein kinase (MAPK)signaling pathway was related to multiple immunerelated pathways. Furthermore, arginine biosynthesis and glycerophospholipid metabolism were the most significantly changed metabolism-related pathways.These findings suggest that flgK is a virulence gene of P. plecoglossicida. Furthermore, flgK appears to be involved in the regulation of motility, adhesion,and biofilm formation in P. plecoglossicida, as well as in the regulation of inflammatory and immune responses of orange-spotted grouper to P.plecoglossicida infection.
Keywords: Orange-spotted grouper; Pseudomonas plecoglossicida; flgK; Pathogenicity; Transcriptome; Metabolome
INTRODUCTION
The aquaculture industry has developed rapidly in many countries in recent years and plays an important role in providing quality food (Fiorella et al., 2021; Rodriguez et al.,2021). The most critical factor affecting aquaculture is the frequent outbreak of diseases (Asche et al., 2021; Defoirdt,2016; Pereira et al., 2022), many of which are caused by bacterial pathogens (Ghomrassi et al., 2016).Pseudomonas plecoglossicida, a gram-negative bacterial pathogen with polar flagella (Nishimori et al., 2000), can infect fish species such as large yellow croaker (Larimichthys crocea) and orange-spotted grouper (Epinephelus coioides) at low temperatures. This infection can lead to visceral white spot disease, which is characterized by high infection and mortality, resulting in huge economic losses (Hu et al., 2021; Li et al., 2020; Tang et al.,2020; Zhang et al., 2014). To clarify the pathogenicity ofP.plecoglossicida, several virulence genes and their roles in infection have been explored (Huang et al., 2021). However,to better understand the pathogenic mechanisms ofP.plecoglossicida, the functions of most genes remain to be investigated.
Bacterial pathogenicity is affected by multiple factors.Flagella are responsible for bacterial movement and are one of the factors that affect pathogenicity (Duan et al., 2013; Gu,2017; Nakamura & Minamino, 2019). Bacterial flagella participate in many disease-related processes, including adhesion, biofilm formation, virulence factor secretion, motility,and chemotaxis (Balaban & Hendrixson, 2011; Duan et al.,2013).
Bacterial flagella are composed of three parts, i.e., matrix,hook, and filament (Nedeljković et al., 2021), which contain different protein molecules and perform different functions.Flagellar hooks, universal joints connecting flagellar matrices and filaments, are assembled by multiple FlgE hook proteins,which can smoothly transfer matrix-generated torque to the filament (Kato et al., 2019). Flagellar filaments are polymerized by a single FliC flagellin (paFliC) protein and confer bacterial motility (Nakamura & Minamino, 2019;Nedeljković et al., 2021). The flexible hooks and rigid filaments exhibit obvious mechanical and structural characteristics and require hook-wire connections as buffer structures. Notably,two hook-wire junction proteins, FlgK and FlgL (HAP1 and HAP3), are directly connected to the flagellar hooks and filaments, respectively (Bouteiller et al., 2021).
We previously found that theflgKgene in theP.plecoglossicidaNZBD9 strain is highly expressed in the host(NCBI, SRP115064), suggesting thatflgKmay be involved in the regulation of bacterial virulence. TheflgKgene is involved in flagellar assembly, thus affecting virulence factors, such as motility, adhesion, and biofilm development (Salehi et al.,2017). InHelicobacter pylori,flgKis important for flagellar formation and motility, and gene deficiency can interfere with colonization (Wu, 2006). InSalmonella,flgKdeletion hinders correct flagellar assembly and reduces bacterial adhesion ability (Salehi et al., 2017). Furthermore, followingflgKknockout,Vibrio vulnificusshows a complete loss of motility and decreased cytotoxicity (Kim et al., 2008), whileCampylobacter jejunifails to produce flagellar filaments,resulting in reduced motility and colonization capacity(Fernando et al., 2007).
Considering the substantial harm posed byP.plecoglossicidato aquaculture and the potential impact offlgKon bacterial virulence, we used RNA interference (RNAi) to silence theflgKgene in theP. plecoglossicidaNZBD9 strain.We then analyzed differences in virulence between the wildtype NZBD9 strain andflgK-RNAi NZBD9 strain (herein RNAi strain) as well as differences in the orange-spotted grouper immune response to infection with the different strains using transcriptome sequencing and metabolomics.
MATERIALS AND METHODS
Ethics statement
All fish experiments were approved by the Ethics Committee of Jimei University (permit No. JMULAC201159) and were carried out in compliance with the National Institutes of Health’s Guide for the Care and Use of Laboratory Animals.
Bacterial strains and culture conditions
The wild-type pathogenicP. plecoglossicidaNZBD9 strain was isolated from the spleen of a diseased large yellow croaker (Luo et al., 2019). The strain was cultured in Luria Bertani (LB) broth containing 30 μg/mL ampicillin at 18 °C.The RNAi strain was cultured in LB broth containing 30 μg/mL tetracycline and 30 μg/mL ampicillin at 18 °C.Escherichia coliDH5α used to construct the RNAi strains ofP. plecoglossicidawas purchased from the Weidi Biotechnology Company(Shanghai, China) and cultured in LB broth at 37 °C.
Construction of P. plecoglossicida RNAi strain
The RNAi strains were constructed according to previously described methods (Tang et al., 2022), with minor modifications. The sequences of four pairs of short hairpin RNA (shRNA) (Supplementary Table 1) were designed according to the sequences of theflgKgene using RNAi Designer (http://rnaidesigner.thermofisher.com) and were synthesized by Shanghai General Biotechnology Co., Ltd.(China).After linearization of the pCM130/tac vector by restriction enzymesNsiIandBsrGI(New England Biolabs,USA), T4 DNA ligase (New England Biolabs, USA) was used to ligate the annealed oligonucleotides to the linearized pCM130/tac vector to construct a recombinant pCM130/tac vector. The recombinant vector was then transformed intoE.coliDH5α by heat shock, then extracted and transferred intoP. plecoglossicidaby electroporation. Finally, the expression levels offlgKwere determined by quantitative real-time polymerase chain reaction (qRT-PCR). The qRT-PCR system and procedure are provided in Supplementary Table S2.
Biological characteristics
Growth curve determination:Growth curves were constructed following previous research (Hu et al., 2021).Overnight cultures of the NZBD9 andflgK-RNAi strains ofP.plecoglossicidawere adjusted to optical density at 600 nm(OD600)=0.3±0.01, then diluted 1 000-fold in fresh LB broth. An aliquot (200 μL) of the bacterial diluent was added to the wells of a 96-well plate (12 wells per strain) and incubated at 18 °C for 36 h. The OD600of each well was detected hourly and automatically using a SYNERGY H1 microplate reader(BioTek, USA).
Swarming motility determination:Swarming motility was determined following previously described methods (Qi et al.,2022). Overnight cultures of the NZBD9 andflgK-RNAi strains ofP. plecoglossicidawere adjusted to OD600=0.3±0.01 in LB broth. The adjusted bacterial diluent (1 μL) was dropped onto 0.4% semi-solid agar medium and incubated at 18 °C for 12 h.Three independent replicates were performed per strain.
In vitro adhesion determination:In vitroadhesion was determined following previous study (He et al., 2021).Approximately 20 μL of mucus (1 mg protein/mL) was evenly coated onto a 22 mm2area of a glass slide and fixed with methanol for 20 min. A bacterial suspension (200 μL;OD600=0.3±0.01) was spotted on the mucus-coated glass slide. The glass slides were then placed in a humidified chamber, incubated at 18 °C for 3 h, then washed five times in phosphate-buffered saline (PBS, 0.01 mol/L, pH=7.2). Finally,the bacteria were fixed with 4% methanol for 30 min, stained with crystal violet for 3 min, and counted under a microscope(×1 000) (Leica DM4000 B LED, Leica, Germany). Five glass slides were performed per strain, and the adhered bacteria in 20 randomly selected fields were counted per slide.
Biofilm formation assay:Biofilm formation was explored following previous research (Jiao et al., 2021). Overnight cultures of the NZBD9 andflgK-RNAi strains ofP.plecoglossicidawere adjusted to OD600=0.3±0.01 in fresh LB broth. The bacterial suspension (100 μL) was added to the wells of a 96-well plate (10 wells per strain) and incubated at 18 °C for 36 h. Each well was then gently washed twice with sterile PBS (2 mL), dyed with 125 μL of crystal violet (0.1%)for 15 min, gently washed twice with sterile PBS, and air-dried.Finally, 200 μL of acetic acid (33%) was added to each well to dissolve the stained biofilm for 30 min, and OD590of each well was determined using a SYNERGY H1 microplate reader(BioTek, USA).
Artificial infection and sampling
Mortality assay:Healthy, specific pathogen-free, sizematched orange-spotted groupers (14.07±0.71 cm,39.25±6.40 g), showing no damage to the body surface, were purchased from Zhangzhou (Fujian Province, China) and adaptively maintained for 7 days (18±1 °C) under laboratory conditions without specific pathogens.
In total, 180 orange-spotted groupers were randomly divided into three groups: i.e., NZBD9 strain-infected group,RNAi strain-infected group, and PBS-injected group. Strains used for infection were cultured overnight at 18 °C to the logarithmic phase, harvested by centrifugation (18 °C, 4 000 r/min, 5 min) (Wang et al., 2021), and resuspended in PBS to OD600=0.3±0.02. Each fish in the infection groups was intraperitoneally injected with the corresponding strain at a dose of 5×10⁴colony-forming units (CFU)/fish. For the negative control, 60 fish were injected with 200 μL of PBS.Survival was observed and recorded every 12 h after injection to 10 days post infection (dpi).
Sampling:For spleen sampling, 240 fish were randomly divided into three groups: i.e., NZBD9 strain-infected group,RNAi strain-infected group, and PBS-injected group. The fish were treated as described above. Six spleens were randomly sampled from each group at 1, 2, 3, 5, and 6 dpi. Two spleens from each group were randomly mixed into one sample. All samples were subjected to pathogen load assay andfliKgene expression determination. Thirty-six spleens were randomly sampled at 4 dpi, with six spleens from the same group randomly mixed into one sample. All six spleen samples at 4 dpi were subjected to metabolomic analysis, and three were subjected to RNA sequencing (RNA-seq), qRT-PCR for validation of RNA-seq data, pathogen load assay, andfliKgene expression determination. All spleen samples were frozen in liquid nitrogen and stored in a refrigerator at -80 °C.
DNA extraction and cDNA preparation
Bacterial DNA was extracted from the infected orange-spotted grouper spleens using an EasyPure Marine Animal Genomic DNA Kit (TransGen Biotech, China) following the manufacturer’s instructions.
Total RNA was extracted from the orange-spotted grouper spleens andin vitro-cultured bacteria using a TransZol Up Kit(TransGen Biotech, China) following the manufacturer’s instructions. The cDNA was synthesized using TransScript Allin-One First-Strand cDNA Synthesis SuperMix for qRT-PCR(One-Step gDNA Removal) (TransGen Biotech, China)according to the product manual.
qRT-PCR, pathogen load, and gene expression assay
According to gene sequences, primers (Supplementary Table S3) were designed online using the NCBI design function(https://www.ncbi.nlm.nih.gov/) and synthesized by Sangon Biotech (China). The qRT-PCR analysis was implemented using a QuantStudio 6 Flex Real-Time PCR system (Life Technologies, USA). The qRT-PCR system and procedure are provided in Supplementary Table S2. Copy number of thegyrBgene was used to represent bacterial load in the spleens(Izumi et al., 2007). Expression levels of theP. plecoglossicidagenes were standardized using 16S rDNA (Wang et al., 2020).Relative expression levels of genes were calculated using the 2-∆∆Ctmethod (Livak & Schmittgen, 2001).
Transcriptomic analysis
Library preparation and sequencing:RNA concentration and purity were detected using a NanoDrop 2000 spectrophotometer (Yi et al., 2020), RNA integrity was detected by electrophoresis on 1% agarose gel (stained with 0.1% ethidium bromide), and RNA integrity number (RIN) was determined using an Agilent 2100 Bioanalyzer (Agilent, USA)(Yao et al., 2021). RNA-seq libraries were prepared using the protocols provided with the Illumina TruSeq™ RNA Sample Prep Kit (USA) (Wu et al., 2021). The constructed RNA-seq libraries were sequenced on the Illumina NovaSeq 6000 sequencing platform (Ferreira et al., 2021) by Shanghai Majorbio Biomedical Technology Co., Ltd. (China). Three replicates were performed per group.
Quality control of sequencing data:The FASTX-Toolkit v0.0.14 (http://hannonlab.cshl.edu/fastx_toolkit/) was used to analyze the Illumina raw sequencing data as well as library construction and sequencing quality (Huang et al., 2018).SeqPrep (https://github.com/jstjohn/SeqPrep) was used to perform quality control of the raw sequencing data to obtain high-quality clean data to ensure the accuracy of subsequent analyses (Wu et al., 2021).
Sequence data processing and mapping of reads:Trinity(https://github.com/trinityrnaseq/trinityrnaseq/wiki) was used to performab initioassembly of all clean data (Grabherr et al.,2011). TransRate (http://hibberdlab.com/transrate/) was used to optimize and filter the initial assembly data (Smith-Unna et al., 2016). BUSCO (Benchmarking Universal Single-Copy Orthologs, http://busco.ezlab.org) was used to evaluate assembly integrity of the genome and transcriptome (Seppey et al., 2019). The clean reads of each sample were compared with the reference sequence obtained by Trinity assembly,and the mapping results of each sample were obtained for subsequent gene and transcript quantification (Sherwood et al., 2019).
Differentially expressed genes (DEGs) and enrichment analysis:The transcriptome data were analyzed using the Majorbio Cloud Platform (www.majorbio.com). RSEM software was used to analyze transcript expression quantitatively (Li &Dewey, 2011) based on the transcripts per million (TPM)values (Biever et al., 2020). DESeq2 was used to analyze differences in expression between samples (Love et al., 2014), withP-adjust (false discovery rate (FDR))<0.05 and |log2FC|>1.0 indicating significant DEGs (Zeng et al.,2017b). GOATOOLS (https://github.com/tanghaibao/Goatools)was used for Gene Ontology (GO) enrichment analysis and KOBAS (http://kobas.cbi.pku.edu.cn/home.do) was used for Kyoto Encyclopedia of Genes and Genomes (KEGG) pathway enrichment analysis (Gu et al., 2018). Fisher’s exact test was used to identify significantly enriched GO terms or KEGG pathways (FDR<0.05) (Gu et al., 2018). R software (v2.0) was used for cluster analysis, heatmap visualization, and Pearson correlation evaluation (Wen et al., 2015).
Confirmation of RNA-seq results by qRT-PCR:Six upregulated and six down-regulated DEGs were randomly selected from the RNA-seq results for validation by qRT-PCR and Pearson correlation analysis was performed to confirm the accuracy and repeatability of the RNA-seq data (Liu et al.,2020a). Expression levels of the orange-spotted grouper genes were standardized usingβ-actin(Wang et al., 2020).Primer sequences of selected genes are provided in Supplementary Table S3, The qRT-PCR system and procedure are provided in Supplementary Table S2. Three replicates were performed per gene.
Metabolomic analysis
Metabolite extraction:A total of 12 samples (six samples each from the NZBD9 andflgK-RNAi strain-infected groups,with each sample containing a mixture of six spleens) were subjected to metabolomic analysis. Each spleen sample (50 mg) was mixed with 400 μL of extract (methanol:water=4:1(v:v) and 0.02 mg/mL internal standard (L-2-chlorophenylalanine)), then ground in a cryogrinder (Wonbio-96 c, Wonbio, China) with a grinding bead (6 mm) for 6 min(-10 °C, 50 Hz). The samples were extracted by ultrasound for 30 min (5 °C, 40 kHz), stored at -20 °C for 30 min, and centrifuged (13 000 ×g, 4 °C, 15 min) (Centrifuge 5430 R,Eppendorf, Germany) to collect the supernatant. Each sample supernatant (20 μL) was subjected to metabolomic analysis.To ensure the stability of the whole detection process, 20 μL of supernatant from each of the 12 samples was combined into one mixture, and 20 μL of mixture was used as the quality control (QC). Three QCs were tested in the same batch as the 12 normal samples.
Liquid chromatography-mass spectrometry (LC-MS)analysis:Ultra-performance liquid chromatography-tandem Fourier transform mass spectrometry (UPLC-MS/MS) was performed using the UHPLC-Q Exactive HF-X system(Thermo Fisher Scientific, USA). The chromatographic conditions were: Acquity UPLC HSS T3 column (100 mm×2.1 mm i.d., 1.8 μm); Waters, USA); mobile phase A, 95%water+5% acetonitrile (containing 0.1% formic acid); and mobile phase B, 47.5% acetonitrile+47.5% isopropanol+5%water (containing 0.1% formic acid). The injection volume was 2 μL and column temperature was 40 °C. For the mobile phase elution gradient, see Supplementary Table S4.
The mass spectrometry conditions were: electrospray ionization and mass spectrometry signals collected by positive and negative ion scanning modes, respectively. For specific parameters, see Supplementary Table S5.
Data preprocessing and annotation
Following UPLC-MS/MS analysis, raw data were imported into Progenesis QI v2.3 (Nonlinear Dynamics, Waters, USA) for peak detection and alignment. The preprocessing results generated a data matrix consisting of retention time (RT),mass-to-charge ratio (m/z) values, and peak intensity.Metabolic features detected at ≥80% in any set of samples were retained. After filtering, minimum metabolite values were imputed for specific samples with metabolite levels below the lower limit of quantitation and each metabolic feature was normalized by summation. Internal standard was used for data QC (reproducibility), and metabolic features with a relative standard deviation (RSD) of QC>30% were discarded.Following normalization and imputation, statistical analysis was performed on log-transformed data to identify significant differences in metabolite levels between groups. Metabolomic mass spectra were identified using accurate mass, MS/MS fragment spectra, and isotope ratio differences by searching reliable biochemical databases, i.e., Human Metabolome Database (HMDB) (http://www.hmdb.ca/) and METLIN database (https://metlin.scripps.edu/) (Qu et al., 2016; Yang et al., 2021). Mass tolerance between the measured m/z values and exact mass of the components of interest was ±10 ppm. For metabolites with MS/MS confirmation, only those with MS/MS fragment scores above 30 were considered as confidently identified, otherwise the metabolites were tentatively assigned.
Analysis of differential metabolites
The Metabolomic data were analyzed by principal component analysis (PCA) and orthogonal partial least squares analysis(OPLS-DA) using the ropls package in R (v1.6.2). Both ropls and SciPy were used to calculate variable importance in the projection (VIP) values, while stats (R package) and SciPy(Python package) were used to calculate the FDR using paired samplet-test, with FDR<0.05 and VIP>1 indicating significant differential metabolites. KEGG pathway enrichment,correlation, and cluster analyses were performed for differential metabolites using SciPy (Python, v1.6.2). Fisher’s exact test was used to identify significantly enriched pathways(FDR<0.05) (Feng et al., 2021).
Transcriptomic and metabolomic analyses
KEGG pathway and correlation network analyses:The R package Venn Diagram was used to analyze KEGG pathways involved in DEGs and metabolites (Chen et al., 2020).Correlation network analysis was performed using Cytoscape v3.6.1 to determine the degree of association between genes and metabolites in the samples (Wen et al., 2015).
Statistical analyses:For gene expression analysis (qRTPCR and transcriptomic), data were expressed as the geometric mean±geometricSD, while other data were expressed as arithmetic means±SD. Data analysis was implemented using IBM SPSS Statistics v22.0 (New York,USA), and one-way analysis of variance (ANOVA) with Dunnett’s test was used.P<0.05 was considered statistically significant.
RESULTS
Effects of RNAi on flgK expression in P. plecoglossicida
Based on theflgKgene sequence in theP. plecoglossicidaNZBD9 strain, four RNAi NZBD9 mutant strains were successfully constructed. The qRT-PCR results showed that the relative expression level offlgKin the four RNAi mutant strains was lower than that in the NZBD9 strain. The relative expression levels offlgKmRNA of shRNAi-593, shRNAi-687,shRNAi-880, and shRNAi-1292 were 12.86%, 17.58%,11.60%, and 16.30%, respectively. The strain containing pCM130/tac-flgK-shRNA-880 (herein referred to asflgK-RNAi strain) showed the best silencing efficiency (89.40%; Figure 1)and was thus used for subsequent study.
Effects of flgK on biological characteristics of P.plecoglossicida
As shown in Figure 2A, theflgK-RNAi strain colony was significantly smaller than the NZBD9 strain colony in the LB semi-solid medium, with colony diameters of 6.82±0.49 mm and 9.64±0.63 mm, respectively (Figure 2B). As seen in Figure 2C, the NZBD9 strain biofilm was darker than that of theflgK-RNAi strain after staining, and the OD590value of the NZBD9 strain (0.89±0.11) was significantly higher than that of theflgK-RNAi strain (0.69±0.03) (Figure 2D). As shown in Figure 2E, bacterial adherence (number of adherent cells) to the fish mucus was significantly lower in theflgK-RNAi strain(350.78±86.14 cells/vision) than in the NZBD9 strain(945.34±105.30 cells/vision) (Figure 2F). Based on the growth curves in Figure 2G, there were no significant differences in growth rate (within 36 h of incubation) between the two strains.
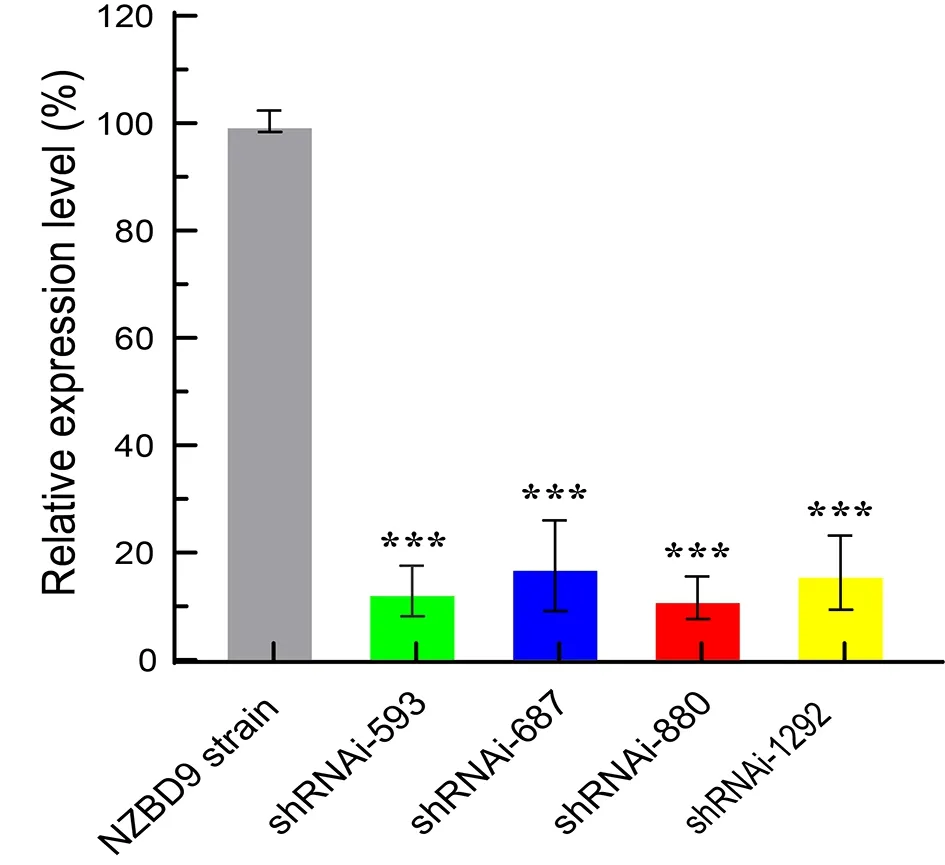
Figure 1 Relative expression levels of flgK in NZBD9 strain and four mutant strains of P. plecoglossicida
Effects flgK gene silencing on P. plecoglossicida virulence
TheP. plecoglossicidaNZBD9 strain exhibited high virulence against the orange-spotted groupers. Notably, the groupers infected with the NZBD9 strain (5×10⁴CFU) began to die at 2.5 dpi, with 100% mortality at 6.5 dpi. In contrast, the groupers infected with theflgK-RNAi strain (5×10⁴CFU)began to die at 3.5 dpi, with a final mortality rate of 45%. No fish in the PBS-injected control group died during the experiment (Figure 3A). Both theflgK-RNAi and NZBD9 strains persisted in the orange-spotted grouper spleen post injection, although theflgK-RNAi pathogen load was lower than that of the NZBD9 strain over the entire infection period(Figure 3B). Compared withflgKexpression inP.plecoglossicidacultured at 18 °Cin vitro, theflgKgene showed high and time-dependent expressionin vivo. In the early stages of infection,flgKexpression in the NZBD9 strain gradually increased, reaching a maximum at 3 dpi before gradually decreasing. In theflgK-RNAi strain,flgKexpression was similar (maximum at 2 dpi), but always lower than that in the NZBD9 strain (Figure 3C). At 6 dpi, the spleen surfaces of the NZBD9-infected fish were covered in numerous white spots, whereas the spleens of theflgK-RNAi-infected fish were covered in fewer white spots. No white spots were observed on the spleen surfaces of fish injected with PBS (Figure 3D).
Effects of flgK gene on RNA-seq data of spleens from infected orange-spotted groupers
From the overall RNA-seq data, the distribution of each base content was balanced (Supplementary Figure S1), and the unknown base (N) content was within an acceptable range(Supplementary Figure S2). The Q20 of each group was>97%, and the base error rate was <0.1%, thus meeting the requirements for subsequent analysis (Supplementary Figure S3). The reproducibility and PCA results of the three spleen samples from the NZBD9 andflgK-RNAi strain-infected groups were satisfactory (Supplementary Figures S4, S5).
Compared with the NZBD9-infected spleens, we identified 21 016 DEGs in theflgK-RNAi-infected spleens, including 7 311 up-regulated and 13 705 down-regulated DEGs(Figure 4A). The qRT-PCR results were consistent with the RNA-seq data and showed a strong correlation (R2=0.8933)(Supplementary Figures S6, S7), demonstrating the reliability of the RNA-seq data and subsequent analyses.
After DEG analysis, a total of 135 GO terms were enriched, including five significantly enriched terms (FDR<0.05)(Figure 4B). The 135 enriched terms included many related to immunity and inflammation, such as immune receptor activity,regulation of immune response, regulation of MAPK cascade inflammatory response, regulation of inflammatory response,and Toll-like receptor signaling pathway.

Figure 2 Comparison of biological characteristics between NZBD9 and flgK-RNAi strains of P. plecoglossicida
Based on DEG analysis, a total of 347 KEGG pathways were enriched, including 34 immune- and inflammation-related pathways, such as T cell receptor signaling pathway, B cell receptor signaling pathway, antigen processing and presentation, C-type lectin receptor signaling pathway, and Toll-like receptor signaling pathway (Figure 4C, D). The Ctype lectin receptor signaling pathway was the most significantly enriched immune-related pathway (FDR<0.05),involving 23 up-regulated genes, 34 down-regulated genes,and nine genes showing no significant change, among which DC-SIGN(clec4e)and nuclear factor of kappa light polypeptide gene enhancer in B-cells 2 (nfkb2) were the highest up- and down-regulated DEGs, respectively(Figure 4E). Figure 4F shows the network connections among the immune-related pathways enriched in the transcriptome,with the MAPK signaling pathway connecting to the most signaling pathways (10 pathways).
As the most significantly enriched immune-related pathway,the C-type lectin receptor signaling pathway was further analyzed. Compared with the NZBD9-infected orange-spotted grouper spleens, interleukin 1 beta (il1b), interleukin 10 (il10),interleukin 12 (il12), prostaglandin-endoperoxide synthase 2a (cox2a), early growth response 2/3 (egr2/3), tumor necrosis factor alpha (tnfa), nuclear factor of activated T cells 1/3(nfatc1/3), and transcription factor RelB (relb) in the C-type lectin receptor signaling pathway were down-regulated in theflgK-RNAi-infected spleens, while spleen tyrosine kinase (syk),phospholipase C gamma 2 (plcg2), protein phosphatase 3 catalytic subunit (ppp3c), protein phosphatase 3 regulatory subunit B (ppp3r), and mitogen-activated protein kinase 14a(p38) were up-regulated (Figure 5). As shown in Figure 5, the up- and down-regulated genes were clustered together separately.
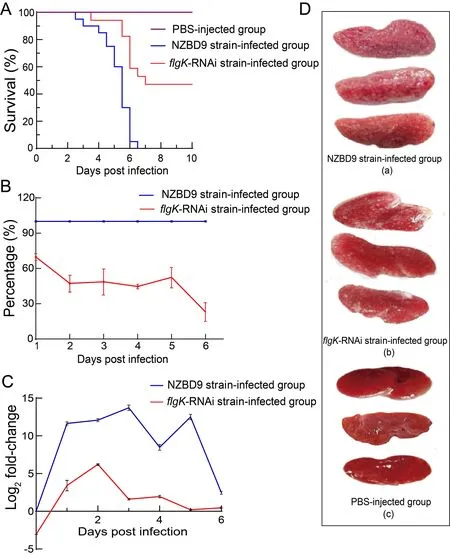
Figure 3 Comparison of virulence between NZBD9 and flgK-RNAi strains of P. plecoglossicida
Effects of flgK on host spleen metabolomes
Metabolomic profiling was performed using QC samples,which showed satisfactory results (Supplementary Figure S8).The PCA model indicated that theflgK-RNAi-infected group and NZBD9-infected group samples were clustered within their respective confidence ellipses (Figure 6A). According to the volcano map (combining anions and cations), 737 spleen metabolites were identified between theflgK-RNAi-infected group and NZBD9-infected group samples, including 114 upregulated and 223 down-regulated (VIP>1, FDR<0.05) in theflgK-RNAi-infected samples (Figure 6B). OPLS-DA model analysis showed a clear separation trend between the differential metabolites in theflgK-RNAi-infected and NZBD9-infected spleens (Figure 6C). According to the model parameter table and verification results, the OPLS-DA model was stable and reliable without overfitting (Supplementary Figure S9; Supplementary Table S6).
Differential metabolite analysis
After KEGG pathway annotation of all 337 differential metabolites, 80 differential metabolites were annotated to six KEGG first-category pathways, including metabolism, genetic information processing, environmental information processing,cellular processes, organismal systems, and diseases(Figure 6D).

Figure 4 Comparative transcriptomic analysis of RNA-seq data of orange-spotted grouper spleens infected by flgK-RNAi or NZBD9 strains of P. plecoglossicida
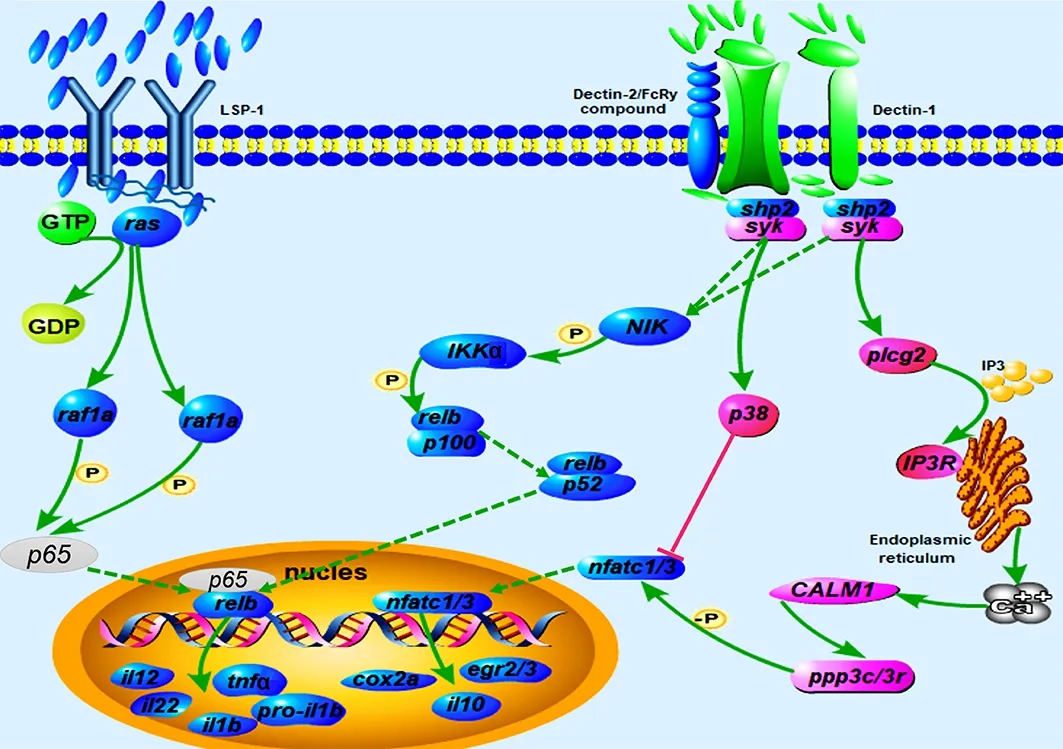
Figure 5 Schematic of DEGs in C-type lectin receptor signaling pathway in orange-spotted grouper spleens
After KEGG pathway enrichment analysis of all 337 differential metabolites, 115 KEGG pathways were enriched,including 16 significantly enriched pathways (Figure 6E) and six highly significantly enriched pathways (FDR<0.001), i.e.,choline metabolism in cancer, linoleic acid metabolism, purine metabolism, glycerophospholipid metabolism, ABC transporters, and arginine biosynthesis. The six highly significantly enriched pathways contained 29 metabolites(Figure 6F). Further analysis indicated that the 29 differential metabolites were enriched in 64 KEGG metabolic pathways,with adenosine monophosphate (AMP) found to be enriched in 19 of these pathways.
Transcriptomic and metabolomic analysis results
Comparison of KEGG pathways enriched in the transcriptome and metabolome data identified 107 shared pathways,accounting for 93.04% of the 116 metabolome KEGG pathways and 30.84% of the 347 transcriptome KEGG pathways. The 107 shared pathways included the PI3K/Akt,MAPK, and other immune- and inflammation-related signaling pathways.
The top 100 DEGs (50 most up-regulated and 50 most down-regulated DEGs) and top 100 differential metabolites(50 most up-regulated and 50 most down-regulated differential metabolites) were selected for correlation network analysis.Results showed that 82 DEGs were correlated with 35 differential metabolites. Among the 35 differential metabolites,O-phosphorylethanolamine (PEA) and phosphatidylserine(PS) showed the most positive (11 DEGs) and negative (10 DEGs) correlations, respectively (Figure 7B).

Figure 6 Comparative metabolite analysis of flgK-RNAi-infected and NZBD9-infected orange-spotted grouper spleens (combined anion and cation models)

Figure 7 Transcriptomic and metabolomic analyses
A: Venn diagram of DEGs and differential metabolites enriched in KEGG pathways. B: Network analysis of correlation between top 100 DEGs and differential metabolites(larger node indicates more correlated DEGs or differential metabolites, red line indicates positive correlation between DEGs and differential metabolites, blue line indicates negative correlation between DEGs and differential metabolites, and thicker line indicates stronger correlation).
DISCUSSION
RNAi technology is widely used in many fields, including gene function analysis (Matsushima, 2021). In this study, we applied RNAi to silenceflgKinP. plecoglossicida, achieving a high silencing efficiency of 89.40%. TheflgKgene remained silent in the spleens of orange-spotted grouper and inin vitroculture, thus laying the foundation for subsequent study.
Our results showed that silencing theflgKgene significantly reducedP. plecoglossicidamotility, biofilm formation, and adhesion ability, which are closely related to bacterial pathogenicity (Song et al., 2019; Zhang et al., 2020).Compared with theP. plecoglossicidaNZBD9 strain, infection with theflgK-RNAi strain resulted in a 55% increase in orangespotted grouper survival, and a one-day delay in time of first death. Thus,flgKgene silencing resulted in a marked decrease inP. plecoglossicidapathogenicity, suggesting thatflgKis a virulence gene, as confirmed by spleen symptoms and pathogen load analysis. Previous studies have reported that the silencing of virulence genes, such asexbB,clpV,tonB, andimpB, can significantly reduceP. plecoglossicidavirulence. For example, orange-spotted groupers infected withexbB- andimpB-silenced strains (silencing efficiencies of 89.3% and 95.2%, respectively) show survival rates of 70%and 100%, respectively (Liu et al., 2020b; Tang et al., 2022),higher than our reported survival rate (55%). While orangespotted groupers infected withclpV- andtonB-silenced strains(silencing efficiencies of 96.1% and 94.0%, respectively) show survival rates of 25% and 20%, respectively (Hu et al., 2021;Tang et al., 2019), lower than our reported survival rate. We also found that silencingflgKdid not affectP. plecoglossicidagrowth, suggesting that the decrease inP. plecoglossicidavirulence was not due to a decrease in the bacterial growth rate. However, whetherP. plecoglossicidavirulence is associated with motility, biofilm formation, and adhesion remains to be investigated.
Compared with the NZBD9-infected spleens, we identified 21 016 DEGs in theflgK-RNAi-infected spleens of the orangespotted groupers, including 7 311 up-regulated and 13 705 down-regulated DEGs. These results suggest thatflgKgene silencing significantly affects transcription in infected orangespotted groupers.
Based on GO and KEGG analysis, many terms and signaling pathways related to immunity and inflammation were significantly enriched, including inflammatory response, MAPK signaling pathway, and C-type lectin receptor signaling pathway. Previous research has also reported significant enrichment of the MAPK and C-type lectin receptor signaling pathways in orange-spotted groupers infected with theclpVsilenced strain ofP. plecoglossicida(Tang et al., 2019). In our study, the MAPK signaling pathway was related to multiple immune-related pathways, while the C-type lectin receptor signaling pathway was the most enriched. These results suggest thatflgKsilencing inP. plecoglossicidasignificantly affects the immune response of infected orange-spotted groupers.
The MAPK signaling pathway plays a crucial role in the regulation of inflammation and cytokine production and is related to a variety of immune pathways (Zhang & Cao, 2021).Compared with the NZBD9-infected fish, many cytokines in the MAPK signaling pathway were down-regulated in the spleens of theflgK-RNAi-infected orange-spotted groupers,including Jun proto-oncogene (jun), ETS transcription factor ELK1 (elk1), andnfatc1.Juncan induce the expression of proinflammatory cytokines (Srivastava & Baig, 2018), whileelk1expression can promote the pathogenesis of cancer (Yu et al.,2021) andnfatc1can induce T lymphocyte activation(Pachulec et al., 2016). C-type lectin receptors, which are pattern recognition receptors (Liu et al., 2017), induce the expression of inflammatory cytokines that trigger host innate and adaptive immunity to pathogens (Tang et al., 2018). The expression levels ofrelb,nfat, and many inflammatory factors(il12,il1b,cox2a,tnfa, andil10) in the MAPK signaling pathway were down-regulated in theflgK-RNAi-infected orange-spotted grouper spleens. Inflammatory factors regulate and activate both inflammatory and immune responses (Park& Jeen, 2018). A decrease inrelbactivity affects normal differentiation of T cells and reduces the production of interleukin 2 (il2) (Yang et al., 2019). Furthermore,ppp3c/ppp3randp38positively and negatively regulatenfat,respectively (Boczek et al., 2017; Sharlo et al., 2020), the expression of which affects immune cell activation and differentiation (Sana et al., 2021). Here, the down-regulation of these cytokines and inflammatory factors indicated that the inflammatory response in theflgK-RNAi-infected orangespotted grouper spleens was milder than that in the NZBD9-infected spleens, consistent with the lower pathogen load.
Based on metabolomic analysis, the metabolic patterns differed significantly between the NZBD9-infected andflgKRNAi-infected orange-spotted groupers. These results suggest thatflgKgene silencing can significantly change the metabolic patterns of these fish uponP. plecoglossicidainfection, consistent with the changes in transcription following infection by the two strains ofP. plecoglossicida.
Our results also showed that arginine biosynthesis was the most enriched metabolic pathway. Metabolites in this pathway(e.g., ornithine, glutamine, arginine) are involved in oxidative stress, immune response, and inflammatory response inhibition (Barrientos-Moreno et al., 2019; Grzywa et al.,2020). Various studies on fish have reported that high arginine and glutamine intake can reduce the expression levels of interleukin 18 (il18),il1b,jun,tnfa, and other cytokines (Gu et al., 2021; Zheng et al., 2019). In the present study, compared with the NZBD9-infected spleens, arginine and glutamine were highly expressed in the spleens of orange-spotted groupers infected with theflgK-RNAi strain, while the expression levels ofil1β,jun, andtnfαwere down-regulated.
The glycerophospholipid metabolism pathway is involved in the occurrence of various diseases (Su et al., 2022; Zeng et al., 2017a). Many lipid metabolites (e.g., choline, Ophosphorylethanolamine, phosphocholine, and phosphatidylcholine) are involved in the regulation of mitophagy, inflammatory factor expression, and immune response (Fu et al., 2021; Sanchez-Lopez et al., 2019). For example, phosphatidylethanolamine (PE) and choline phosphate (PCho) can be transformed by PEA to inhibit and alleviate inflammation, respectively (Hong et al., 2007; Ireland et al., 2018). A decrease in adenosine triphosphate production caused by changes in the proportion of lecithin (PC) and sphingomyelin can inhibit activation of NLRP3 inflammatory cells and reduce the production of pro-inflammatory cytokinesil1bandil18(Sanchez-Lopez et al., 2019). Here, PEA, CHOP,PC, and PE were highly expressed in the spleens of orangespotted groupers infected with theflgK-RNAi strain.Furthermore, two metabolic pathways, i.e., arginine biosynthesis and glycerol phospholipid metabolism, were significantly changed. This may be due to the different pathogen loads in the spleens of the infected orange-spotted groupers, related to the different virulence of the twoP.plecoglossicidastrains.
CONCLUSIONS
Our results showed that theflgKgene was involved in the regulation ofP. plecoglossicidamotility, adhesion, and biofilm formation, suggesting thatflgKis a virulence gene ofP.plecoglossicida.Silencing offlgKsignificantly affected the transcriptome and metabolome of the orange-spotted grouper spleen followingP. plecoglossicidainfection. The C-type lectin receptor signaling pathway was the most enriched immunerelated pathway in the transcriptome, while arginine biosynthesis and glycerol phospholipid metabolism were the most enriched pathways in the metabolome. The changes in the transcriptome and metabolome indicated that the inflammatory response of the orange-spotted grouper was milder underflgK-RNAi strain infection than NZBD9 strain infection.
DATA AVAILABILITY
The RNA-seq data were submitted to the Science Data Bank database (DOI: 10.57760/sciencedb.02438), National Center for Biotechnology Information (GenBank SRA database under accession numbers SRP374205 (flgK-RNAi strain-infected group), SRP370956 (NZBD9 strain-infected group), and SRP370960 (PBS-injected group)), and National Genomics Data Center under accession number CRA007966. The metabolome data were deposited in the China National GeneBank Database under accession number CNP0002964.
SUPPLEMENTARY DATA
Supplementary data to this article can be found online.
COMPETING INTERESTS
The authors declare that they have no competing interests.
AUTHORS’ CONTRIBUTIONS
Q.P.Y., Z.X.Z., and X.R.W. designed the study. Q.P.Y.supervised the experiments. B.Y., L.M.Z., Q.F., and H.B.H.performed the experiments. L.X.H. and Y.X.Q. performed transcriptome and metabolome data analysis. B.Y. wrote the manuscript with the other authors’ input. B.Y. submitted data to GenBank. Q.P.Y, Z.X.Z., and X.R.W revised the manuscript. All authors read and approved the final version of the manuscript.
杂志排行

Zoological Research的其它文章
- Optimization of sgRNA expression strategy to generate multiplex gene-edited pigs
- Virome in healthy pangolins reveals compatibility with multiple potentially zoonotic viruses
- Chronic lithium treatment ameliorates ketamineinduced mania-like behavior via the PI3K-AKT signaling pathway
- A glimpse into the biodiversity of insects in Yunnan: An updated and annotated checklist of butterflies(Lepidoptera, Papilionoidea)
- Unveiling the functional and evolutionary landscape of RNA editing in chicken using genomics and transcriptomics
- Animal models of Alzheimer’s disease: Applications,evaluation, and perspectives