Unveiling the functional and evolutionary landscape of RNA editing in chicken using genomics and transcriptomics
2022-11-29YunMeiWangLingQunYeMingShanWangJinJinZhangSaberKhederzadehDavidIrwinXiaoDieRenYaPingZhangDongDongWu
Yun-Mei Wang, Ling-Qun Ye, Ming-Shan Wang, Jin-Jin Zhang, Saber Khederzadeh, David M Irwin, Xiao-Die Ren, Ya-Ping Zhang, Dong-Dong Wu
1 State Key Laboratory of Genetic Resources and Evolution, Kunming Institute of Zoology, Chinese Academy of Sciences, Kunming,Yunnan, 650223, China
2 Center for Excellence in Animal Evolution and Genetics, Chinese Academy of Sciences, Kunming, Yunnan, 650223, China
3 Kunming College of Life Science, University of the Chinese Academy of Sciences, Kunming, Yunnan, 650223, China
4 KIZ-CUHK Joint Laboratory of Bioresources and Molecular Research in Common Diseases, Kunming Institute of Zoology, Chinese Academy of Sciences, Kunming, Yunnan 650201, China
5 Department of Ecology and Evolutionary Biology, Howard Hughes Medical Institute, University of California Santa Cruz, Santa Cruz, CA 95064, USA
6 Department of Laboratory Medicine and Pathobiology, University of Toronto, Toronto, Ontario M5S 1A8, Canada
7 Kunming Natural History Museum of Zoology, Kunming Institute of Zoology, Chinese Academy of Sciences, Kunming, Yunnan 650223,China
ABSTRACT The evolutionary and functional features of RNA editing are well studied in mammals, cephalopods,and insects, but not in birds. Here, we integrated transcriptomic and whole-genomic analyses to exhaustively characterize the expansive repertoire of adenosine-to-inosine (A-to-I) RNA editing sites(RESs) in the chicken. In addition, we investigated the evolutionary status of the chicken editome as a potential mechanism of domestication. We detected the lowest editing level in the liver of chickens,compared to muscles in humans, and found higher editing activity and specificity in the brain than in non-neural tissues, consistent with the brain’s functional complexity. To a certain extent, specific editing activity may account for the specific functions of tissues. Our results also revealed that sequences critical to RES secondary structures remained conserved within avian evolution. Furthermore, the RNA editome was shaped by purifying selection during chicken domestication and most RESs may have served as a selection pool for a few functional RESs involved in chicken domestication, including evolution of nervous and immune systems.Regulation of RNA editing in chickens by adenosine deaminase acting on RNA (ADAR) enzymes may be affected by non-ADAR factors whose expression levels changed widely after ADAR knockdown.Collectively, we provide comprehensive lists of candidate RESs and non-ADAR-editing regulators in the chicken, thus contributing to our current understanding of the functions and evolution of RNA editing in animals.
Keywords: RNA editing; Transcriptomics;Population genomics; Domestication; Evolution;Chicken
INTRODUCTION
RNA editing is an important post-transcriptional modification that increases transcriptome diversity and flexibility by selectively modifying RNA sequences (Schaub & Keller,2002). These sequence changes effectively alter transcript coding potential, alternative splicing, RNA folding, and RNA stability (Pullirsch & Jantsch, 2010). Moreover, RNA editing levels (ELs) vary dynamically during development and widely between tissues (Tan et al., 2017; Wahlstedt et al., 2009; Ye et al., 2017) from 0% to 100%. In contrast, for diploid organisms, allelic alterations affect 100% of allelic products and 50% of total gene products (Gommans et al., 2009; Wang et al., 2019). Thus, compared to the general all-or-nothing nature of genomic mutations, RNA editing occurs at a much lower evolutionary cost and promotes transcriptome plasticity for phenotypic variation — an adaptive response to selective pressure. Adenosine-to-inosine (A-to-I), the most prevalent type of RNA editing, converts adenosine into inosine in double-stranded RNA by adenosine deaminase acting on RNA (ADAR) enzymes. The evolutionary and dynamic landscapes of this type of editing are well characterized in mammals, cephalopods, andDrosophila(Duan et al., 2017;Graveley et al., 2011; Hung et al., 2017; Liscovitch-Brauer et al., 2017; Tan et al., 2017; Ye et al., 2017). Furthermore, Ato-I RNA editing is considered an essential driver of adaptive evolution, especially in brain development and function (Duan et al., 2017; Gommans et al., 2009; Graveley et al., 2011;Wahlstedt et al., 2009).
Domestication has greatly impacted the Earth’s biosphere and accelerated the development of agriculture and human society (Larson & Fuller, 2014), and is therefore a good model system for studying evolutionary processes (Meyer &Purugganan, 2013). However, the contribution of RNA editing to the domestication process has not yet been fully elucidated.As a species with an extant wild ancestor, i.e., red junglefowl(RJF), the chicken has been widely used to investigate vertebrate evolution (International Chicken Genome Sequencing Consortium, 2004; Siepel et al., 2005). Since the domestication from its wild ancestor (Liu et al., 2006), the chicken has evolved into numerous distinct breeds and phenotypes within a short divergence time (~9 500 years)( Guo et al., 2016; Wang et al., 2016, 2017, 2020; Xu et al.,2021). Considering the relatively small size of the chicken genome (~1 Gb), we speculated that RNA editing may provide an important source of phenotypic variation during chicken domestication. Although approximately 100 A-to-I RNA editing sites (RESs) have been identified in chickens (Frésard et al.,2015; Hung et al., 2017; Roux et al., 2016; Shafiei et al.,2019), the RNA editing profile is still far from complete. Limited knowledge regarding avian RNA editomes continues to hinder our understanding of the evolutionary status of RNA editing in the animal kingdom.
Here, based on transcriptomic and genomic data from domestic chicken (DC) and RJF populations, we investigated chicken RNA editing profiles and assessed spatial patterns and evolutionary functions during domestication. By comparing editing profiles across tissues, we found the lowest editing activity in the chicken liver. Furthermore, brain samples showed much higher editing specificity than non-brain tissues.Differential editing analysis and comparative population genomics identified several RESs that may be involved in chicken domestication, especially in brain evolution. We also uncovered potential co-regulation of chicken RNA editing by ADAR enzymes and non-ADAR factors.
MATERIALS AND METHODS
Ethics statement
All animal care and handling procedures followed the animal experimentation guidelines and regulations of the Kunming Institute of Zoology, Chinese Academy of Sciences (Yunnan,China). This research was approved by the Institutional Animal Care and Use Committee of the Kunming Institute of Zoology.
Collection and sequencing of RNA samples
RNA samples were collected from 12 different somatic tissues(i.e., eye, heart, kidney, liver, lung, muscle, spleen, and five distinct brain regions, including the cerebral cortex (CC),cerebellar vermis (CV), corpus striatum (CS), olfactory bulb(OB), and optic lobe (OL)) from 13 adult chickens and stored in RNAlater at -80 °C until use. The RNA was isolated using Trizol reagent (Invitrogen, USA) and an RNeasy Mini Kit(Qiagen, USA), then purified using magnetic oligo-dT beads and quality-checked using Nanodrop spectrophotometry and agarose gel electrophoresis. Paired-end libraries were constructed using a NEBNext®UltraTMRNA Library Prep Kit for Illumina®(New England Biolabs, USA) and sequenced on the Illumina HiSeq platform (USA) after quantification. We obtained approximately 5 Gb of raw data from each library,with an average read length of 150 bp.
Identification of RESs
For both the RNA sequencing (RNA-Seq) and DNA-Seq data,we trimmed adaptors and low-quality reads using fastp(v0.20.1) (Chen et al., 2018) with the parameters “-n 15 -q 20 -u 40 -e 20 --length_required 40 -p -w 2”. Filtered reads were aligned to the galGal6 chicken reference genome (available at http://ftp.ensembl.org/pub/release-104/fasta/gallus_gallus/dna/) using the BWA-MEM algorithm (Li, 2013) with default parameters. Based on the aligned bam files, we used REDItools2 (Flati et al., 2020) with the parameters “-S -s 0 -q 25 -bq 30 -os 4 -m -ss 4 -mrl 50 -mbp 6 -Mbp 6” and “-N -B -s 0 -q 25 -bq 30” to identify RESs in the RNA-Seq and DNA-Seq data. For each sample, a site was retained if it: (1) had a unique editing type; (2) was not a DNA variant, common single nucleotide polymorphism (SNP) (available at http://may2021.archive.ensembl.org/index.html), or SNP identified in our previous study (Wang et al., 2020); (3) contained edited reads ≥3 and DNA coverage ≥6; (4) was located outside“Splicing”, “Simple_repeat”, “Low_complexity”, or “Unknown”regions; and (5) showed a true editing probability significantly greater than 0.01 (false discovery rate (FDR)-correctedP<0.01, binomial test). Each candidate RES had to exist in at least half of the tissue replicates. As we used non-strandspecific RNA libraries, canonical editing events A-to-G and Uto-C were both defined as A-to-I. In total, 14 865 unique sites from merged datasets across tissues and populations were retained as putative RESs. Of these, 87% (12 874) belonged to the A-to-I type, higher than the A-to-I ratio obtained in other studies (Duan et al., 2021; Gardner et al., 2019; Porath et al.,2019; Ramaswami et al., 2013; Tan et al., 2017). As described previously (Ramaswami et al., 2013; Tan et al., 2017),assuming all non-A-to-I mismatches are false and all six mismatch types have an equal error rate, the FDR of our sites was (13%/5)/87%=3.0%. Functional annotation was performed with ANNOVAR (Wang et al., 2010) for all defined RESs.
For stringent control of data analysis, we also identified RESs using our previously developed pipeline (Wu et al.,2015; Ye et al., 2017). In detail, duplicate reads were marked using bam files from BWA-MEM alignment with Picard(v2.27.2, http://broadinstitute.github.io/picard/). DNA or RNA variant calling was then conducted using the“HaplotypeCaller”, “CombineGVCFs”, and “GenotypeGVCFs”tools in the Genome Analysis Toolkit (GATK, v4.2.6.1)(McKenna et al., 2010). We counted reads mapped to variants using SAMtools (v1.12) (Li et al., 2009) and discarded those with a base quality score less than 30 or mean read quality score less than 25. Sites were filtered using the same criteria as the REDItools2 pipeline. In total, 14 541 candidate RESs were obtained with an A-to-I ratio of ~86% (12 462). We intersected the RESs from both the REDItools2 and GATK pipelines and obtained 10 279 RESs, with the A-to-I ratio increasing to 94% (9 678). We confirmed the results based on the REDItools2 pipeline using the intersected RESs with values from GATK (Figures 1, 2; Supplementary Figures S1,S2 and Tables S1-S3) and detected higher sensitivity from the REDItools2 pipeline than the GATK pipeline. For instance,the tissue-specific RESALDOC-A844G was filtered out in the GATK pipeline as there was one altered DNA read in an individual, despiteALDOC-A844G passing the criteria for tissue-specific RES identification (Supplementary Figure S2G,H). Thus, we performed further analyses based on the REDItools2 dataset.

Figure 1 Schematic overview of sample composition and data analysis procedures
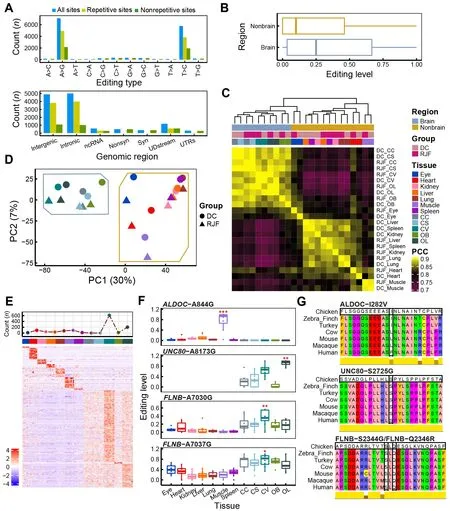
Figure 2 General features of A-to-I RNA editing sites (RESs) in chicken
Overall editing level (OEL) calculation
To calculate the OEL of an RES in a tissue from a population or in all samples, we pooled the mapped RNA reads of the RES across multiple samples belonging to the tissue of the population or across all samples. The OEL was defined as the ratio between all pooled reads supporting editing bases and total pooled reads supporting editing and reference bases. If the sum of pooled reads supporting editing and reference bases was less than five, the OEL for the site was defined as“NA”. For example, when computing the OEL for an RES in the eye of RJF, we first pooled all RNA reads mapped to this site across eye samples from RJF. Subsequently, we calculated the ratio of pooled editing reads to the sum of pooled editing and reference reads. This value was taken as the OEL for this RES in the eye of RJF. We similarly estimated OELs for each of the 12 somatic tissues from each population or for all 96 samples together.
Pearson correlation analysis and principal component analysis (PCA)
To determine the correlation of editing activity in tissue samples between the DC and RJF, we performed Pearson correlation analysis and PCA. First, the OEL of each tissue was calculated for both RJF and DC populations. Second, we removed A-to-I RESs with levels equal to “NA” in 12 or more tissues and imputed missing values for the remaining sites using the R package missForest (Stekhoven & Bühlmann,2012). Finally, Pearson correlation coefficients (PCCs) and principal components were estimated based on the completed level matrix using the “cor” and “prcomp” functions in R,respectively. The PCC heat map and PCA scatterplot were independently plotted using the “ComplexHeatmap” and“ggplot2” R packages.
Definition of tissue-specific RESs
To determine RESs specific to each of the 12 tissues, we first discarded A-to-I RESs based on the following criteria: (1)RESs with edited reads ≥3, EL≥0.1, and true editing probability significantly greater than 0.01 (P<0.01, binomial test) in more than half of the replicates; and (2) mean EL≥0.1(across all replicates for the tissue). We then performed the Wilcoxon rank-sum test between ELs for samples from a specific tissue and those from other tissues. We defined an RES as tissue-specific if its difference in mean EL between the tissue and other tissues was ≥0.1 and FDR-correctedPvalue was <0.05. Functional annotation was performed for each tissue using genes containing or flanking RESs preferentially edited in the tissue using the gprofiler2 R package (Raudvere et al., 2019), with genes expressed in the corresponding tissue as the background gene list.
Gene expression analysis
Trimmed RNA reads from fastp were aligned to the latest version of the chicken reference genome (galGal6) using HISAT2 (v2.2.1) (Kim et al., 2015) with options “-t --sensitive --no-discordant --no-mixed --dta”. Expression of genes was measured through StringTie2 (v2.1.4) with default parameters(Kovaka et al., 2019). The gene annotation file was downloaded from Ensembl (v104). Differentially expressed genes (DEGs) were identified using DESeq2 (FDR<0.05, foldchange≥1.5) (Love et al., 2014).
Exploration of potential editing regulators
The median EL for each of the 96 samples was obtained across all A-to-I RESs. Non-ADAR genes were screened out using the following criteria: fragments per kilobase of exon model per million reads mapped (FPKM) values ≥5 in no less than 60% of all samples and mean FPKM≥10. In total, 6 094 non-ADAR genes were retained for correlation analysis between expression levels and ELs. We built a robust linear regression model using the “rlm” function in R, with five covariates: i.e., mRNA expression values of three ADAR genes (ADAR,ADARB1, andADARB2), tissue, region, group,and individual.P-values were computed using the Wald test in the sfsmisc R package and FDR corrected. We considered genes with FDR-correctedP<0.05 as candidate editing regulators. Functional enrichment analysis was separately performed for the presumed negative and positive regulators using gprofiler2 with expressed genes across all 96 samples(FPKM≥1 in at least three samples and mean FPKM across all samples ≥1) as background.
Construction of lentiviral vectors
Vectors forADARRNA interference (RNAi) andADARB2overexpression were constructed by Shanghai GeneChem Co., Ltd. (China). In brief, three targetADARsequences (1#5’-GTGGGAGAGACTCGTACAGTT-3’, 2# 5’-GCGGATGG AGATGAGGCTGAA-3’, and 3# 5’-CAGCTACGCTGCTCAG TTTAA-3’) were cloned into the GV298 vector to construct three lentiviral RNAi vectors: i.e.,ADAR-RNAi1,ADAR-RNAi2,andADAR-RNAi3. The control was an unrelated sequence,“TTCTCCGAACGTGTCACGT”, inserted into GV298. TheADARB2transcript ENSGALT00000010993.6 was amplified using specific primer pairs: i.e., forward primer (F) 5’-AGGTCGACTCTAGAGGATCCCGCCACCATGACATCCGTC CTCGGCGG-3’/reverse primer (R) 5’-TCCTTGTAGTCCAT ACCCCCAGTCAGTAGAAACTGATCTTG-3’. The transcript was then inserted into the GV492 vector between the BamHI and AgeI sites to construct the lentiviral vectorADARB2-oexp to overexpressADARB2, with GV492 as the control.
Cell culture and lentiviral infection
The chicken embryonic fibroblast cell line UMNSAH/DF-1 (DF-1) was obtained from the Kunming Cell Bank, Kunming Institute of Zoology, and cells were cultured in Dulbecco’s Modified Eagle Medium/Nutrient Mixture F-12 (DMEM/F12)(BI, 01-172-1A). All media were supplemented with 10% heatinactivated fetal bovine serum (BI, 04-002-1A). The cell lines were maintained in a 5% CO2-humidified atmosphere at 37 °C. The DF-1 cells were infected with lentiviral vectors in three biological replicates for each condition. The multiplicity of infection (MOI) was 100, computed as:

At 96 h after infection, cells stably expressingADARandADARB2were selected by adding 2 ng/μL puromycin into the DF-1 culture for quantitative real-time reverse transcription polymerase chain reaction (qRT-PCR) confirmation and subsequent RNA-seq.
qRT-PCR assays
Total RNA was isolated from the cultured cells using TRIzol reagent (Invitrogen, 15596-026, USA) and an RNeasy® Mini Kit (50) (Qiagen, 74104, USA). First-strand cDNA was synthesized from 1 μg of total RNA using a HiScript® Ⅲ RT SuperMix for qPCR (+gDNA wiper) Kit (Vazyme, R323-01,China). qRT-PCR was performed using ChamQTMUniversal SYBR qPCR Master Mix (Vazyme, Q711-03). The comparative cycle threshold (Ct) method (2-∆∆Ctmethod) was utilized to quantify gene expression. Primers for qRT-PCR were as follows: internal controlGAPDH(F 5’-GCCCA GAACATCATCCCA-3’/R 5’-CGGCAGGTCAGGTCAACA-3’);ADARB2(F 5’-CGGGTAATGAGCCATAGAACA-3’/R 5’-TCACGCTAAAGCTGGGAGACT-3’); andADAR(F 5’-GCTTGATTCACAGACCGC-3’/R 5’-TGCTGGAGAACCTA TGCC-3’).
Identification of differentially edited sites (DESs)
DESs were identified for each of the 12 tissues between DC and RJF using Fisher’s exact test. Tissue and population were considered when identifying RESs. Thus, a site first needed to exist in the population with a mean EL≥0.01 and EL≥0.01 in more than half of the population samples. Then, for each retained RES, the following four variables were subjected to Fisher’s exact test, as described in Li et al. (2014): (1) number of pooled RNA reads supporting editing in RJF; (2) number of pooled RNA reads supporting reference in RJF; (3) number of pooled RNA reads supporting editing in DC; and (4) number of pooled RNA reads supporting reference in DC. A site was considered differentially edited between DC and RJF if its FDR-correctedP-value was <0.05 and difference in mean EL and OEL between the two populations was >0.05.
We used a similar pipeline to distinguish DESs between cells withADARknockdown orADARB2overexpression. An RES was considered to be present in a condition if its edited reads were ≥3 and true editing probability was significantly greater than 0.01 (P<0.01, binomial test) in more than half of the condition samples.
Flexibility analysis of RESs
To investigate the evolutionary status of chicken RESs, we retrieved regions under selection during chicken domestication from our previous study (Wang et al., 2020). RESs were first converted from the chicken genome version galGal6 to galGal4 using LiftOver in UCSC (http://genome.ucsc.edu/cgibin/hgLiftOver), and only sites with unique conversions were retained for downstream analysis. Selected regions were obtained relying on two outgroups (i.e.,G. g. murgha, GGM;G. g. jabouillei, GGJ) and chromosomes 1-28 (Wang et al.,2020). Thus, we estimated RES density for GGM and GGJ separately and only considered RESs located in chromosomes 1-28. RES density for regions under selection was defined as the number of RESs located in selected regions divided by total region length. A similar method was used to evaluate density of RESs located in regions not under selection, genome-wide (i.e., chromosomes 1-28), and randomly selected. Random regions (10 kb long) were selected from the whole genome using the “random” function in BEDTools (v2.30.0) (Quinlan & Hall, 2010). The number of random regions was determined according to the number of regions under selection for GGJ (1 816) and GGM (1 817),respectively. We repeated the random-region selections 500 times for both GGJ and GGM. One-samplet-test was used to determine whether real and random densities were significantly different. To estimate population genetic differentiation, fixation index (FST) values for each SNP were calculated using the 36 RJF and 702 DC genomes from our previous study (Wang et al., 2020). PhyloP scores based on 363 avian alignments (with reference to the chicken genome galGal4) were kindly donated by Prof. Guojie Zhang (Feng et al., 2020).
RESULTS
Characterization of chicken editome
We performed sequencing analysis of 96 RNA samples from 12 tissues (including seven non-brain tissues, i.e., eye, heart,kidney, liver, lung, muscle, and spleen, and five brain regions,i.e., CC, CV, CS, OB, and OL) obtained from 13 individuals in two populations (DC and RJF) (Figure 1A). Together with the whole-genome sequencing data from these individuals, we identified RESs in chickens using a state-of-the-art analytic pipeline (Figure 1B). A total of 12 874 candidate A-to-I RESs were found, including 15 of the 17 RESs previously validated by Sanger sequencing and pyrosequencing (Frésard et al.,2015; Roux et al., 2016) (Figure 2A; Supplementary Table S1). A-to-I RESs were primarily in the brain and located in repetitive intergenic and intronic regions (Figure 2A;Supplementary Figure S1A). Median EL was higher in the brain (25%) than in non-brain tissues (10%) (Figure 2B). RESs in the chicken liver tended to have the lowest EL(Supplementary Figure S1B). In contrast, human muscle is reported to have the lowest editing activity (Picardi et al.,2015; Tan et al., 2017). The tissue editing profiles of DC and RJF were highly correlated (Figure 2C). PCA separated samples between brain and non-brain tissues (Figure 2D, 30%primary contribution from first principal component (PC1),P<2.2e-16, Kruskal-Wallis test). PC2 also indicated differences between DC and RJF (P=0.005584, Kruskal-Wallis test), as did PC3 and PC4 (Supplementary Figure S1C,P=0.04965 for PC3 andP=0.000532 for PC4, Kruskal-Wallis test), implying the potential involvement of RNA editing in chicken domestication. Thus, our findings suggest that EL differences between populations were less than that between tissue types, not unexpected considering the short divergence time (~9 500 years) between DC and RJF (Wang et al., 2020).We further sought to identify sites predominantly edited in one tissue type, which may be closely associated with tissuespecific functions. In total, we identified 1 207 candidate tissue-specific RESs, of which ~69% (832/1 207) were highly edited in the brain (Figure 2E; Supplementary Table S1).Annotations of genes containing or flanking these sites indicated functional enrichment relevant to the tissue type.SiteALDOC-A844G was specifically edited in muscle and caused an I-to-V substitution at amino acid 282 of ALDOC(ALDOC-I282V), which is conserved in birds (Figure 2F, G).ALDOC is also implicated in muscle energy regulation (Wang et al., 2022). Here, three brain-specific sites,UNC80-A8173G,FLNB-A7030G, andFLNB-A7037G, led to non-synonymous mutations in the amino acids of their protein products (i.e.,UNC80-S2725G, FLNB-S2344G, and FLNB-Q2346R), which are highly conserved in vertebrates (Figure 2F, G).UNC80-A8173G was most highly edited in the OL.UNC80encodes a large subunit of the sodium-leak channel NALCN complex, which regulates membrane potential and basal excitability of neurons (Wie et al., 2020), and is involved in chicken vision evolution (Wang et al., 2016). BothFLNB-A7030G andFLNB-A7037G were most highly edited in the CV.FLNBis implicated in communication and signaling between the cytoskeletal network and cell membrane (Stossel et al., 2001). Mutations inFLNBcan cause skeletal abnormalities during development (Lu et al., 2007). All four of the above putative tissue-specific RESs are also edited in humans (REDIportal v2.0) (Mansi et al., 2021) or have been validated previously (Frésard et al., 2015; Roux et al., 2016).The much higher specificity of RNA editing in brain tissue compared to non-brain tissue could be attributed to the brain’s functional complexity. These results imply that the tissuespecific RESs may play a functional role in corresponding tissues.
To estimate the reliability of our results, we also identified RESs using the GATK pipeline as reported previously (Wu et al., 2015; Ye et al., 2017) and combined RESs from both the REDItools2 and GATK pipelines, increasing the A-to-I ratio to 94% (9 678/10 279) (see Methods section and Supplementary Table S2). We repeated the analyses,including sample correlation, PCA, and tissue-specific analyses, based on the shared RESs using the values from the GATK strategy. Most of the conclusions obtained using the REDItools2 strategy were validated using the stringent REDItools2-GATK-combination strategy (Figure 1B;Supplementary Figure S2). We identified 1 056 tissue-specific RESs based on the combined REDItools2-GATK dataset, of which 80% (844/1 056) were covered by tissue-specific RESs in REDItools2 alone.UNC80-A8173G,FLNB-A7030G, andFLNB-A7037G were still included, butALDOC-A844G was filtered out as there was one altered DNA read in an individual(Supplementary Figure S2G, H), suggesting higher sensitivity by REDItools2 than GATK. Therefore, we used the REDItools2 pipeline results in subsequent analyses. All results from both strategies are available in Supplementary Tables S1, S2.
ADARs and non-ADAR factors cooperatively regulate RNA editing in chicken
ADAR enzymes, including ADAR1, ADAR2, and ADAR3,corresponding to ADAR, ADARB1, and ADARB2 in chickens,primarily mediate A-to-I RNA editing (Nishikura, 2010). In mammals, ADAR1 and ADAR2 promote RNA editing, while ADAR3 inhibits editing activity (Tan et al., 2017). However,many other factors in addition to ADAR proteins have been found to regulate RNA editing globally or site-specifically,including RNA-binding proteins (RBPs) and ADAR-binding partners or modulators (Freund et al., 2020; Quinones-Valdez et al., 2019; Roth et al., 2019; Tan et al., 2017). To examine the catalytic activity of ADARs during chicken editing, we conducted loss- and gain-of-function experiments in chicken DF-1 fibroblast cells forADARandADARB2, respectively(Figure 3A, B; Supplementary Figure S3). Knockdown ofADARin DF-1 cells globally reduced editing activity(Figure 3D; Supplementary Figure S3C, G), and caused significant changes in the expression profiles of hundreds of genes (Figure 3C; Supplementary Figure S3H). Many of these DEGs are RBPs or ADAR interactors, with some reported to influence editing in human cells, such asMAK16,DKC1,
HSPD1,EIF3G,RRP9,EIF4B,NELFE, andNAA15(Freund et al., 2020; Quinones-Valdez et al., 2019; Roth et al., 2019).Overexpression ofADARB2in DF-1 cells did not markedly alter EL (Figure 3D; Supplementary Figure S3C, D) or gene expression (Figure 3C; Supplementary Figure S3E), possibly becauseADARB2is specifically expressed in the chicken brain (Supplementary Figure S3F) and has a limited functional network in DF-1 cells. Nonetheless, the large impact ofADARknockdown on the expression of other genes suggests a complex co-regulation between ADAR and other factors.Therefore, we speculate that the regulation of RNA editing by ADAR enzymes in chickens may also be affected by some other unknown regulatory factors.
To search for non-ADAR genes that may regulate RNA editing in chickens, we performed correlation analysis between gene expression and EL using a robust linear regression model. We identified 33 and 155 genes whose expression levels were positively and negatively correlated with RNA editing activity, respectively, with 93% (174/188)validated by the combined REDItools2-GATK results(Supplementary Table S3). Functional annotation revealed enrichment of genes related to enzymatic activity, protein transport, and small-molecule metabolism (Figure 3E).Approximately 20% of the non-ADAR candidates showed marked expression changes uponADARknockdown,including the top three changed genes, i.e.,GPT2,ACAT2,andGPR146, while onlyGPR146expression was significantly altered uponADARB2overexpression (Figure 3C, F;Supplementary Figure S3E). Four negative candidates,ACO1,FUBP3,ACOX1, andIDH1, have been reported as editing regulators in humans (Quinones-Valdez et al., 2019; Tan et al., 2017).ACO1encodes aconitase 1, a cytosolic RBP that regulates cellular iron levels by affecting the translation or stability of iron-associated protein mRNAs (Oskarsson et al.,2020). Knockdown ofACO1can significantly increase RNA editing activity in the human cell line HepG2 (Quinones-Valdez et al., 2019).FUBP3encodes far upstream element binding protein 3, an RBP that influences gene expression through transcriptional or translational regulation (Shuai et al., 2021).Knockdown ofFUBP3in human cell lines HepG2 and K562 can significantly decrease and increase RNA editing levels,respectively (Quinones-Valdez et al., 2019). BothACOX1andIDH1are negatively correlated with RNA editing activity in humans, as determined by large-scale analysis of GTEx datasets (Tan et al., 2017). These results suggest that ADAR enzymes, especially ADAR, may regulate RNA editing in chickens, with the potential involvement of non-ADAR regulators.
Implication of RESs in chicken domestication
To investigate the evolutionary features of chicken RESs, we first compared the distribution density of RESs and their OELs across different chromosomes. The editing activity of repetitive RESs was significantly higher in the rapidly evolving macrochromosomes (chromosomes 1-5) and sex (Z/W)chromosomes (Zhang et al., 2014) than in the microchromosomes (chromosomes 6-28), with no differences in site density (Figure 4A). Non-repetitive RESs were predominantly located in the microchromosomes, with lower OELs than found in the sex chromosomes. Comparing densities of RESs under or beyond selection during chicken domestication, based on our previous research on chicken origin and domestication (Wang et al., 2020), we found that RESs were significantly less likely to be located within regions under selection than those located outside selected regions or in genome-wide and randomly selected regions (P<2.2e-16 for GGJ andP=7.533e-05 for GGM, one-samplet-test)(Figure 4B). We found no significant differences in RES density between whole-genome and random regions(P=0.9296 for GGJ andP=0.5259 for GGM, one-samplettest). This suggests that RESs tend to be maintained by purifying selection, as reported in primates (Chen et al., 2014),and most RESs act as a selection pool for a few functional RESs (Chen et al., 2014; Gommans et al., 2009).
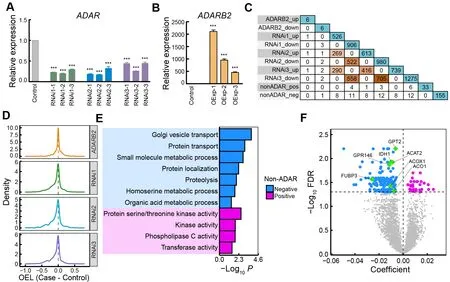
Figure 3 Contributions of ADARs and non-ADAR regulators to RNA editing
To detect RESs potentially involved in chicken domestication, we identified DESs between DC and RJF for each of the 12 tissues. In total, we obtained 1 713 DESs across all tissues, with most of these occurring in the brain(Figure 4E; Supplementary Table S1). To validate these results, we additionally identified 1 129 DESs based on RESs from the combined REDItools2-GATK pipeline and found that 81% (917/1 129) of the DESs were covered by the REDItools2 strategy (Supplementary Table S2), showing high analytical robustness. We detected higher editing activity in RJF than in DC and approximately 65% of all DESs showed decreased OELs in DC (Supplementary Figure S4A, B). There were 1 282 unique sites among these DESs, mainly located in intergenic, intronic, and upstream/downstream regions(Supplementary Figure S3D). To estimate the evolutionary characteristics of RESs and their local sequences crucial for RNA editing regulation, we usedFSTvalues from our previous study (Wang et al., 2020) and phyloP scores from wholegenome alignments of 363 birds (Feng et al., 2020). As expected, there was a higher degree of population differentiation between DCs and RJFs near DESs compared to non-DESs (NDESs) (Figure 4C; Supplementary Figure S5).RES flanking loci (±200 bp) exhibited higher phyloP scores than further loci and RESs themselves to form a peak,especially in intergenic, intronic, exonic, and upstream/downstream regions (Figure 4D; Supplementary Figure S6). This pattern was more obvious for DESs than NDESs. Interestingly, we also found a higher fraction from nonsynonymous or regulatory (i.e., upstream/downstream and UTRs) locations in DESs than in NDESs (Figure 4E).Functional annotation analysis showed that genes containing or flanking DESs were enriched in pathways related to tissue functions (Supplementary Figure S4C). For example, DESs in the heart and spleen were from genes regulating heart contraction and immune response, respectively, while DESs in the brain were from genes involved in the nervous system.CHRNG-A745G showed significantly higher ELs in the eye and muscle of RJF than of DC, which led to the nonsynonymous amino acid substitution CHRNG-I249V(Figure 4F). Genetic mutations inCHRNGare associated with myopia and multiple pterygium syndrome (Carrera-García et al., 2019; Tideman et al., 2016).TEPSIN-A1643G was overedited in the CV and OB of DC compared to RJF, which led to the nonsynonymous mutation TEPSIN-Q548R(Figure 4F).TEPSINencodes the accessory protein of the adaptor protein 4 (AP-4) complex involved in brain disorders,including cerebral palsy and hereditary spastic paraplegia(Ebrahimi-Fakhari et al., 2020; Moreno-De-Luca et al., 2011).We validated the editing patterns ofCHRNG-A745G andTEPSIN-A1643G using the combined REDItools2-GATK dataset (Supplementary Figure S4E). Taken together, these results suggest that the RNA editome was shaped by purifying selection during chicken domestication. Sequences essential for RES secondary structures were conserved during avian evolution and their genetic mutations in DC tended to reduce RNA editing activity. Nonetheless, a few functional RESs may have been recruited from the RES pool to play important roles in chicken domestication, such as immune and nervous system development.
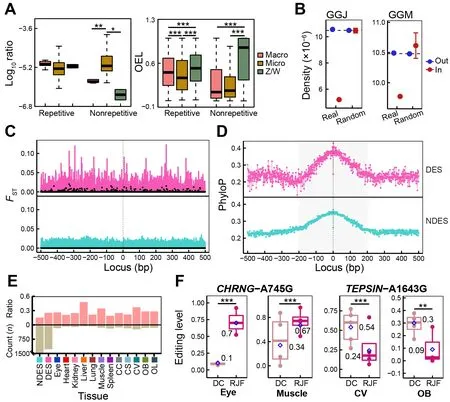
Figure 4 Evolutionary status of chicken A-to-I RESs
DISCUSSION
In this study, we established the chicken RNA editing repertoire and explored its functional and evolutionary landscape using integrated transcriptomic and genomic data.To the best of our knowledge, this is the most comprehensive dataset on RNA editing in the chicken, and the RESs and non-ADAR-editing regulators provide timely data sources for studies on the functions and evolution of RNA editing in animals.
We analyzed the general features of RESs and their ELs and found highly correlated editing profiles across tissues between DC and RJF. The PCA results showed differences in editing activity between brain and non-brain tissues, as well as between populations. Our analysis also indicated that editing activity in chickens may be regulated by ADAR in cooperation with non-ADAR regulators. Furthermore, we identified hundreds of RESs with significant editing differences between DC and RJF and higher proportions from regulating/recording locations than NDESs. We also observed a low RES ratio under selection and suppressed editing activity during chicken domestication. These findings imply that chicken RESs were shaped by purifying selection and served as a selection pool for a few functional RESs involved in chicken domestication.Moreover, the chicken brain had the largest number of RESs and much higher editing activity than non-brain tissues.Tissue-specific and differential editing analyses also revealed much higher specificity and population differences in RNA editing in the brain, suggesting a potentially critical role of RNA editing in the functional complexity and evolution of the chicken brain. Indeed, RNA editing is related to brain development and damage in mammals (Behm & Öhman,2016; Hwang et al., 2016) and is also hypothesized to drive human brain evolution (Li & Church, 2013), with evolutionary divergences in RNA editing found in human, chimpanzee, and macaque brains (Li & Church, 2013). Previous genomic scanning analyses of chickens have also shown that genes with positive selection signatures are more significantly enriched in cognitive function, nervous system, and neurodevelopment (Guo et al., 2016; Wang et al., 2016,2017). Here, we hypothesize that RNA editing contributed to the successful domestication of the chicken by modulating physiological and psychological changes in RJF, e.g.,reducing sensitivity, mobility, and fear of humans.
The current study has several limitations. First, due to the difficulty in RJF sampling, our data cannot explain how highly differentiated genomic mutations/SNPs between DC and RJF potentially produce different editing activity in the DESs of the two populations. Furthermore, many of our samples were taken in the wild and could not been stored under ideal laboratory conditions, which may reduce sample quality and accuracy in RES calling, especially for non-brain tissues with low editing activity (Supplementary Table S1). Thus, we did not include hyper-editing sites in our chicken RES spectrum,and our dataset may not precisely represent the entire landscape of RNA editing in the chicken. Second, due to technical limitations, such as silencing efficiency and potency and sequencing depth and accuracy, different levels of effectiveness were found between treatments with different RNAi vectors (Supplementary Figure S3). For example, there were 194, 165, and 138 DESs for theADAR-RNAi1,ADARRNAi2, andADAR-RNAi3 vectors, respectively, including 55 common DESs (Supplementary Figure S3G), while the three RNAi vectors had similar gene expression trends, with the shared DEG ratio ranging from 40% to 72% (Figure 3C;Supplementary Figure S3H). Furthermore, while the RNA-seq data did not show significantly decreased expression ofADARinADAR-RNAi3 (Supplementary Figure S3A), the qRT-PCR results did (Figure 3A). Third,ADARB2showed brain-specific expression (Supplementary Figure S3F), butADARB2overexpression did not significantly alter editing or gene expression in DF-1 cells (Figure 3C, D; Supplementary Figure S3C-E), implying thatADARB2has limited function in cell lines and may only affect RNA editing in the brain.Unfortunately, we were unable to obtain and culture chicken neural cells to validate the specific functions of ADARB2 in brain editing. Future efforts to increase sample size, improve sequencing depth, and optimize sampling and RES identification processes should facilitate our understanding of the RNA editing landscape in chickens. In addition, further studies are needed to explain how ADAR and non-ADAR regulators collectively regulate editing in chickens and to establish whether ADARB2 influences editing in the chicken brain, and if so, by what molecular mechanisms.
In conclusion, we characterized the main RNA editing landscape and its potential involvement in chicken domestication. Our results provide important preliminary insight into the functional and evolutionary features of RNA editing in chickens.
DATA AVAILABILITY
The RNA sequencing data were deposited in the NCBI database (BioProject accession: PRJNA562117) and GSA database (BioProject accession: PRJCA012006). The wholegenome data were from our previous study (Wang et al.,2020), deposited in the Chicken SNP Database (ChickenSD)at http://bigd.big.ac.cn/chickensd/. The gene expression matrices in FPKM are available at the Science Data Bank database (Data doi: 10.57760/sciencedb.j00139.00042). Wellannotated lists of chicken candidate RESs and non-ADARediting regulators are also provided in Supplementary Tables S1 and S3, respectively.
SUPPLEMENTARY DATA
Supplementary data to this article can be found online.
COMPETING INTERESTS
The authors declare that they have no competing interests.
AUTHORS’ CONTRIBUTIONS
Y.P.Z., D.D.W., and Y.M.W. designed the study. M.S.W.collected samples. Y.M.W., L.Q.Y., and M.S.W. performed the data analyses. Y.M.W. wrote the manuscript. J.J.Z. performed the experiments related toADARknockdown andADARB2overexpression and wrote the corresponding methods.D.D.W., L.Q.Y., M.S.W., S.K., and D.M.I. revised the manuscript. X.D.R. deposited the sequencing data into NCBI.All authors read and approved the final version of the manuscript.
ACKNOWLEDGEMENTS
We are especially grateful to Prof. Guojie Zhang, Beijing Genomics Institute (BGI), Shenzhen, for donating the dataset of avian phyloP scores.
杂志排行

Zoological Research的其它文章
- Single-nucleus transcriptomic profiling of multiple organs in a rhesus macaque model of SARS-CoV-2 infection
- Animal models of Alzheimer’s disease: Applications,evaluation, and perspectives
- Dynamic coding in the hippocampus during navigation
- Optimization of sgRNA expression strategy to generate multiplex gene-edited pigs
- A glimpse into the biodiversity of insects in Yunnan: An updated and annotated checklist of butterflies(Lepidoptera, Papilionoidea)
- Chronic lithium treatment ameliorates ketamineinduced mania-like behavior via the PI3K-AKT signaling pathway