Anomaly detection of control rod drive mechanism using long short-term memory-based autoencoder and extreme gradient boosting
2022-11-21JingChenZeShiLiuHaoJiangXiRenMiaoYongXu
Jing Chen· Ze-Shi Liu· Hao Jiang · Xi-Ren Miao · Yong Xu
Abstract Anomaly detection for the control rod drive mechanism (CRDM) is key to enhancing the security of nuclear power plant equipment. In CRDM real-time condition-based maintenance, most existing methods cannot deal with long sequences and periodic abnormal events and have poor feature extraction from these data.In this paper,a learning-based anomaly detection method employing a long short-term memory-based autoencoder (LSTM-AE)network and an extreme gradient boosting (XGBoost)algorithm is proposed for the CRDM. The nonlinear and sequential features of the CRDM coil currents can be automatically and efficiently extracted by the LSTM neural units and AE network. The normal behavior LSTM-AE model was established to reconstruct the errors when feeding abnormal coil current signals. The XGBoost algorithm was leveraged to monitor the residuals and identify outliers for the coil currents. The results demonstrate that the proposed anomaly detection method can effectively detect different timing sequence anomalies and provide a more accurate forecasting performance for CRDM coil current signals.
Keywords Anomaly detection · CRDM · LSTM-AE ·Residuals · XGBoost
The control rod drive mechanism (CRDM) [1] is the only movable equipment unit in the reactor pressure vessel and actuator of the reactor control and nuclear safety protection system.The reactor relies on the CRDM to pull the control rod to realize reactor start-up, power regulation,reactive compensation, and safe shutdown. A pressurized water reactor (PWR) nuclear power plant (NPP) adopts a magnetic lifting drive mechanism that relies on coil power to realize control rod action. The control rod moves stepby-step through the alternating action of the three sets of coils in the driving mechanism[2].Each step requires close cooperation between the three sets of coils and hook claw.If a slight error occurs, failure to pull, drop, or lift may occur. Therefore, it is of significant value to investigate how to improve the CRDM abnormal detection performance.
Recently, the state parameters used for abnormal detection of control rods are predominantly vibration signals, structural noise and inductance values. In actual control rod operation, each action will produce characteristic acoustic signals related to the moving parts. The operation [3] and wear [4] of the CRDM can be judged using acoustic-sensitive sensors and instruments, which provides an effective means for CRDM performance monitoring and fault analysis.Caylor et al.[5]proposed an abnormal detection method of the CRDM based on the principle of structural noise detection. The structural noise was obtained by the sensor, and the signal was analyzed and processed to determine the fault.Fault diagnosis based on structural noise provides a new fault detection method for the monitoring and maintenance of CRDM in nuclear reactors. In addition, because the air-gap magnetomotive force is proportional to the equivalent length of the flux path, the air-gap length changes significantly when the actuator is eccentric [6], resulting in a change in the coil flux and the inductance value of the control rod coil is affected [7]. Xie et al. [4] proposed a new method for the state detection of CRDM action components by on-line measuring the coil inductance value and realized state detection of CRDM action components. Ling et al. [8]proposed a model feature-based flow field fusion simulation method applied in CRDM. The research obtained a fusion simulation result of the CRDM through the hierarchical structure of the function-motion-action method,which presented a new concept for CRDM anomaly detection. The aforementioned research on CRDM anomaly detection can only judge the action component fault,and the CRDM mainly transmits the signal through the current during the operation process. To accurately obtain the characteristic information of the operation process,it is necessary to study the operation current signal detection method.
An increasing number of applications involving machine learning in the nuclear energy field are being implemented owing to its advantages of rapidly processing large amounts of data, analyzing and extracting effective information,etc.Chen et al.[9]designed a neural network accelerator to efficiently extract amplitude and time information from row-by-line pulses. Ma et al. [10] used the LSTM model to achieve optimal estimation of nuclear pulse parameters. However, development in machine learning has been slow in nuclear energy anomaly detection. In other fields, it has been widely used for conditions monitoring [11], fault diagnosis [12], and anomaly detection [13] . The effective perception of periodic and nonlinear change characteristics of time-series data has become a key factor in the effectiveness of various fault detection and diagnosis models. Traditional anomaly detection algorithms such as Gaussian anomaly detection[14, 15], SVM [16, 17], KNN [18, 19], PCA [20, 21] and isolation forest [22,23]do not consider anomaly detection in time series. Reference [24] used a competitive neural network to establish a prediction model of time series using historical data and judged whether there was an anomaly by comparing the difference between predicted and actual data. Yan et al. used this concept to establish a time-series state model, and clustering to map the time series to different discrete states,and used the statistical state transition probability to mine outliers. However, the discrete state modeling method loses a lot of data information and is overly reliant on the clustering results. Ergen et al. [25]used a new recurrent neural network model LSTM to model the sequence. This model can capture the relationship between sequences well;however,it is too complex to meet real-time requirements. Moreover, owing to the gradient disappearance problem, the modeling effect of long sequences is poor. Currently, most methods compare the difference between the predicted and actual data to determine abnormality. The hypothesis test data were subjected to a normal distribution[26],and the 3 σ criterion was used for discrimination. This type of method ignores the real distribution of data and errors in small datasets.
This study proposes an anomaly detection algorithm based on LSTM-AE and XGBoost[27]for the coil current of a CRDM.Hence,this research realizes CRDM anomaly detection under various abnormal conditions and accurately obtains CRDM characteristic information by monitoring the CRDM coil current signal.The proposed method utilizes the LSTM-AE neural network to automatically extract the nonlinear and sequential features of the coil currents and builds a normal behavior model to reconstruct the residual under abnormal conditions. Long series and periodic historical current data can be handled and predicted using the LSTM-AE model. The XGBoost classification algorithm is employed to identify outliers in the reconstructed errors and avoid defects in hypothesis testing. The long series and periodic CRDM coil currents can be accurately predicted and detected by the generalization and classification ability of the proposed method.
2 Working principles of CRDM
The CRDM is primarily composed of a drive shaft,coil,armature,gripper,and other components[28].As shown in Fig. 1, each control rod contains one lift coil (LC), movable coil (MC), and stationary coil (SC). The three groups of electromagnetic coils turn on and off alternately according to a certain time sequence, and the armature action is lifted,moved,and stabilized to achieve the rise or fall of the control rod. Therefore, the coil current size, onoff time sequence, and current sequence response of the hook claw action are extremely important for the mechanism action.

Fig. 1 (Color online) Structure of CRDM
According to the lifting and insertion control signals shown in Fig. 2a,b,the control rod is lifted or inserted into the reactor core through the CRDM step motion sequence.The CRDM coil operates at three voltage levels:high,low,and zero. After the coil was electrified, a low voltage was generated on the SC to ensure the control rod remained in a fixed position.A high voltage was applied to the LC to start the motion of internal magnetic components. This initial motion causes the internal clearance between the magnetic components to close,thereby lifting the control rod.Subsequently,a low voltage was applied to the coil to ensure the gap remained closed,allowing the locking device to connect.The current was removed from the coil to allow gap opening and load transfer to the locking device.This control sequence enables the CRDM to move the control rods during and insertion actions.Figure 2c,d shows the coil current curve during the lifting and insertion actions,respectively.
As shown in Fig. 3,the current curve of a SC is divided into six stages described as follows.
1. Zero current stage:at this stage,the coil current is zero,and the coil is in an open state.
2. Initial electrification stage: at this stage, the coil current begins to increase. Because the coil is an inductive load, the current slowly increases. After which, the electromagnetic force gradually increases.When the coil current does not increase to a certain degree, the magnetic force is small and does not produce action.
3. Back ditch stage: when the electromagnetic force increases to a certain extent with the current, the gripper moves and the current continues to increase.The magnetic gap on the upper magnet decreases, and the lifting force increases.However,the position of the coil changes during the action, and therefore, the corresponding magnetic flux becomes smaller,and the coil inductance becomes larger, which leads to a decrease in current and produces a return channel during the dynamic current change.
4. When the action is complete, the position of the hook claw and inductance of the coil no longer change, and the coil will form a transient steady state. Under this state,the current continues to rise to the inductive load to charge the current slowly until it stabilizes and reaches its peak.

Fig. 2 Timing sequence and current waveform for lift and insertion motion

Fig. 3 Stationary coil current
5. High-level stage:at this stage,the coil is in a clamping state.
6. Low-level stage:the control signal is that the low-level current slowly drops into the low current, and the coil is in the clamping state.
Abnormal data contain types of anomalies common in CRDM operations.Figure 4a shows the abnormal current size,and the fault of the CRDM current control circuit causes the output current to deviate from the set value.Excessive current may cause the coil to overheat,and a current that is too small may cause the armature to be unable to move.Figure 4b shows the non-action point anomaly. If there is no pit in the rising section of the current,it can be confirmedthat the corresponding clawdoesnotact.Thisanomalycaneasilyleadtostick-slip.The anomaly shown in Fig. 4c represents the backward movement of the action point.The moving step requires seven actions and cohesion between the stationary gripper,movable gripper,and liftarmaturetocooperateclosely.Aslighterrormayleadtopull,drop, or lift failure. Figure 4d shows slow current rise. As a result,the action point of the armature lags behind,and it is easy to pull or slide the rod and scratch the drive shaft.
Based on the aforementioned analysis, the CRDM coil current information contains the control rod action information. Accurate real-time extraction of coil current characteristics is the key to achieve CRDM abnormal detection. A schematic of the proposed anomaly detection method is shown in Fig. 5. The normal coil current operation data were used as input for the LSTM-AE model for feature learning,and the normal behavior model(NBM)was trained.The NBM represents the dynamic relationship between variables. When the data were normal, the output of the model was the same as that of the actual result.When an abnormality occurred, the output of the model differed significantly from the input data. When the NBM model was established,the abnormal data were entered into the NBM test to obtain the reconstruction error, and the XGBoost algorithm was used to detect the outliers. The detailed process of anomaly detection using the proposed LSTM-AE and XGBoost approach is described below.
First, the coil current signal of the control rod drive mechanism during actual operation was collected, and the data were cleaned to obtain normal data.Second,based on the LSTM-AE algorithm, the NBM model was established using normal data.Finally,the abnormal coil current signal was used as the input of the trained normal behavior model,and the residual of the model reconstruction was obtained.Abnormal point detection of the control rod coil current was completed as the input for the XGBoost algorithm.
3 LSTM-AE neural network
3.1 The LSTM network

Fig. 4 CRDM coil current anomaly type. a Abnormal current size. b Backward movement of the action point. c Non-action point anomaly.d Slow current rise

Fig. 5 (Color online) Schematic diagram of CRDM anomaly detection using LSTM-AE and XGBoost
The LSTM model is a type of time-cycling neural network that contains three parts:the input layer,output layer,and hidden layer.LSTM can effectively address time-series learning problems. Its structure is illustrated in Fig. 6.
LSTM has three gated structures to control the state of the cell, namely the forgetting gate, the input layer gate,and the output layer gate. The input and output gates control the memory cell input and output activation. The forget gate updates the state of the cell. The storage cell update is given by the following equation:

where i indicates the input gate,o is the output gate,f is the forgetting gate, ftindicates the state of the cell at the previous time, stindicates the memory cell, htindicates the final output, and ⊗represents the element-wise multiplication.wxf,whfand bf are the neuron weights of ft.wxi,whiand bi are the neuron weights of it.wxg,whgand bg are the neuron weights of gt.wxo,who,bo are the neuron weights of ot.
3.2 The LSTM-AE neural network

h(t-1)iis the output state vector of the first decoding unit at t-1. xtidenotes the input vector. W, R is the m×dm×m-order coefficient weight matrix. Function k(.) is typically set as the ‘tanh’ activation function. By entering each column vector in xiin the encoder section,the output is as follows:

3.3 XGBoost
The XGBoost algorithm integrates several CART trees.XGBoost is an optimized distributed gradient-liftingalgorithm. The main advantages of this algorithm are its efficiency,flexibility,and portability to other systems.The superior performance of XGBoost in supervised machine learning is the reason for choosing it to train the coil current anomaly classification in this context.
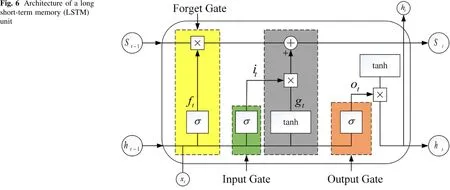
Fig. 6 Architecture of a long short-term memory (LSTM)unit
The XGBoost structure is shown in Fig. 8. In each algorithm iteration, residual errors are used to modify the previous classifier and optimize the loss function,which is given by

Fig. 7 Structure of LSTM-AE neural network

where γ denotes the complexity of the leaf. T indicates the number of leaf nodes. λ denotes the penalty factor. w denotes the fraction vector.Assuming that the loss function is the mean square error, the objective function can be obtained as follows:

Fig. 8 Structure of XGBoost

q(.) represents a function that assigns data points to the corresponding leaf nodes, girepresents the first derivative of the loss function,and hirepresents the second derivative.The loss function can be expressed as the sum of the loss values of leaf nodes.

Ijrepresents all the leaf node data. Therefore, the optimization of the objective function is equivalent to determining the minimum quadratic function.
4 Results
The experimental data were obtained from nuclear power plant 1-4 megawatt-class pressurized water reactor nuclear power (NPP) units. In the cold CRDM requalification test of this NPP, we collected and stored the LC,MC, SC currents, and vibration data through the RGL system. In this study, we conducted an anomaly detection investigation on the CRDM with an SC current as the research object. Based on the staff operational reports during the test, this experiment collected 20 cycles of normal coil current data as a sample set, with each cycle lasting 792 ms. During the construction of the LSTM-AE model, 80% of the sample set (16 cycles of normal coil data) was used as the training set and 20% (four cycles of normal coil data) was used as the test set. Four types of typical anomalies appeared in the control bar card Shibboleth report during the test process. In this study, four types of anomalous coil currents were selected as the validation set of the LSTM-AE model, where each type of anomalous data contained four cycles.To enhance training efficiency of the deep learning model, all data were normalized between 0 and 1.
4.1 NBM based on LSTM-AE
In this case, the NBM of an induced CRDM was established using an LSTM-AE neural network with an SC current as the model input. Normal operational data were obtained based on the operational log. Twenty cycles of observations were obtained from the sample. All datasets were standardized,and the ratio of the training and test sets was 8:2. To demonstrate the effects of the established NBM model. Figure 10 describes the reconstruction result of NBM based on the LSTM-AE model.It can be observed that the curves of the reconstructed sample and that of the raw sample are almost coincident. This indicates that the established NBM can reconstruct the normal samples well.
In the LSTM-AE training process, the time step and number of hidden layers are important parameters. These determine the effects of NBM. The evaluation metrics for different combinations of these two parameters are shown in Fig. 9. Increasing the number of time steps and hidden layers will lead to a waste of training resources; therefore,the number of time steps is set from 0 to 10, and the number of hidden layers is set from 2 to 14. The results show that fewer time steps can improve the performance of the model when the number of implied layers is extremely small. The model performs best when the time step is greater than 0 and the number of implied layers is greater than 6.The evaluation metrics for both the training and test sets were extremely low. This indicates that the model has a relatively high degree of generalization and accuracy.The final structure with a time step of 6 and 10 implied layers is chosen, at which point the model has the lowest RMSE and MAPE metrics.
The NBM constructed by the LSTM-AE neural network can reconstruct normal samples well; however, it cannot reconstruct abnormal samples, which is the main reason why the reconstruction error can effectively distinguish normal from abnormal samples.
In this study, the experiment proved the rationality of the reconstruction error. Figures 11 and 12 describe the reconstruction result and error curves under normal and four abnormal conditions. Figure 11 describes the reconstruction result and error curve of the normal samples.Under normal circumstances, the NBM model has high reconstruction accuracy,and the reconstruction error of the sample is below 0.05. However, the change in parameters leads to an increase in the reconstruction error when an anomaly occurs, and the reconstruction errors under the four abnormal conditions are all greater than 0.06. Figure 12 describes in detail the reconstruction accuracy of samples in four common anomalies, compared with Fig. 11, the reconstruction accuracy of the sample is reduced. Thus, compared with normal samples, anomaly samples are more difficult to reconstruct using the NBM.The aforementioned experimental results prove that the reconstruction error obtained by the NBM can significantly reflect the difference between normal samples and anomalies.Thus,it is reasonable to treat the reconstruction error as an efficient feature for anomaly detection.

Fig. 9 (Color online) The performance of the LSTM-AE model on difference combination. Red box indicates the best combination

Fig. 10 Reconstruction precision of NBM based on LSTM-AE model

Fig. 11 Example for reconstruction with normal condition. a Reconstruction precision. b Reconstruction error
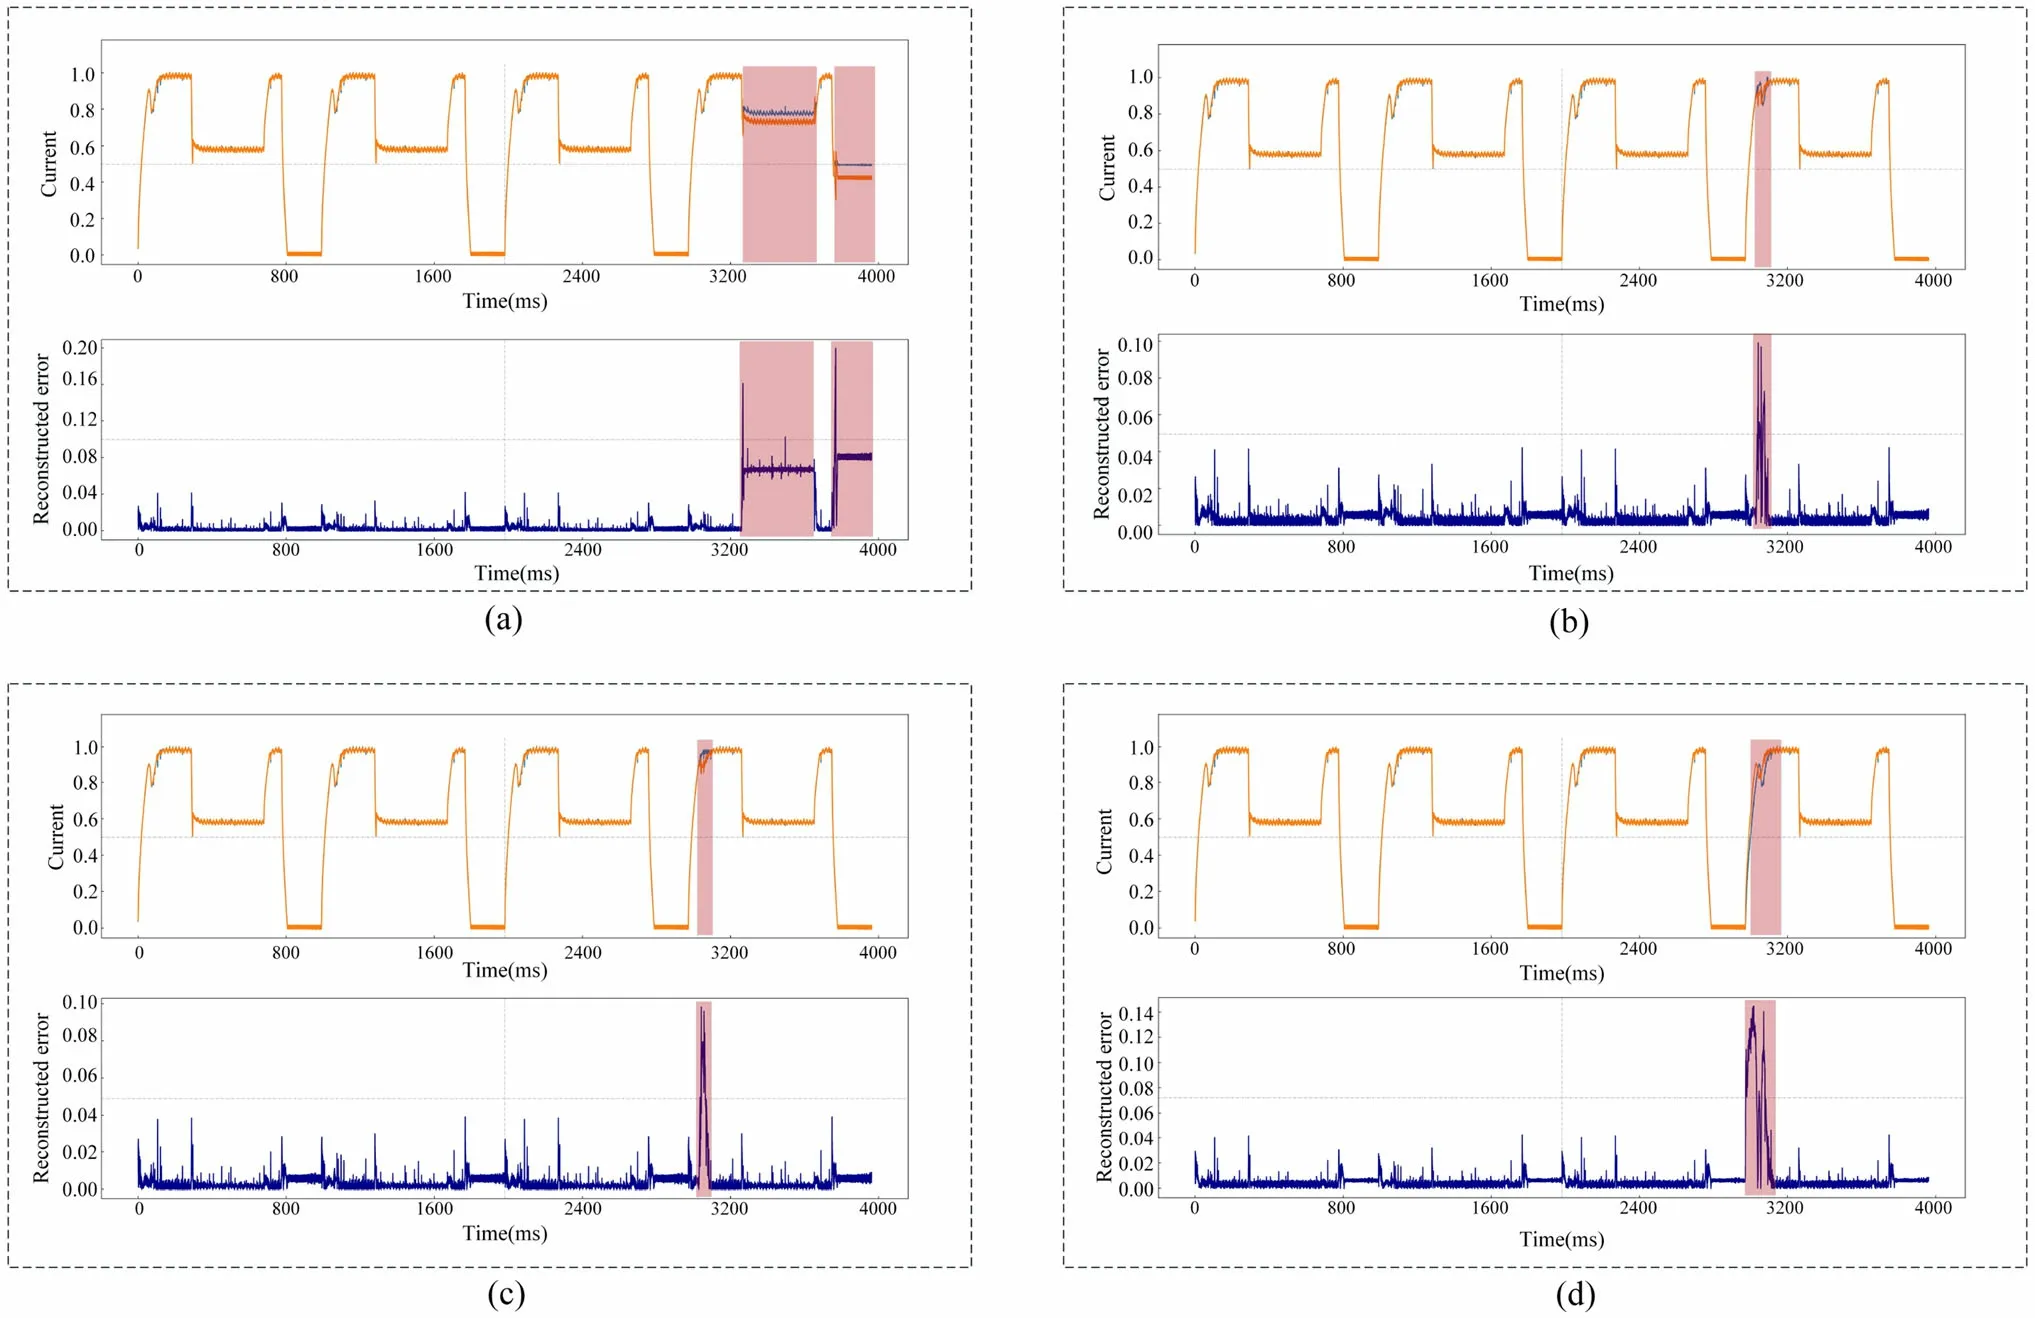
Fig. 12 Example for reconstruction with four different anomalies.a Reconstruction precision and error under abnormal current size.b Reconstruction precision and error under the non-action point anomaly. c Reconstruction precision and error under the backward movement of the action point. d Reconstruction precision and error under slow current rise

Fig. 13 Detection results of XGBoost. Red points represent detected outliers. a Abnormal current size. b The non-action point anomaly. c The backward movement of the action point.d slow current rise
4.2 Anomaly detection based on XGBoost
Because the LSTM-AE model training data are normal coil currents, anomalous reconstruction errors were obtained when the validation set containing anomalous data was input to the trained model. Owing to limited anomaly data in the cold CRDM requalification test,we set the anomaly data with a small amount of noise to obtain 2400 anomaly reconstruction error data, each of which contained 400 data,where each data contained four cycles.These anomalous reconstruction error data were used as the sample set for XGBoost,with 70%of the sample set as the training set, and 30% as the test set. The reconstruction error obtained by the NBM was input into the XGBoostanomaly detection algorithm as the final feature, and four common anomaly detection results were obtained. Figure 13 shows an example of detection results for four common anomalies, and red points represent the detected outliers. It can be observed that significant outliers can be detected and contain some early and small anomalies.

Table 1 Detection errors with XGBoost for four different anomalies

Fig. 14 ROC curves of four different anomalies
This shows that it is reasonable to use XGBoost to detect abnormal reconstruction features. To better evaluate the performance of the anomaly detection algorithm,this study used the most common indicators to measure the performance of anomaly detection.Precision and recall are the two most commonly used evaluation indices for classification purposes. Precision represents the ratio of the correct total number predicted by the model to the total number predicted,and recall rate is the ratio of the correct total number to the actual target number.The correct total number predicted in the classification was the correct number of categories corresponding to the maximum probability.The precision and recall rate formulae are as follows:

The true positive(TP)is the number of correct predictions.The false positive(FP)is the number of predicted errors.A false negative (FN) is the number not detected. TP +FP denotes the number of correct predictions. TP +FN is expressed as the actual correct number.
Table 1 shows the accuracy and recall of the four anomaly detection methods. It can be observed that XGBoost has good precision and recall rates for the detection results of these four anomalies.To further validate the performance of the classification models. Figure 14 shows the receiver operating curve(ROC)under the four abnormal conditions characteristic curve.The transverse axis is the false positive rate(FPR)of the model,and the longitudinal axis is the true positive rate(TPR).It can be observed that the ROC curves in four abnormal cases are closer to the upper left of the twodimensional plane. This shows that XGBoost has good classification performance for outlier detection.
4.3 Comparison
Through the aforementioned experiments, the reasonability of the proposed anomaly method is proved. To verify the detection performance of the proposed method,three groups of comparative experiments were performed in this study. The first group of experiments verifies the prediction effect of the NBM based on the LSTM-AE model. The second group of experiments was designed to verify the performance of the XGBoost anomaly detection.
To demonstrate the superiority of the LSTM-AE method more clearly in establishing the NBM,the proposed method was compared with common reconstruction or prediction models.Comparisons between LSTM-AE,AE,LSTM,and ARIMA models are shown in Fig. 15.AE and LSTM-AE are reconstruction models, whereas ARIMA and LSTM are prediction models. The LSTM model adopts a two-layer structure;the number of neurons in the two layers is 32 and 64,respectively.The parameters p,d,and q of the ARIMA model were 10, 1, and 10, respectively. It can be observed that the AE neural network has the worst effect,the LSTMmodel has a better prediction effect than the ARIMA model,and the LSTM-AE model has a better reconstruction effect than the other three models. Table 2 lists the RMSE and MAPE of the four methods for the training and test datasets.Compared with the AE method, the LSTM-AE method reduced the RMSE by 96.51%and MAPE by 88.69%on the training dataset. Compared with ARIMA, the LSTM-AE method reduced the RMSE and MAPE by 77.55% and 76.51%,respectively,on the training dataset.Compared with LSTM, the LSTM-AE method reduced the RMSE by64.51% and MAPE by 56.95% on the training dataset.LSTM-AE was also significantly better than the remaining three methods on the test dataset.Consequently,the LSTMAE method can better establish the normal behavior model(NBM)of the CRDM coil current.

Fig. 15 (Color online)Comparison of forecasting performance between ARIMA,LSTM, AE and LSTM-AE model

Table 2 Comparison of error of different forecasting models
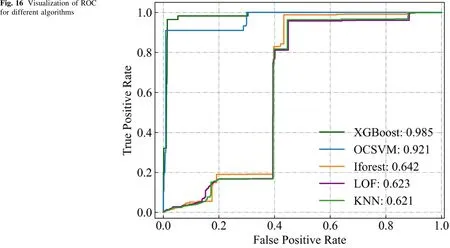
Fig. 16 Visualization of ROC for different algorithms

Table 3 Performance comparison of different classification algorithms
To further verify the performance of XGBoost anomaly detection, the proposed method was compared with common classification algorithms.The original data were input to the common classification algorithm after the reconstruction residual was obtained by the NBM model and compared with XGBoost, such as XGBoost, OCSVM,Iforest, LOF, and KNN. Among them, the OCSVM chooses the radial basis function as the kernel function. The penalty coefficient was set to 10. The insensitivity coefficient was set at 0.28.The number of forest trees was set at 100. The number of neighbors in the LOF and that of the KNN was set to 20.
The ROC curves for the five algorithms are shown in Fig. 16.Compared with OCSVM, Iforest, LOF, and KNN,the ROC curve of XGBoost is closer to the upper left and has a larger area of the two-dimensional plane. This indicates that XGBoost has a better anomaly classification effect.
The specific values of the precision and recall indicators of the five algorithms for the four common anomalies are listed in Table 3. In the four abnormal cases, the precision and recall indexes of XGBoost were significantly better than those of SVM,Iforest,LOF,and KNN.This indicates that XGBoost has a better classification accuracy.XGBoost improves the precision by 31.77%and recall by 31.36%on average compared with the other three classification algorithms. This verifies the effectiveness of XGBoost for CRDM coil current anomaly detection and identification.
5 Conclusion
This study presents a hybrid anomaly detection method based on the combination of the LSTM-AE neural network and XGBoost algorithm for the coil current of CRDM.The proposed method utilizes the LSTM-AE neural network to automatically extract nonlinear and sequential features of the coil currents and builds a normal behavior model to reconstruct the residual under abnormal conditions. The long series and periodic historical current data can be handled and predicted using the LSTM-AE model. The XGBoost classification algorithm was employed to identify outliers in the reconstructed errors and avoid defects. The proposed method inherits the generalization and classification abilities of these two techniques to realize the accurate detection of abnormal points and anomalies for CRDM. The results demonstrate that the proposed method enhances the prediction performance and classification accuracy compared with other detection methods. Finally,it can be confirmed that this solution offers promising applications for improving the safety and reliability of nuclear reactors.
Author contributionsAll authors contributed to the study conception and design. Material preparation, data collection and analysis were performed by Yong Xu, Ze-Shi Liu and Hao Jiang. The first draft of the manuscript was written by Jing Chen, and all authors commented on previous versions of the manuscript. All authors read and approved the final manuscript.
杂志排行

Nuclear Science and Techniques的其它文章
- Thermal hydraulic characteristics of helical coil once-through steam generator under ocean conditions
- Lifetime estimation of IGBT module using square-wave loss discretization and power cycling test
- Optimization of the cavity beam-position monitor system for the Shanghai soft X-ray free-electron laser user facility
- A beam range monitor based on scintillator and multi-pixel photon counter arrays for heavy ions therapy
- Research on manufacture technology of spherical fuel elements by dry-bag isostatic pressing
- Beam–beam effects and mitigation in a future proton–proton collider