Functional and phylogenetic structures of pheasants in China
2022-10-03HongynYoPenghengWngNnWngPhilipMGownXingfengSiJinqingLiJilingXu
Hongyn Yo ,Pengheng Wng ,Nn Wng ,Philip J.K.MGown ,Xingfeng Si ,Jinqing Li ,Jiling Xu,*
a School of Ecology and Nature Conservation,Beijing Forestry University,Beijing,100083,China
b Jiangsu Key Laboratory for Biodiversity and Biotechnology,College of Life Sciences,Nanjing Normal University,1 Wenyuan Road,Nanjing,210023,China
c School of Natural and Environmental Sciences,Newcastle University,Newcastle,NE1 7RU,UK
d Zhejiang Tiantong Forest Ecosystem National Observation and Research Station,School of Ecological and Environmental Sciences,East China Normal University,Shanghai,200241,China
Keywords:China Community assembly Environmental filtering Functional traits Pheasants Phylogeny Species richness
ABSTRACT Biodiversity has been subjected to increasing anthropogenic pressures.It is critical to understand the different processes that govern community assembly and species coexistence under biogeographic processes and anthropogenic events.Pheasants (Aves: Phasianidae) are highly threatened birds and China supports the richest pheasant species worldwide.Unravelling the spatial patterns and underlying factors associated with multidimensional biodiversity of species richness (SR),functional diversity (FD),and phylogenetic diversity (PD) of pheasants in China is helpful to understand not only the processes that govern pheasant community assembly and species coexistence,but also pheasant biodiversity conservation.We used a total of 45 pheasant species in China and analyzed the SR,FD,PD,and functional and phylogenetic structures by integrating species distribution maps,functional traits and phylogenies based on 50 km×50 km grid cells.We further used simultaneous autoregressive(SAR)models to explore the factors that determined these patterns.The southern Qinghai-Tibetan Plateau(QTP),Hengduan Mountains,southwestern Mountains,the east of the Qilian Mountains,the Qinling,southern China displayed higher SR,FD,and PD,which were determined by elevation,habitat heterogeneity,temperature seasonality,and vegetation cover.Elevation primarily determined the functional and phylogenetic structures of the pheasant communities.Assemblages in the highlands were marked by functional and phylogenetic clustering,particularly in the QTP,whereas the lowlands in eastern China comprised community overdispersion.Clustered pheasant assemblages were composed of young lineages.Patterns of functional and phylogenetic structures and richness-controlled functional and phylogenetic diversity differed between regions,suggesting that phylogenetic structures are not a good proxy for identifying functional structures.We revealed the significant role of elevation in pheasant community assemblages in China.Highlands interacted with community clustering,whereas lowlands interacted with overdispersion,supporting the environmental filtering hypothesis.Biogeographical drivers other than anthropogenic factor determined biodiversity of pheasants at the present scale of China.This study provides complementary background resources for multi-dimensional pheasant biodiversity and provides insights into avian biodiversity patterns in China.
1.Introduction
Biodiversity has been subjected to increasing anthropogenic pressures and threats from habitat change,invasive species,and climate change (Bongaarts,2019;Bowler et al.,2020).These pressures often induce non-random biodiversity changes,where species are eliminated from habitats due to selective processes that favor some species over others (Si et al.,2017);thus,it is critical to understand the different processes that govern community assembly and species coexistence under biogeographic processes and anthropogenic events.Community assembly is mainly driven by two processes:environmental filtering and competitive exclusion,with other processes (e.g.,dispersal limitations)(Webb et al.,2002;Cavender-Bares et al.,2009).Environmental filtering sorts species into assemblages with similar functional traits than expected by chance,resulting in assemblages that are functionally clustered,while competitive exclusion (or interspecific competition) favors the coexistence of species with different functional traits,leading to functionally overdispersed assemblages (MacArthur and Levins,1967;Webb et al.,2002).It is assumed that closely related species can share common features,such as ecological niches and functional traits(Faith,1992,1994).Compared to that of randomly chosen species in a phylogeny,phylogenetic structure patterns may also serve as a good proxy for functional structure,if traits related to these functions are highly conserved along the phylogeny (Cardillo et al.,2008;Devictor et al.,2010;Graham et al.,2012).However,phylogenetic similarity does not always reflect ecological similarity (Gerhold et al.,2015;Mazel et al.,2017,2018;Jarzyna et al.,2020).Therefore,understanding the taxonomic,functional,and phylogenetic dimensions of biodiversity will provide complementary insights into community assemblage mechanisms (He et al.,2018;Montaño-Centellas et al.,2019;Jarzyna et al.,2020).
Under the classic framework of community assembly,functional and phylogenetic clustering and overdispersion have routinely been interpreted as evidence of biotic and environmental constraints (i.e.,competitive exclusion and environmental filtering,respectively).However,large fitness differences and competitive exclusion,rather than environmental filtering,may drive functional clustering (Mayfield and Levine,2010);thus,bird communities in regions with high species richness(SR)may be ecologically clustered when compared with that of similarly sized areas with lower SR,due to increased competition.Abiotic and biotic mechanisms are not easily separable;therefore,linking patterns of habitat heterogeneity and dominant species traits to other possible factors provides a powerful method to reveal the potential underlying drivers that shape community assembly and species coexistence.
China spans a huge geographical area with a greatly varied terrain,from western highlands to central midlands to eastern lowlands(Fig.1).This geographic diversity supports rich biodiversity (Tang et al.,2006).China harbors 64 pheasant(Aves:Phasianidae)species,more than in any other country,representing 34%of the total number of pheasant species in the world(187 species),with 21 endemic species(Zheng,2018,2021).Pheasants are ground living birds and hold low dispersal ability(Madge et al.,2002).They are not only ecologically important but also are of great importance to human beings,and contain some of the most studied species,among which some are highly threatened (McGowan et al.,2012).Pheasants have suffered population declines because their large body size,colorful feathers,and weak flight capacities make them particularly susceptible to hunting and human disturbance (McGowan et al.,2012).Among 30 threatened pheasants,12 species (40.0%) are found in China(IUCN,2020).Therefore,it is important,not only across China but also in the world,that unravelling the processes which drive pheasant community assembly is helpful to understand species coexistence and biodiversity conservation of pheasants.Besides,although functional and phylogenetic structures of bird assemblages have already been explored to assess the geographic distribution of bird diversity in China,this past study excluded most of the southern central avifaunas(that is,avifaunas in the provinces of Henan,Hebei,Hunan,Hubei,Jiangsu,Anhui,Jiangxi,Fujian,Hainan,and Taiwan) and bird species sampling in some prefectures was biased,which may have greatly affected the resulting biodiversity relations with the explanatory variables (Wang et al.,2020).The exclusion of avifaunas which comprise most of the lowlands in China may limit our understanding of community overdispersion;thus,a study investigating a large taxonomic group across the whole country could provide insights into avian biodiversity patterns in China.
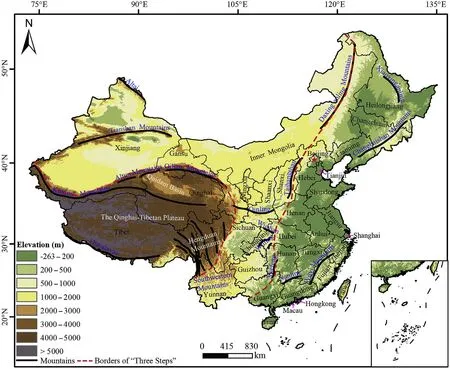
Fig.1.“Three Step” terrain pattern in China,with locations of major mountains,34 provinces,and key basins.
Evaluation of assemblage phylogenetic structure across spatial scales has shown that centres of recent diversification are closely related to phylogenetic clustering (Pennington et al.,2004;Li et al.,2021).The Sino-Himalayan mountains,particularly the Hengduan Mountains,eastern Himalayas,and southern China,are the centres of recent Galliformes bird diversification that has driven considerable SR accumulation(Cai et al.,2018)after the long-distance dispersal of ancestral pheasants from Africa (Crowe et al.,2006;Wang et al.,2017).Global avian community assemblages show that warm tropical lowlands harbor more functional diversity (FD) than SR,marked by high functional overdispersion,while tropical highlands and temperate lowlands appear to be strongly functionally clustered and redundant (Jarzyna et al.,2020).The highlands in southwest China display warm and humid climatic conditions,and the lowlands in the southeast and eastern regions are found to have more annual rainfall(Tang et al.,2006).Furthermore,recent research has also shown that terrestrial vertebrates have higher phylogenetic diversity (PD) in south and southwest China compared to other regions of China(Hu et al.,2021).Therefore,we predicted high SR,FD,and PD in the southern Qinghai-Tibetan Plateau (QTP) including eastern Himalayas,Hengduan Mountains,southwestern China,and southern China.We also predicted that pheasant assembly would functionally and phylogenetically cluster in southwest China,and functional and phylogenetic overdispersion would occur in the lowlands of southeast and east China.In addition,pheasants as highly threatened birds,we predicted human activities have negatively affected the biodiversity of pheasants in China.
Here,we provide a comprehensive evaluation of SR,FD,PD,and the community structures of pheasants in China,as well as the drivers of these patterns associated with human activities and environmental factors.Using species distribution maps,trait data,a reconstructed timecalibrated phylogeny,and other factors (i.e.,human activities,terrain,habitat heterogeneity,vegetation cover,and bioclimatic factors) based on 50 km×50 km grid cells in China,we aimed to reveal:(1)the spatial patterns of SR,FD,and PD of pheasants in China;(2)the functional and phylogenetic structures of pheasants;and (3) the influence of human activities,terrain factors,habitat heterogeneity,vegetation cover,and bioclimatic factors on the above biodiversity and community structures.
2.Materials and methods
2.1.Pheasant species and geographic ranges
Of the 64 pheasant species that are distributed throughout China,we used a total of 45 species in our study by excluding two categories.The first category includes nine species that occur in China but have most of their geographic range outside the country (e.g.,Altai SnowcockTetraogallus altaicusand threeTragopanspecies) and the second category also includes nine species which lacked data (Appendix 2: Table S1).Besides,Taiwan Bamboo Partridge (Bambusicola sonorivox) was still treated as the subspecies of Chinese Bamboo Partridge (Bambusicola thoracicus) for facilitating analysis although Hung et al.(2014) divided the Bamboo Partridge distributed in Taiwan into an independent species(i.e.,Taiwan Bamboo Partridge)using morphological characteristics and molecular differences.However,availability data was limited due to the short time of separation.Among the remaining 45 pheasant species,21 are endemic to China(Zheng,2016).
Pheasant occurrence data were compiled from field surveys,publications,and the online databases of the Global Biodiversity Information Facility (GBIF,http://www.gbif.org/),eBird (http://ebird.org/),xenocanto (http://www.xeno-canto.org),and the China Bird Report (http://www.birdreport.cn).We removed occurrences that were geographically biased or errors(Boakes et al.,2010).We also removed occurrences within 1 km,and retained occurrences of species after 2000 owing to the high spatial uncertainty of older records(Pollock et al.,2015).After these exclusions,7456 occurrences remained (Appendix 2: Table S1).The number of occurrences per species ranged from 21 to 1645(Appendix 2:Table S1).The geographic range of each species was derived by first constructing ecological niche models(ENMs)using a maximum entropy algorithm (Maxent v3.3.3e;Phillips et al.,2006;Pollock et al.,2015)based on species occurrences and environmental variables with a 1-km resolution (Appendix 1 for model selection and methods;Appendix 2:Table S2),and then each geographic range was confirmed through the input of pheasant researchers who were knowledgeable on the range of each species (Appendix 2: Fig.S1-S45).Confirmation by these experts helped us to establish more exact realized ranges of pheasants (Zupan et al.,2014).Model performance was evaluated using the area under the receiver operating characteristic (AUC;Yao et al.,2017).
2.2.Geographical spatial patterns of SR
SR was measured as the number of pheasant species in each 50 km×50 km equal-area grid cell on Chinese continental areas,including the Hainan and Taiwan islands.An equal-area grid enables spatially unbiased comparisons among grid cells (Voskamp et al.,2017);thus,SR analyses were carried out on 6011 grids in China(Appendix 3:Table S3).
2.3.Trait space and FD
For each assemblage,we used five species-level ecological and lifehistory traits related to resource use,trophic levels,and species fitness to construct a functional trait dendrogram of 45 pheasant species to calculate FD: body mass (g),bill length (mm),sex dimorphism (binary variable),clutch size (n),and incubation period (d) (see Appendix 1)(Petchey and Gaston,2006).FD was calculated as the sum of the branch lengths of the functional dendrogram constructed for those species which were clustered in the trait space.Trait data were extracted from the published literature and unpublished data(Appendix 3:Table S4).
To examine the phylogenetic signal of each trait,Blomberg'sKstatistic(Blomberg et al.,2003)andD-statistic(Fritz and Purvis,2010)were used for continuous and binary traits,respectively.Values of Blomberg'sK>1 indicate a stronger phylogenetic signal while Blomberg'sK<1 indicate a weak phylogenetic signal.ForD-statistic,the values ofD<0 indicate that the binary trait is more conserved than expected under Brownian motion.The Blomberg'sKstatistic andD-statistic were calculated in the R packages ‘phytool’ and ‘caper’,respectively (Blomberg et al.,2003;Fritz and Purvis,2010).
We calculated the distance of each dendrogram branch using Gower's dissimilarity distance matrix(Pavoine et al.,2009),using the hierarchical clustering of the unweighted pair group method with the arithmetic mean (UPGMA).The highest cophenetic correlation coefficient (a measure of how well the pairwise distances of the original data points are retained by the functional dendrogram) was 0.84,suggesting that the functional dendrogram is an accurate representation of the distance matrix(Mestre et al.,2020).We also calculated the mean squared deviation (mSD) value to assess the congruence between the functional distance as given by Gower's metric and the cophenetic distance on the functional dendrogram since a dendrogram-based approach might in some cases artificially increase the functional distance between species that have similar trait values (Maire et al.,2015;Jarzyna et al.,2020).The mSD was 0.007,suggesting an average absolute deviation between Gower's and the dendrogram-based distances of approximately 7%.We calculated FD and PD (below) for all grid cells containing at least two species(Voskamp et al.,2017).Therefore,FD and subsequent functional structure analyses were carried out on 4198 grids inside China.
2.4.Phylogeny and PD
A phylogeny for 45 pheasant species and 4 outgroup taxa was constructed based on 4 mitochondrial genes and 6 nuclear genes.All sequences were sourced from GenBank (https://www.ncbi.nlm.nih.gov/)on April 30,2020 (Appendix 3: Table S5).We firstly aligned sequences using Clustal W in MEGA-X (Kumar et al.,2018) and then assembled a sequence matrix.The combined super-matrix was partitioned based on genes,and each partition was assigned a substitution model based on AIC value using jmodeltest(Darriba et al.,2012)(Appendix 2:Table S6).The phylogeny was reconstructed using maximum likelihood methods.To calibrate the divergence time,we used two documented fossil calibrations (details see Appendix 1 for methods).The final phylogeny was generally well supported and consistent with the findings of previous studies(Cai et al.,2018,Appendix 2:Fig.S46).
We calculated Faith's PD to measure the PD of the pheasants,which summarises the total phylogenetic branch length of all species in a community (Faith,1992).For each grid cell,we calculated SR and PD using the R package‘picante’ (Kembel et al.,2010).PD and subsequent phylogenetic structure analyses were also carried out for all grid cells containing at least two species and on 4198 grids inside China.
2.5.Functional and phylogenetic structures and null models
FD,PD,and community structure could be statistically influenced by SR;therefore,we used null models to control for the effects of SR.We used a ‘shuffling tip’ null modelling approach.This method tested whether the observed functional and phylogenetic diversity metrics differed from communities assembled at random.We randomly shuffled the names of the species on the tips of the two trees 999 times but retained the structure of the phylogenetic or functional tree (Swenson,2014).We calculated the standard effect size (ses) of functional/phylogenetic diversity (sesFD/sesPD)which was denoted as richness-controlled functional/phylogenetic diversity,respectively.The“ses” of the mean pairwise functional/phylogenetic distance (sesMFD/-sesMPD)was used to calculate the functional and phylogenetic structures of pheasant communities,as follows:

where Metricobsis the observed metric in each grid cell,and Mean(Metricnull) and SD (Metricnull) are the mean and standard deviation values,respectively,of 999 randomised communities for phylogenetic or functional diversity in each grid cell.We developed the expected values of all metrics by randomly selecting species from the pool of 45 pheasant species.sesMFD/sesMPD could be interpreted in terms of community structures: negative values indicated community clustering,while positive values indicated community overdispersion,given that species traits are phylogenetically conserved(Webb et al.,2002).Values greater than 1.96 or less than -1.96 indicated significant community clustering or overdispersion,respectively (α=0.05).
2.6.Statistical analyses
We tested the spatial autocorrelation between SR,FD,PD,sesFD,sesPD,sesMFD and sesMPD using the global Moran'sI(Legendre and Legendre,2012)based on the function‘Moran.I’in R package‘ape’.We found significant spatial autocorrelation (p<0.05;Appendix 2:Table S7).To control the spatial autocorrelation of the regression residuals,simultaneous autoregressive(SAR)models were used to analyse which potential factors affected the spatial patterns of pheasant SR,FD,PD,sesFD,sesPD,sesMFD,and sesMPD in China using the function‘errorsarlm’ in the R package ‘spdep’ (Kissling and Carl,2008).We extracted mean values of 19 bioclimatic variables from Worldclim v2(htt p://worldclim.org/),elevation (m),vegetation cover of normalized difference vegetation index (NDVI),spatialization data of gross domestic product(GDP)and human population size(HP)in each 50 km×50 km grid cell.NDVI,GDP and HP were taken from Resource and Environmental Science and Data Centre of Chinese Academy of Science(http://www.resdc.cn/).We used elevation range,which was the difference between the maximum and minimum values of elevation,in each grid to estimate habitat heterogeneity (Wang et al.,2011;Xu et al.,2019).GDP and HP are both important surrogate variables for human activities(Wang et al.,2011).We used variance inflation factor(VIF)to detect multicollinearity between the all variables by removing strong multicollinearity (r>|0.75|) (Appendix 2: Table S8.1,S8.2).Finally,8 variables related to bioclimatic factors,vegetation cover,and human activities were used to conduct the analysis: elevation (m),elevation range (m),mean annual temperature (°C),isothermality (coefficient of day temperature variation),temperature seasonality(standard deviation×100),precipitation seasonality (coefficient of variation),vegetation cover of the normalized difference vegetation index(NDVI),and human population size(HP).All analyses were performed in R version 4.0.3(R Core Team,2020).
3.Results
The high AUC values of all ENMs indicated that the geographic range of each pheasant was accurately predicted (Appendix 2: Table S9).All traits exhibited significant trait conservatism,with all traitKvalues <1(p<0.05)and allDvalues <0(Appendix 2:Table S10).
3.1.Geographical spatial patterns of SR,FD,PD,sesFD,sesPD,and associated variables
The SR of the pheasants in each 50 km×50 km grid in China ranged from 0 to 14.Among the study areas,SR was highest in the southern QTP,Hengduan Mountains,Southwestern Mountains,the east of the Qilian Mountains,the Qinling and southern China,where there is an elevation peak of approximately 1500-3500 m(Figs.1 and 2A).The mountains on the border of the Chongqing,Hubei,and Hunan provinces also showed high SR.FD and PD showed similar geographical spatial patterns to that of SR (Fig.2B and C).Richness-controlled functional and phylogenetic diversity(sesFD and sesPD,respectively) showed different geographical spatial patterns(Fig.2D and E).sesFD exhibited higher FD than the expected values of the null models in northern and northeastern China,while lower sesFD was evident in most of the QTP and central,southern,and southwestern China (Fig.2D).sesPD showed higher phylogenetic diversity than the expected values of the null model in most of the lowlands of eastern China and included the south-central QTP and some northern areas near the Taihangshan Mountains.Lower sesPD was observed in central(i.e.,the Qinling Mountains and its southern regions),southwestern and western China (including the Qilian Mountains,the northern regions of the QTP,and Altai),northern regions (including Taihangshan and nearby mountains),and most of northeastern China(Fig.2E).The southern QTP and the Hengduan Mountains both displayed high sesFD and sesPD(Fig.2D and E).
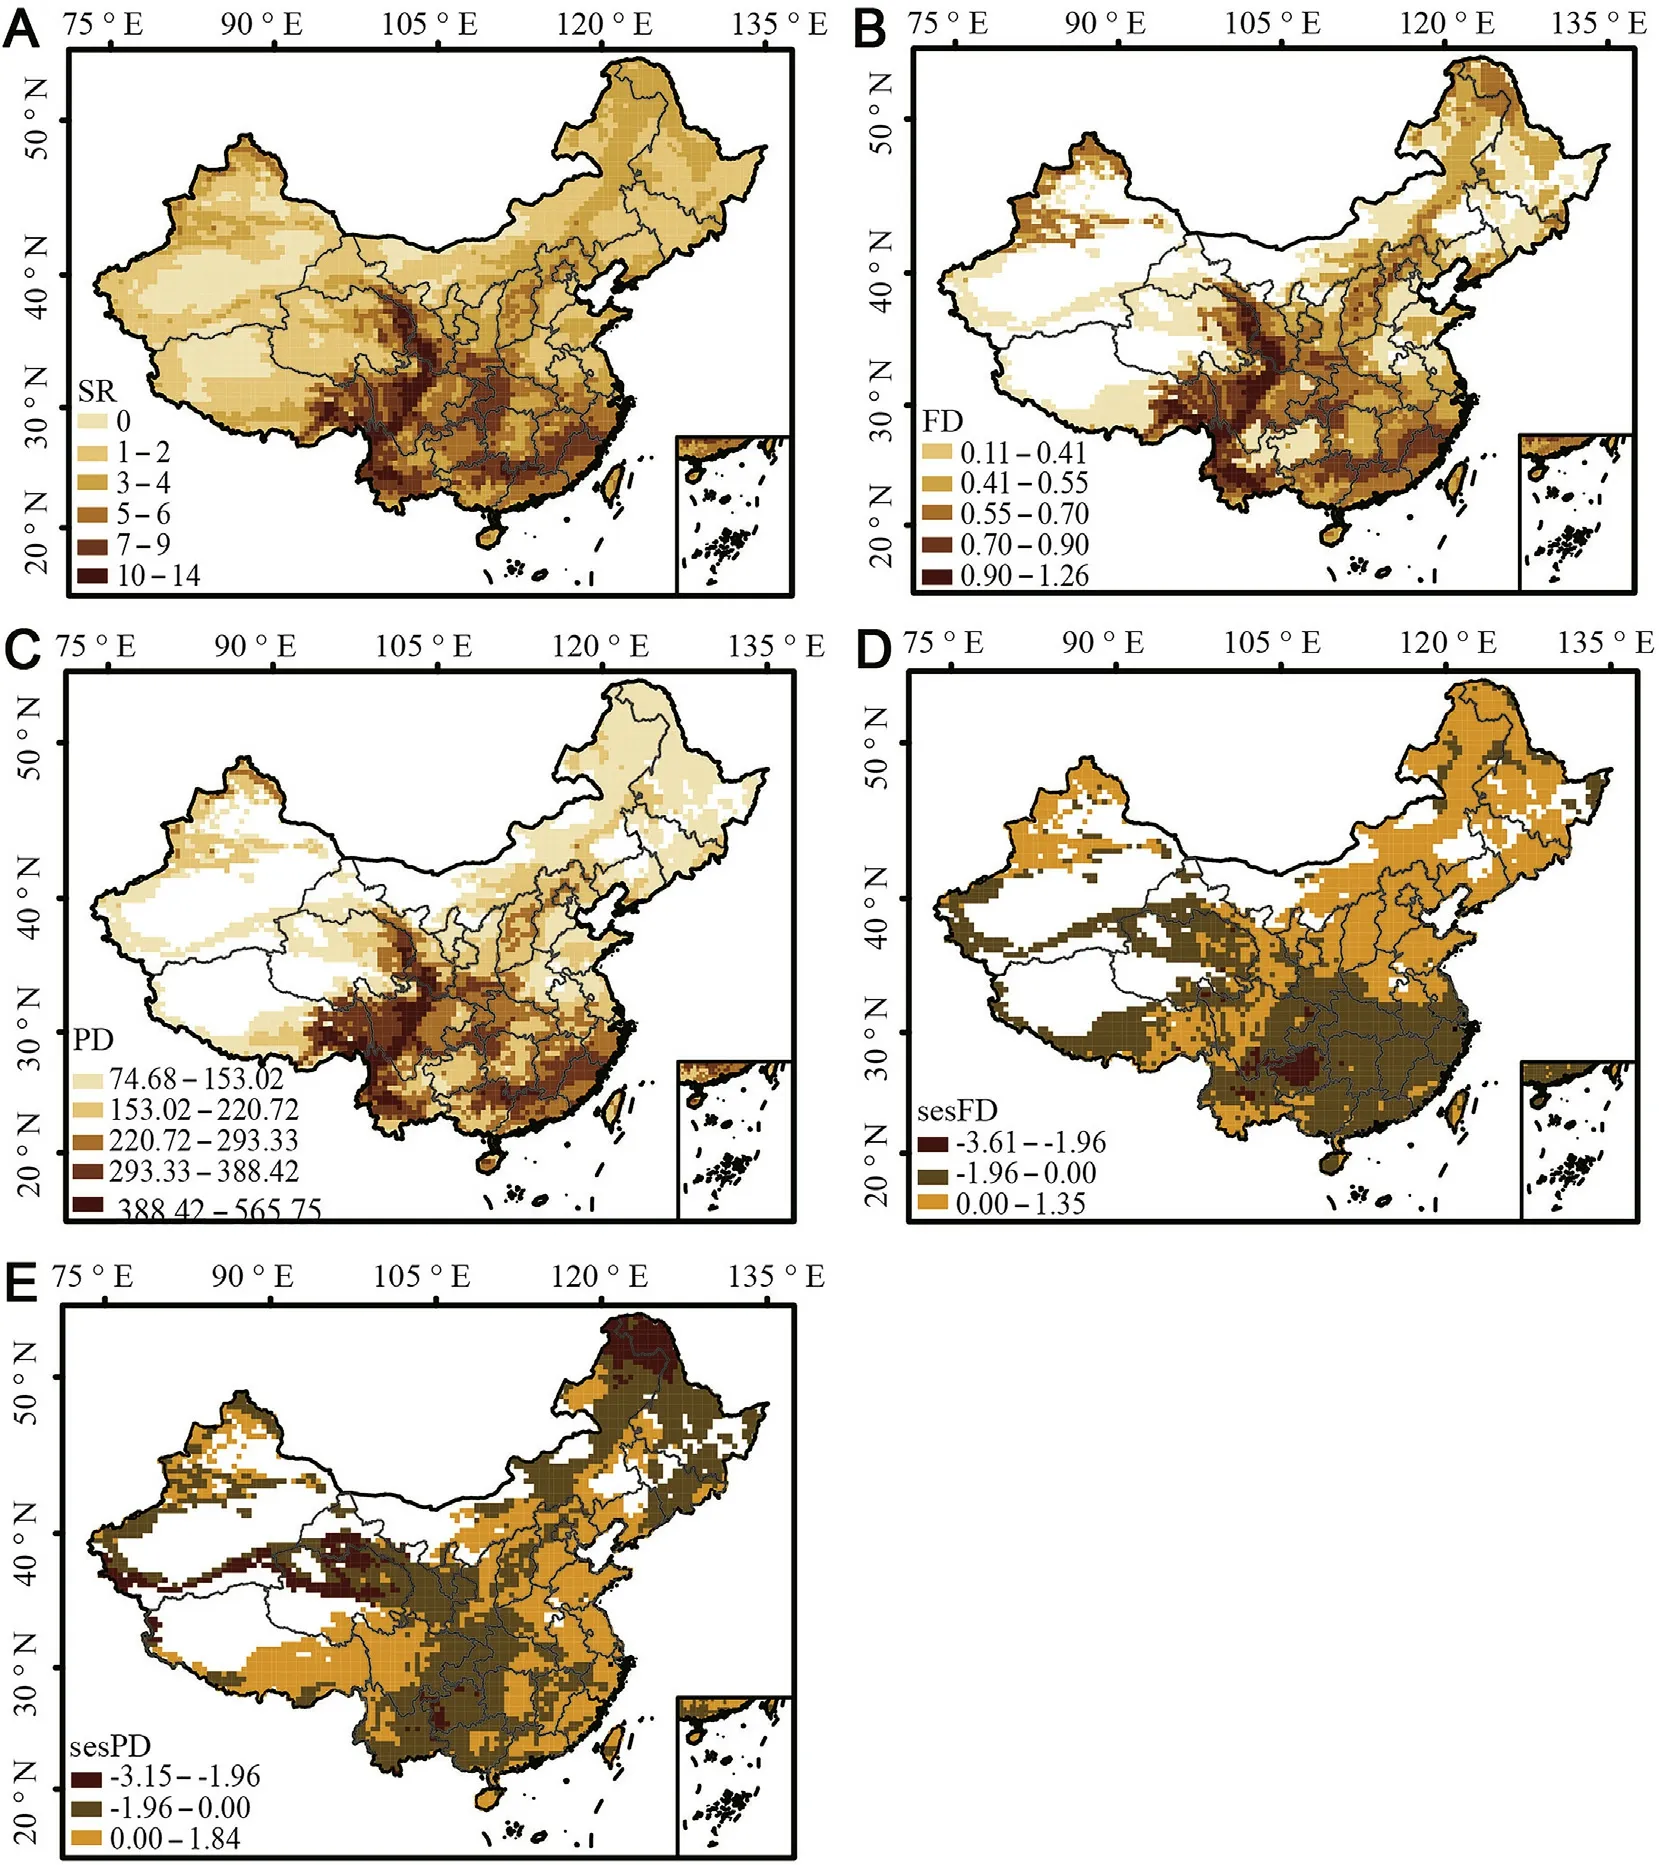
Fig.2.Spatial patterns of three dimensions of pheasant diversity across China:(A)species richness(SR),(B)functional diversity(FD),(C)phylogenetic diversity(PD),(D)richness-controlled functional diversity(sesFD),and(E)richness-controlled phylogenetic diversity(sesPD).High levels of diversity are shown in deep brown(A,B,C).(For interpretation of the references to color in this figure legend,the reader is referred to the Web version of this article.)
SAR regressions indicated that elevation,elevation range,temperature seasonality,and vegetation cover of NDVI all significantly affected the SR of pheasants in China(p<0.001,Appendix 2:Table S11;Fig.3).Pheasants were more common at mid-elevation (approximately 1500-3500 m)than at low or high elevations(Fig.3B).SR was positively related to elevation range and NDVI,suggesting that high habitat heterogeneity and high vegetation cover could support greater pheasant species coexistence(Fig.3A,D).In contrast,factors of isothermality and temperature seasonality,both related to temperature variations,were negatively associated with SR,indicating that stable temperature conditions maintained the presence of more species (Fig.3C).FD and PD showed significant associations with elevation,elevation range,temperature seasonality,and NDVI,in line with SR(Fig.3E,F,G,H,I,J,K,L).Both sesFD and sesPD were significantly affected by elevation(p<0.001,Table 1).sesFD decreased as elevation increased (Fig.3M);sesPD was lower than the expected values from the null models below 5000 m elevation and sesPD tended to be higher than the expected values from the null models above 5000 m elevation (Fig.3N).Mean annual temperature significantly affected sesFD,suggesting that sesFD decreased as temperature increased (Fig.3O;Table 1);thus,sesFD increased as latitude increased(Fig.3P).Human population size had no significant effect on SR,FD,PD,sesFD,or sesPD(Appendix 2: Table S11;Table 1).
3.2.Functional and phylogenetic structures and the effect of factors
The patterns of sesMFD showed the functional clustering of pheasants predominantly in most of areas of the QTP,areas from the Qinling to Southwestern Mountains,and southern China including Nanling and Wuyishan Mountains,while functional overdispersion was evident in the northern areas of Tianshan Mountains,the northern and eastern areas of the Qinling including northeast China,Hengduan Mountains,and a small part of the southern QTP near the Hengduan Mountains (Fig.4A).Notably,regions with the highest SR displayed functional overdispersion in the southern QTP and Hengduan Mountains (Figs.1 and 4A).In contrast,most of the central and southern regions of China with higher SR values showed functional clustering.Significant functional clustering was observed in the southwestern regions of China.In addition,sesMFD indicated functional overdispersion in the southernmost region of China,consisting mostly of Guangxi and Guangzhou,and some Fujian,Hainan,and Taiwan islands(Fig.4A).
For phylogenetic structures,sesMPD showed the occurrence of phylogenetic clustering mainly in central,southwestern,and western China(including the Qinling Mountains,the northern regions of the QTP,and Altai),northern regions (including Taihangshan and nearby mountains),and most of the highlands and midlands in northeastern China(Fig.4B);these areas harbored a greater number of phylogenetically younger pheasant species (Appendix 2: Fig.S46).Phylogenetic overdispersion was mainly evident in the lowlands of eastern China,southcentral QTP,and some northern areas.In addition,the Sichuan Basin was functionally and phylogenetically overdispersed(Fig.4).Significant phylogenetic clustering occurred in southwestern China,north of the QTP,and in most northeastern regions of China(Fig.4B).
According to the SAR results,elevation significantly affected sesMFD and sesMPD (Table 1).An obvious functional structure from overdispersion to clustering along the elevation gradient was revealed(Fig.5A).sesMPD exhibited a hump-shaped pattern along the elevation gradient.Communities in mid-elevation areas tended to be more phylogenetically clustered than those in the lowlands and highlands(Fig.5B).Similar to that of functional communities,phylogenetic overdispersion more commonly occurred at lower elevations compared to phylogenetic clustering (Fig.5C;Appendix 2: Table S12).Mean annual temperature also significantly affected sesMFD,suggesting that functional overdispersion occurred when temperatures were lower,while functional clustering occurred in areas with higher temperatures(Table 1;Appendix 2: Fig.S47A);thus,pheasant communities changed from functional clustering to overdispersion as latitude increased (Appendix 2:Fig.S47B).Our results showed that human population had no significant impact on the functional and phylogenetic structures of pheasants in China in large scale(Table 1).
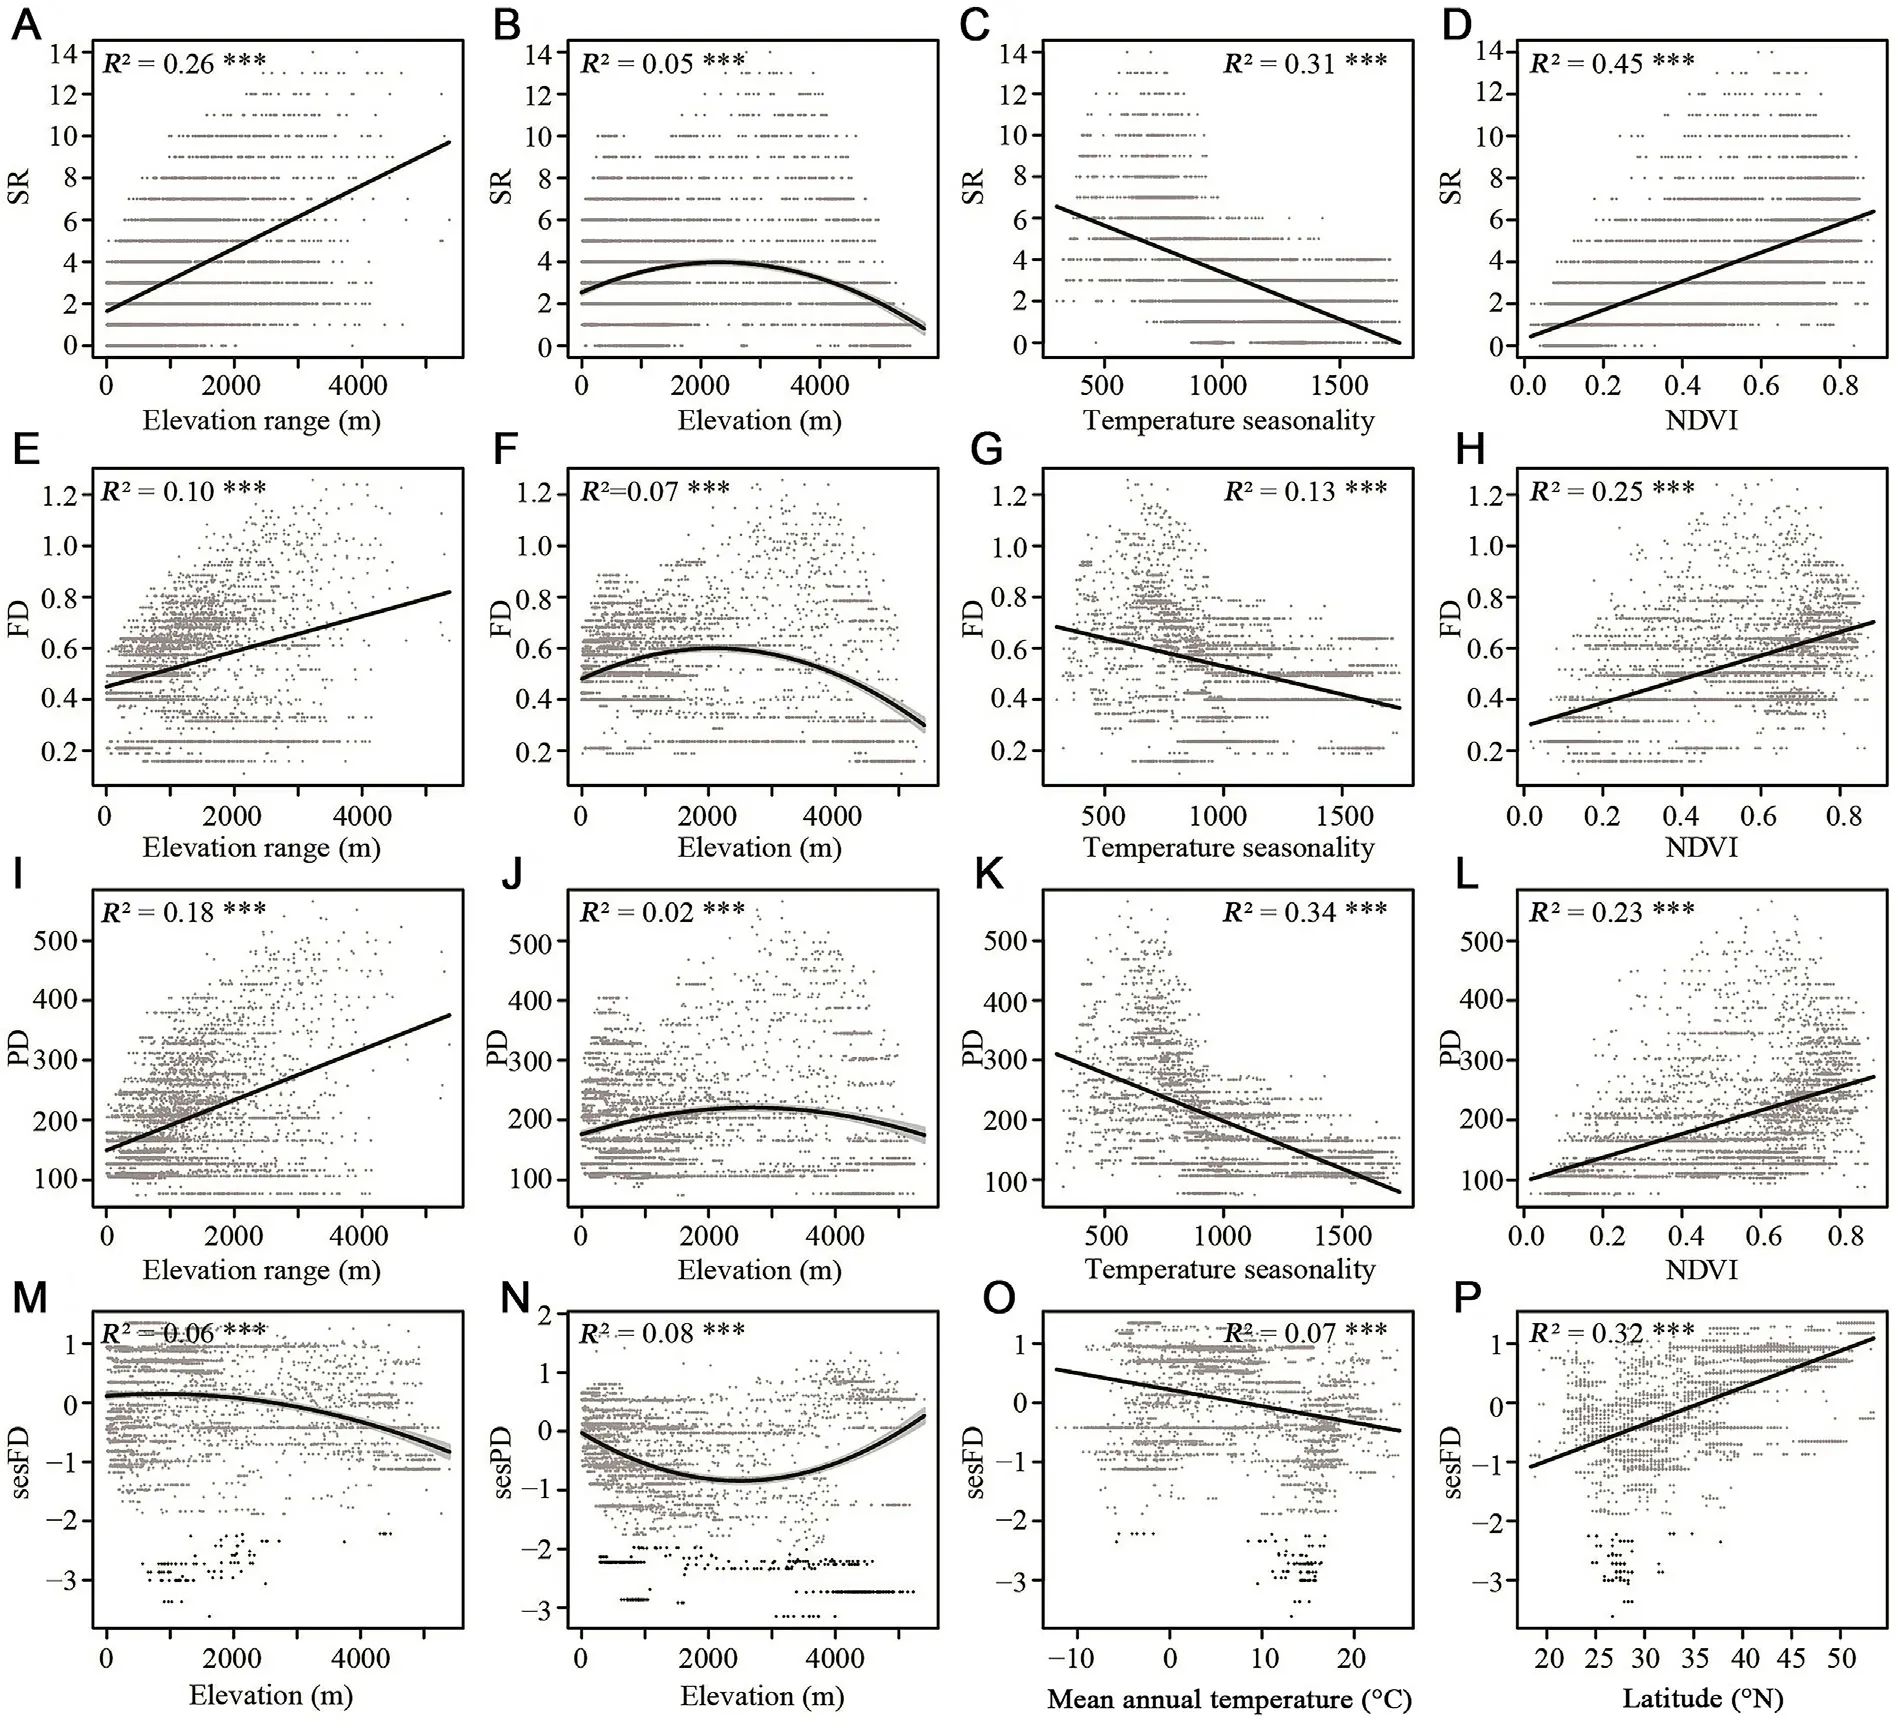
Fig.3.The effects of environmental factors on three dimensions of diversity based on simultaneous autoregressive(SAR)model analysis:(A)effect of elevation range on species richness(SR),(B)effect of elevation on SR,(C)effect of temperature seasonality on SR,(D)effect of normalized difference vegetation index(NDVI)on SR,(E)effect of elevation range on function diversity(FD),(F)effect of elevation on FD,(G)effect of temperature seasonality on FD,(H)effect of NDVI on FD,(I)effect of elevation range on phylogenetic diversity (PD),(J) effect of elevation on PD,(K) effect of temperature seasonality on PD,(L) effect of NDVI on PD,(M) effect of elevation on richness-controlled FD(sesFD),(N)effect of elevation on richness-controlled PD(sesPD),(O)effect of mean annual temperature on sesFD,and(P)trends of sesFD along a latitude gradient.Dots with |values| <1.96 in grey,and |values| >1.96 in black highlight significant values.
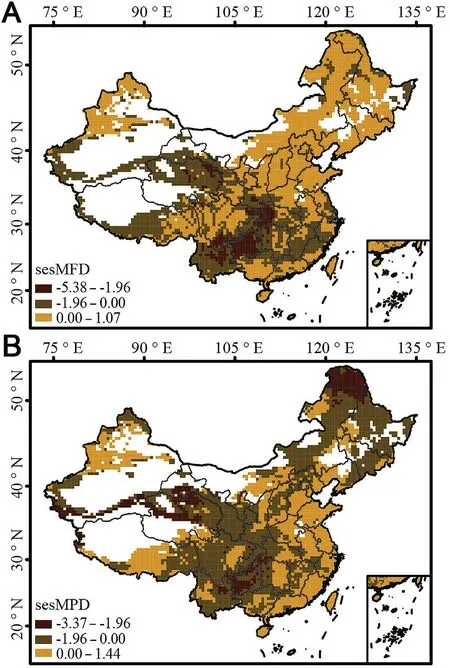
Fig.4.Spatial patterns of pheasant functional and phylogenetic structures in China:(A)pattern of functional structure using the standard effect size of mean pairwise functional distance (sesMFD),(B) pattern of phylogenetic structure using the standard effect size of mean pairwise phylogenetic distance(sesMPD).Areas of functional/phylogenetic clustering are shown in brown,and deep brown indicates significant clustering (ses<-1.96).Functional and phylogenetic overdispersions are shown in orange.(For interpretation of the references to color in this figure legend,the reader is referred to the Web version of this article.)
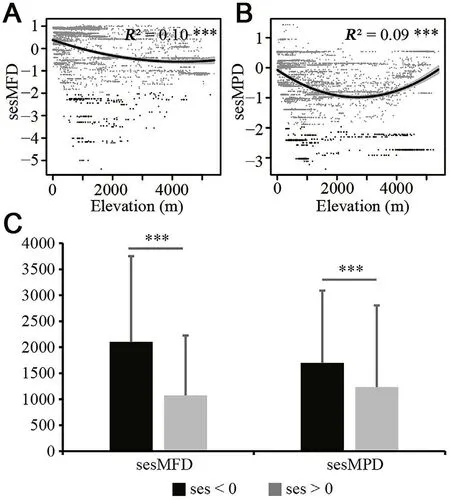
Fig.5.Effect of elevation on the functional and phylogenetic structures of pheasants in China and a comparison of significant variables of elevation between functional/phylogenetic clustering and overdispersion: (A) effect of elevation on functional structure from the standard effect size of mean pairwise functional distance (sesMFD),(B) effect of elevation on phylogenetic structure from the standard effect size of mean pairwise phylogenetic distance (sesMPD),(C) elevation comparison between functional clustering and overdispersion and phylogenetic clustering and overdispersion.Dots in A and B with|values|<1.96 in grey and with |values| >1.96 in black highlight significant results.

Table 1 Simultaneous autoregressive (SAR) regression results of environmental factor effects on species richness (SR),richness-controlled functional/phylogenetic diversity(sesFD/sesPD),and functional/phylogenetic structure of the standardized effect size of mean pairwise functional/phylogenetic distances (sesMFD/sesMPD) of pheasants in China.
4.Discussion
Our results revealed the spatial patterns of SR,FD,and PD of pheasants in China.These results confirmed our predictions that: (1) the highest SR,FD,and PD of pheasants in China occurred in the southern QTP,Hengduan Mountains,southwestern China,and southern China;(2)pheasant communities are more functionally and phylogenetically clustered than the expected values from null models in most of southwest China,while functional and phylogenetic overdispersion was evident in most of the southeastern and eastern regions of China,which display warmer climatic conditions at lower elevations;(3) human activities seldom have affected the biodiversity of pheasants at present scale.This study also found no uniform patterns between the functional and phylogenetic structures of pheasants in China.
4.1.SR of pheasants in China
The southern QTP,Hengduan Mountains,Southwestern Mountains,south of the Qinling and Qilian Mountains,and southern China exhibited the highest levels of pheasant species richness.Local terrain,climatic conditions,and vegetation cover significantly affected the three dimensions of diversity investigated in this study(SR,FD,and PD).These mountain regions show an obvious vertical structure with strong ecological gradients in temperature and precipitation,which hold a greater diversity of available niches(or habitats),supporting the habitat heterogeneity hypothesis (Kerr and Packer,1997;Cai et al.,2018).The Hengduan Mountains are a series of parallel mountain ranges with rivers that form topographic channels to allow seasonal monsoons from the lowland tropics of south China,India,and Myanmar (Burma) from the Indian Ocean directly through river valleys to the southeastern edge of the QTP,which stands at over 5000 m high,making the Hengduan Mountains rainy and moist year-round(Boufford,2014).To the south of the QTP,humid and rainy conditions are produced by glacial meltwater from the Himalayas and monsoons from the Indian Ocean.The Hengduan Mountains,regions to the south of the QTP,and all of the low latitudinal regions in southern China are relatively warm year-round.Such warm and rainy climatic conditions support high plant species richness,which could provide diverse ecological niches and,in turn,support greater species coexistence.These associations between climatic conditions and SR identified in this study are consistent with the results of previous studies of birds in China(Zhang and Ding,2007;Cai et al.,2018;Wang et al.,2020).
Species distribution was further determined based on evolutionary history.The uplift-driven diversification of terrain in the Hengduan Mountains,as a result of orogeny,creates conditions which favor rapid in situ speciation within evolutionarily isolated and environmentally stable montane habitats,resulting in the rich biodiversity found in the mountains(Qu et al.,2014;Xing and Ree,2017).
4.2.Functional and phylogenetic structures of pheasants in China
Integrating functional traits and phylogenies provides a potentially powerful strategy to reveal the underlying mechanisms that shape pheasant community assembly and species coexistence in China.We found that,typically,overdispersion occurred in the lowlands and clustering occurred at higher elevations (Figs.3 and 4),which mirrors the results of previous studies(Graham et al.,2009;Dehling et al.,2014;He et al.,2018;Jarzyna et al.,2020).Our results also suggest that elevation played a significant role in the establishment of functional and phylogenetic structures.Elevation in central,southwestern,and western China is higher than that in eastern China.As elevation rises from the east to the central,southwest,and west to the QTP regions,functional and phylogenetic structures of pheasant communities became increasingly decoupled,suggesting that only some close relatives shared similar trait combinations (Jarzyna et al.,2020).Environmental filtering was the main driver of community assembly,with close relatives sharing similar traits that were adapted to the local high-elevation climatic conditions.Community clustering is more likely to occur when environmental stress is relatively high or conditions are more extreme,as is the case in highland areas,because species in these regions possess the traits required to survive and,thus,these individuals are more likely to be close relatives with similar trait combinations (Machac et al.,2011;Si et al.,2017;Jarzyna et al.,2020;Ding et al.,2021).In contrast,community overdispersion was observed more in areas with relatively stable environments,such as the warmer lowland areas in China.
Contrary to our predictions,regions in the southern QTP and Hengduan Mountains,which displayed the highest SR of pheasants in China,showed functional overdispersion(Fig.4A).This may have been caused by the results of the stable climatic conditions and diverse ecological niches found in these regions(Boufford,2014;Jarzyna et al.,2020).This result differs from that of a previous study of bird assemblages in China,which found functional clustering in these regions(Wang et al.,2020).
The phylogenetic structure of the pheasants found in the southern QTP and Hengduan Mountains showed a clustering pattern.The Sino-Himalayan mountains,particularly the Hengduan Mountains and eastern Himalayas,and southern China are the centres of recent Galliformes bird diversification events(Cai et al.,2018).These diversification events have led to these regions harboring more phylogenetically young species (Appendix 2: Fig.S46),as well as the highest pheasant SR in China(Crowe et al.,2006;Wang et al.,2017;Cai et al.,2018);thus,the regions of the southern QTP and Hengduan Mountains with high SR have phylogenetically clustered community assemblages.
It is notable that some low-elevation areas (e.g.,the Sichuan Basin)showed overdispersed functional and phylogenetic assemblage structures.The refuge hypothesis assumes that the long-term paleo-climate could promote high SR and overdispersed phylogenetic structures by facilitating speciation and preventing the extinction of ancient species(Fjeldså and Lovett,1997;Qu et al.,2014;Svenning et al.,2015;Feng et al.,2020).Studies have suggested that the Sichuan Basin was a glacial refuge during the Pleistocene (approximately 2.58 million years ago to 0.012 million years ago),with gene flow from neighbouring populations promoting the speciation of Galliformes in the Sichuan Basin,such as the case in twoChrysolophusspecies (Lyv et al.,2015) andLophuraspecies(Dong et al.,2013).Closely related species that share similar traits or resource requirements coexist,resulting in phylogenetic clustering;however,phylogenetic overdispersion can occur when closely related species experience greater competition under limited resources,and are more likely to be competitively excluded(Webb et al.,2002).
4.3.Comparing the patterns found for sesFD-sesPD and FD-PD
FD and PD metrics are commonly,but not always,closely correlated to SR (Mazel et al.,2017,2018;Cadotte et al.,2019).However,sesFD and sesPD patterns differed.Functional traits and phylogeny are often related due to underlying trait evolution,meaning that the information they provide is not independent(Webb et al.,2002;de Bello et al.,2017).Thus,functional and phylogenetic differences between species to some degree non-independent.The overlapping information between functional and phylogenetic differences,which can be represented by their joint dissimilarity structure(de Bello et al.,2017).
Our results showed that phylogenetic structure is not a good proxy for functional structure,as differing patterns were found,leading to unclear conclusions.The functional similarity and dissimilarity of regional species assemblages are largely driven by non-random ecological processes(Cadotte et al.,2019).Functional structure is affected by traits used(Wang et al.,2017).Besides,traits also show differential associations with phylogenetic structure (Barnagaud et al.,2014).Traits related to resource requirement and species fitness are often considered in functional community assembly(Si et al.,2017;Chen et al.,2019;Xu et al.,2021).We collected traits related to ecological traits and life-history,among which are commonly linked to extinction risk.Based on traits selected,we conclude that,at the scale of our study,phylogeny alone is not suitable for recognizing regions with distinct ecosystem-relevant functions.
4.4.Anthropogenic factor not determining biodiversity of pheasants across China
At the scale presented in this study,human activities had no effect on the biodiversity patterns of pheasants in China.However,this avian group has suffered;specifically,40% of the total threatened Galliformes worldwide are present in China,all of which are pheasant species(IUCN,2020).Therefore,pheasant biodiversity conservation still requires further attention.The influence of human activities on pheasants needs to be explored on local or smaller scales,which may provide a deeper insight into effective protection measures and aid decision-making in pheasant conservation.
5.Conclusions
We uncovered spatial patterns of SR,FD,and PD of pheasants across China which were primarily driven by elevation,habitat heterogeneity,temperature seasonality,and vegetation cover.We further revealed the significant role of elevation in the community assemblage formation of pheasants in China,where highlands interacted with community clustering and lowlands interacted with overdispersion,supporting the environmental filtering hypothesis.We found that phylogenetic structure is not a good proxy for functional structure because of the inconsistent spatial patterns of pheasants in China.At the presented scale,human activities had no significant effect on the biodiversity patterns of pheasants in China;thus,biogeographical drivers other than anthropogenic factor determined biodiversity of pheasants at the present scale of China.This study provides complementary background resources for pheasant biodiversity and conservation and provides insights into patterns of avian biodiversity in China.
Author contributions
HY and JX conceived the ideas and designed the program.HY and WN collected field data.HY and PW analyzed the data.HY led the writing.XS,PM,JL and JX revised the manuscript.All authors contributed critically to the drafts,read and approved the final manuscript.
Declarations of competing interest
The authors declare that they have no competing interests.
Acknowledgements
We sincerely thank Keji Guo,Xianda Li,Jianzhi Zhang,Nan Lyv,Yiqiang Fu,and Yu Xu for providing pheasant occurrence data in the field.We thank Yongjie Huang for his help with the data analysis.We appreciate Yuhao Zhao for his comments on the manuscript.This research was supported by grants from the National Natural Science Foundation of China (No.31872240) and the National Key R &D Plan Project(No.2016YFC0503206).
Appendix A.Supplementary data
Supplementary data to this article can be found online at https://do i.org/10.1016/j.avrs.2022.100041.
杂志排行
Avian Research的其它文章
- Thermoregulatory function and sexual dimorphism of the throat sack in Helmeted Guineafowl (Numida meleagris) across Africa
- Distribution pattern and driving factors of genetic diversity of passerine birds in the Mountains of Southwest China
- Multiple lines of evidence confirm that the critically endangered Blue-crowned Laughingthrush(Garrulax courtoisi)is an independent species
- Corrigendum to “Multiple lines of evidence confirm that the critically endangered Blue-crowned Laughingthrush (Garrulax courtoisi) is an independent species” [Avian Res.13 (2022) 100022]
- Altitudinal seasonality as a potential driver of morphological diversification in rear-edge bird populations
- Shifts in phenology of autumn migration and wing length among reedbed passerines along the East Asian-Australasian Flyway
