Temporal variations of reference evapotranspiration and controlling factors: Implications for climatic drought in karst areas
2022-09-28XiaojiaoGuoWenzhongWangChengxiLiWeiWangJianshengShiYingMiaoXingboHaoDaoxianYuan
Xiao-jiao Guo ,Wen-zhong Wang,3 ,Cheng-xi Li ,Wei Wang* ,Jian-sheng Shi,2 ,Ying Miao ,Xing-bo Hao,Dao-xian Yuan
1 Key Laboratory of Groundwater Sciences and Engineering, Ministry of Natural Resources, Institute of Hydrogeology and Environmental Geology, Chinese Academy of Geological Sciences, Shijiazhuang 050061, China.
2 Ecogeological Survey Center of China Geological Survey, China Aero Geophysical Survey and Remote Sensing Center for Natural Resources, Beijing 100083, China.
3 China University of Geosciences (Wuhan), Wuhan 430074, China.
4 Key Laboratory of Karst Dynamics, Institute of Karst Geology, Chinese Academy of Geological Sciences, Guilin 541004, Guangxi, China.
5 Geological Exploration Institute of Shandong Zhengyuan, China Metallurgical Geology Bureau, Jinan 250101, China.
6 Hebei Coal Geology Bureau fourth Geological Brigade, Zhangjiakou 075100, Hebei, China.
Abstract: Variations in reference evapotranspiration (ET0) and drought characteristics play a key role in the effect of climate change on water cycle and associated ecohydrological patterns.The accurate estimation of ET0 is still a challenge due to the lack of meteorological data and the heterogeneity of hydrological system.Although there is an increasing trend in extreme drought events with global climate change,the relationship between ET0 and aridity index in karst areas has been poorly studied.In this study,we used the Penman-Monteith method based on a long time series of meteorological data from 1951 to 2015 to calculate ET0 in a typical karst area,Guilin,Southwest China.The temporal variations in climate variables,ET0 and aridity index (AI) were analyzed with the Mann-Kendall trend test and linear regression to determine the climatic characteristics,associated controlling factors of ET0 variations,and further to estimate the relationship between ET0 and AI.We found that the mean,maximum and minimum temperatures had increased significantly during the 65-year study period,while sunshine duration,wind speed and relative humidity exhibited significant decreasing trends.The annual ET0 showed a significant decreasing trend at the rate of -8.02 mm/10a.However,significant increase in air temperature should have contributed to the enhancement of ET0,indicating an “evaporation paradox”.In comparison,AI showed a slightly declining trend of -0.000 5/a during 1951-2015.The change in sunshine duration was the major factor causing the decrease in ET0,followed by wind speed.AI had a higher correlation with precipitation amount,indicating that the variations of AI was more dependent on precipitation,but not substantially dependent on the ET0.Although AI was not directly related to ET0,ET0 had a major contribution to seasonal AI changes.The seasonal variations of ET0 played a critical role in dryness/wetness changes to regulate water and energy supply,which can lead to seasonal droughts or water shortages in karst areas.Overall,these findings provide an important reference for the management of agricultural production and water resources,and have an important implication for drought in karst regions of China.
Keywords: Reference evapotranspiration;Aridity index;Penman-Monteith method;Sunshine duration;Guilin
lntroduction
Evapotranspiration (ET) is an important process in the energy balance and hydrological cycle (Liu et al.2016;Gong et al.2020),which is directly affected by land use and climate change (Zhao et al.2014;Chen et al.2015;Fan et al.2016).Global land ET returns about 60% of annual land precipitation to the atmosphere (Jung et al.2010),which has a strong impact on hydrological and meteorological processes.As such,ET is a key hydrological variable that represents a major form of water loss for catchments,and also determines groundwater recharge and surface runoff (Zhang et al.2015).Therefore,it is one of the leading indicators for connecting climate change and water cycle(Feng et al.2017;Cao et al.2018),as ET represents a major water and energy flux for terrestrial ecosystems,with consequences that feed back to the climate system.
Reference evapotranspiration (ET0) is defined as the rate of ET from a hypothetical reference crop with an assumed crop height of 0.12 m,a fixed surface resistance of 70 s m-1and an albedo of 0.23,where the reference surface closely resembles an extensive surface of green grass of uniform height,actively growing,completely shading the ground and with adequate water (Allen et al.1998).Thus,ET0reflects the maximum water demand of the environment to maintain water balance,as a crucial element of the hydrological cycle.As such,the accurate estimation of ET0and its spatial and temporal variations are of great significance for clarifying the influence of climate change on hydrologic cycle,crop water requirements,irrigation schedule and ecoenvironmental problems (Gong et al.2020).Additionally,ET0is also a main driver of climatic drought (Huo et al.2013;Zhang et al.2015;Zhang et al.2018a).Fisher et al.(2017) highlighted ET as the main indicator of extreme drought events.Moreover,the future of ET represents a keystone climate variable that uniquely links ecosystem functioning,carbon and climate feedbacks,agricultural management,and water resources (Fisher et al.2017).
Climate changes cause the temperature increase and further accelerate the water cycle,and it is also expected to increase ET0or pan evaporation,as indicated by studies worldwide (Jung et al.2010;Yin et al.2010;Feng et al.2017).However,relevant literatures have reported that ET0and pan evaporation,have decreased over the past decades in many areas of the world,including the United States (Irmak et al.2012),former Soviet Union(Peterson et al.1995),Australia (Roderick and Farquhar,2004),Mexico (Breña-Naranjo et al.2017),India (Chattopadhyay and Hulme,1997),southern Canada (Burn and Hesch,2007),New Zealand (Roderick and Farquhar,2005),Thailand(Tebakari et al.2005),and China (Yin et al.2010;Liu et al.2012;Huo et al.2013;You et al.2013;Wang et al.2017),which is known as the “evaporation paradox” (Roderick and Farquhar,2002;Rotstayn et al.2006;Fu et al.2009;Feng et al.2017;Wang et al.2017).By contrast,evaporation has increased in many areas of the world,such as Turkey (Dadaser-Celik et al.2016),Iran (Nouri and Bannayan,2018),most Nile River riparian countries (Onyutha,2016),Beijing (China) in 1951-2010 (Liu et al.2014),and the Heihe River Basin (Du et al.2016;Luo et al.2017).Fu et al.(2009) concluded that the observed pan evaporation trends are not universal.To our knowledge,neither the variable patterns of ET0or pan evaporation nor the control factors have been well studied.Therefore,the dominant meteorological variables associated with ET0changes need to be identified in order to have a comprehensive understanding of climate change and its impact on hydrological cycle.However,it is complex and related to a multitude of factors such as meteorological influences,water-table depth (Zhang et al.2018;Gong et al.2020),land use types,unsaturated zone characteristics,and climate zone.In addition,there is still no uniform conclusion on the cause of evapotranspiration changes.Zhao et al.(2014) analyzed the spatial and temporal trends of reference evapotranspiration and aridity index in the Loess Plateau region during 1961-2012,and showed that wind speed was the most sensitive meteorological factor to ET0.Zhang et al.(2015) reported that sunshine duration is the major factor driving the decrease in ET0in the Yellow River Basin,China.Yin et al.(2010) and Zhang et al.(2011) demonstrated that the decrease in potential evapotranspiration was consistent with observed widespread decreases in wind speed in most climate regions mainly distributed in Western China and North China,and the declined sunshine duration was the primary factor for decreasing ET0in subtropical and tropical humid regions in South China,resulting from increasing cloud coverage and aerosol concentration.Chattopadhyay and Hulme (1997) found that,in winter and pre-monsoon seasons,relative humidity was the most important factor dominating the decreasing trend in potential evapotranspiration,whereas in the monsoon season,the decreasing trend of ET0seemed to be caused by a reduction in radiation resulting from increased cloudiness.
Southwest China is one of the largest karst regions in the world,with an area of approximately 500 000 km2(Yuan,1991).In particular,the karst landform of Guilin city is famous worldwide,with a total karst area of 554.5 km2.The main karst landforms are peak cluster depression and peak forest plain,and the climate is characterized by rainy and hot summer.Although there is abundant annual rainfall here,it is prone to cause seasonal drought due to the rapid underground drainage system.Karst drainage systems are usually associated with a high degree of heterogeneity due to uneven permeability development (Yonge et al.1985).Moreover,the poor storage capacity of surface water and strong infiltration have significant impact on regional hydrological processes.This area is characterized by a low water storage capacity and highly fragile ecological environment(Gao et al.2016),which is vulnerable to drought in the context of climate change and human activities(Deng et al.2018;Zhang et al.2018a).Qian et al.(2011) noted that droughts have occurred frequently in regions from Southwest China to the Yellow River,North China,and the southwestern part of Northeast China,with two centers of high frequency in North China and Southwest China.Moreover,Liu et al.(2017) indicated that both the risk of drought and its severity have increased significantly in the past decades in Southwest China and that this situation might have developed evenly throughout Southwest China.For instance,a severe drought occurred in Southwest China from autumn 2009 to spring 2010 (Feng et al.2017),which affected more than 60 million people and caused a direct economic loss of~23.66 billion RMB.Similarly,an extreme summer-autumn drought in the Sichuan Province and the city of Chongqing in 2006 caused a 21.6 billion RMB in economic losses,destroying 3.39 × 10⁴km2of agricultural land and causing drinking water shortages for 18 million people (Zhang and Zhou,2015).Nevertheless,the relationship between ET0and extreme drought is not fully understood,which remains the most important and controversial topic in the hydrometeorology community.Therefore,the study of temporal variations of ET0and AI in a typical karst area is of great importance for understanding of the hydrological process and the influence of climate change on water resources in karst regions.
The objectives of the present study were to (1)analyze the temporal evolution of key climatic variables over the recent 65 years (1951-2015) of a karst region in Guilin,China;(2) detect the temporal changes in annual and seasonal ET0and AI in Guilin during 1951-2015 based on linear regression and the Mann-Kendall trend test;(3)identify the dominant meteorological variables related to the cause of the observed trends in ET0in Guilin,and (4) estimate the relationships among AI,precipitation and ET0.
1 Study area and data collection
1.1 Study area
Guilin is located in the northeast of the Guangxi Autonomous Region,Southwest China (24°15′-26°23′N,109°45′-119°29′E),covering an area of 27 809 km2,with the average elevation of 150 m.Topographic maps of this region reveal higher elevations mainly present in the north,west and east,and lower elevations in the middle and south.Due to the rapid urban development,the total population of Guilin city had increased from 1.965 million in 1953 to 5.3 million in 2015.In particular,the total population increased by 1.322 million between 1964 and 1982.Since 1990,the population has continued to grow at a rate of 248 000 per year.At present,the total population of Guilin city is 5.4 million.
The area of Guilin is characterized by a subtropical monsoon climate,dominated by the East Asian Monsoon with two distinct seasons,a colddry winter and a hot-rainy summer.The mean annual precipitation is 1886 mm,with the rainy season from April to August accounting for 70%of total rainfall,while the period from September to March is drier.The mean annual air temperature is approximately 19.0°C.The minimum mean annual temperature (17.9°C) was observed in 1984 and the maximum (20.1°C) was observed in 2007.The hottest month is July with an average temperature of 28.2°C,while the coldest month is January which has a mean of 7.9°C in Guilin City between 1951 and 2014 (Guo et al.2015).Mean annual relative humidity (RH) is 69.3%,and the annual mean sunshine duration is 319.9 h (Table 1).In this study,the four seasons were defined as winter (November-January),spring (February-April),summer (May-July),and autumn (August-October),respectively.
1.2 Data collection
In this study,daily meteorological data during 1951-2015 in Guilin were obtained from the China Meteorological Data Sharing Service System (http://data.cma.cn/),including precipitation (mm),mean,maximum and minimum temperature (Tmean,Tmaxand Tmin,°C),relative humidity (RH,%),water vapor pressure (hpa),sunshine duration (h) and wind speed (m s-1) at a height of 10 m.The observation dataset was subjected to strict quality and homogenization control,using the procedures described in Li et al.(2011).Information on the multiyear annual average meteorological variables is presented in Table 1.

Table 1 Meteorological station site and mean meteorological variables of Guilin,China
2 Materials and methods
2.1 FAO-56 PM method
The Food and Agriculture Organization (FAO)Penman-Monteith method is recommended by theFAO as the standard procedure for accurate estimation of ET0in different regions of the world(Allen et al.1998),due to its physically based characteristics that enable the incorporation of aerodynamic and physiological parameters.The Penman-Monteith method can be expressed as:
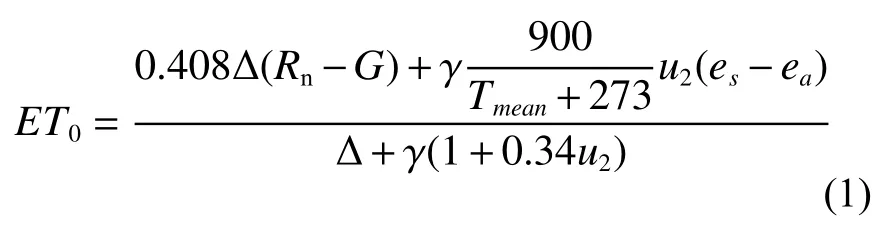
Where:ET0is the reference evapotranspiration(mm day-1);Δ is the slope of the vapor pressure curves (kPa °C-1);Rnis the net radiation at the crop surface (MJ m-2day-1);γis the psychrometric constant (kPa °C-1);Gis the soil heat flux density(MJ m-1day-1);Tmeanis the mean daily air temperature (°C);u2is the wind speed at a 2-m height(m s-1);esis the saturation of vapor pressure (kPa);andeais the actual vapor pressure (kPa).
2.2 Aridity index
In this study,AI was calculated as the ratio of ET0to precipitation,representing the degree of balance between demand for water at the land surface and the atmospheric supply water (Su et al.2015).AI was calculated with the following formula,
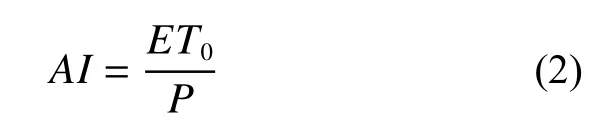
Where:ET0is the reference evapotranspiration andPis the precipitation (mm).The annual and seasonal AI values were calculated using total annual and seasonal Penman-Monteith ET0and total annual and seasonal precipitation.
2.3 Mann-Kendall trend test
The non-parametric Mann-Kendall test is recommended by the World Meteorological Organization for trend analysis in environmental time series data(Mitchell et al.1966).This method has been widely used in hydrological and meteorological trend detection studies (e.g.Zhao et al.2014;Fan et al.2016;Feng et al.2017).Therefore,in this study,the significance of trends was tested by the non-parametric Mann-Kendall statistical test.The null hypothesisH0is defined as,in the sample of data {xi,i=1,2,···,n},xiis independent and identically distributed.The alternative hypothesisH1is that a monotonic trend exists inX.The statisticSof Kendall’s tau is defined as follows:
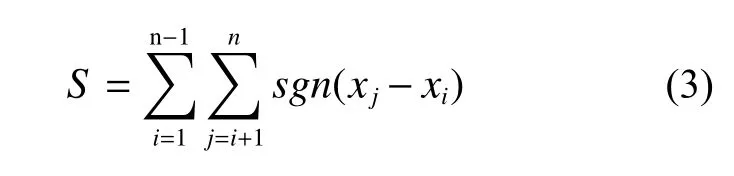
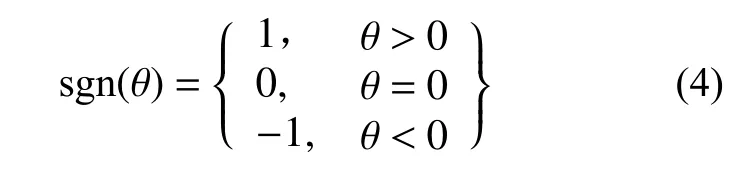
Where:nis the length of the dataset,xiandxjare the data values at the time ofiandj(j>i),respectively,andsgn(xj -xi) is the sign function:
Whenn≥ 8,the statisticSlargely follows normal distribution with the mean and the variance as follows (Mann,1945;Kendall,1975):
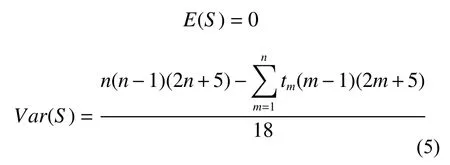
Where:nis the length of the dataset,mis the number of tied groups,andtmdenotes the number of ties of the extent ofm.The standardized test statisticZcis computed as follows:
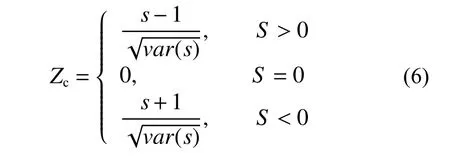
Where:Zcis the test statistic.Positive values ofZcindicate increasing trends whereas negative values show decreasing trends.Trend testing is performed at a given α significance level.When |Zc| >|Z1-α/2|,in whichZ1-α/2is the standard normal deviation and α is the significance level for the test.
3 Results
3.1 Temporal characteristics of reference evapotranspiration
3.1.1 Annual and inter-annual scales
The trends in annual,inter-annual ET0and the linear regression for Guilin during 1951-2015 are shown in Fig.1.The annual ET0values of Guilin over the past 65 years ranged from 1 010.4 mm to 1 269.5 mm,with a mean value of 1 137.9 mm.The maximum and minimum ET0occurred in 1956 and 2002,respectively.The averaged annual ET0showed a significant decreasing trend with the rate of-8.02 mm/10a,which had passed the Mann-Kendall significance test at the 0.05 level.
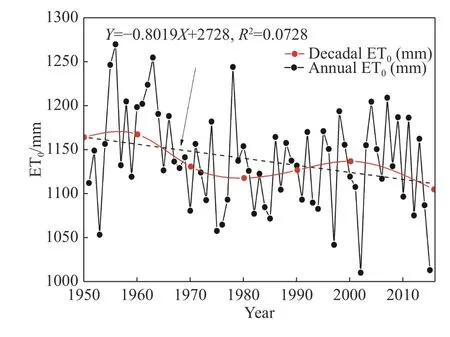
Fig.1 Annual and inter-annual variations of ET0 for Guilin,China from 1951 to 2015
The inter-decadal and seasonal variations of ET0were calculated over 65 years (Table 2).The results showed that inter-annual ET0exhibited an“increasing-declining-increasing-declining” pattern showing fluctuated changes (Fig.1).In particular,annual ET0first showed an increasing trend,with a relatively high value of 1 165.75 mm during 1951-1960.The highest ET0value occurred in the 1960s,after which it declined rapidly from 1961 to 1980,indicating the relatively wetter periods in the 1970s.After the onset of urban development in 1990,the ET0increased greatly during the 1990s and 2000s,with a changing amplitude of 0.8% and 0.9%,respectively,and followed by a decrease from 2010 to 2015.
Table 2 illustrates the inter-decadal,seasonal ET0and magnitude relative to the previous decade during 1951-2015 for Guilin.The spring and autumn mean ET0showed declining trends from 1960s to 1980s,consistent with the annual ET0change,and winter ET0synchronously exhibited a decreasing trend,except in the 1970s (Table 2).Meanwhile,spring and autumn ET0were low in the 1970s at 201.95 mm,375 mm,respectively.In contrast,summer ET0presented an increasing trend from 1960s to 1980s with the exception of a declining trend in the 1970s,indicating a much drier climate condition in recent decades.However,spring,autumn,and winter ET0showed increasing trends in the 1990s and 2000s,except for winter ET0in the 2000s,indicating a much drier trend in more recent decades.Meanwhile,summer ET0also showed an increasing trend in the 2000s (Table 2).The annual,spring,autumn and winter ET0all showed decreasing trends during 2010-2015.
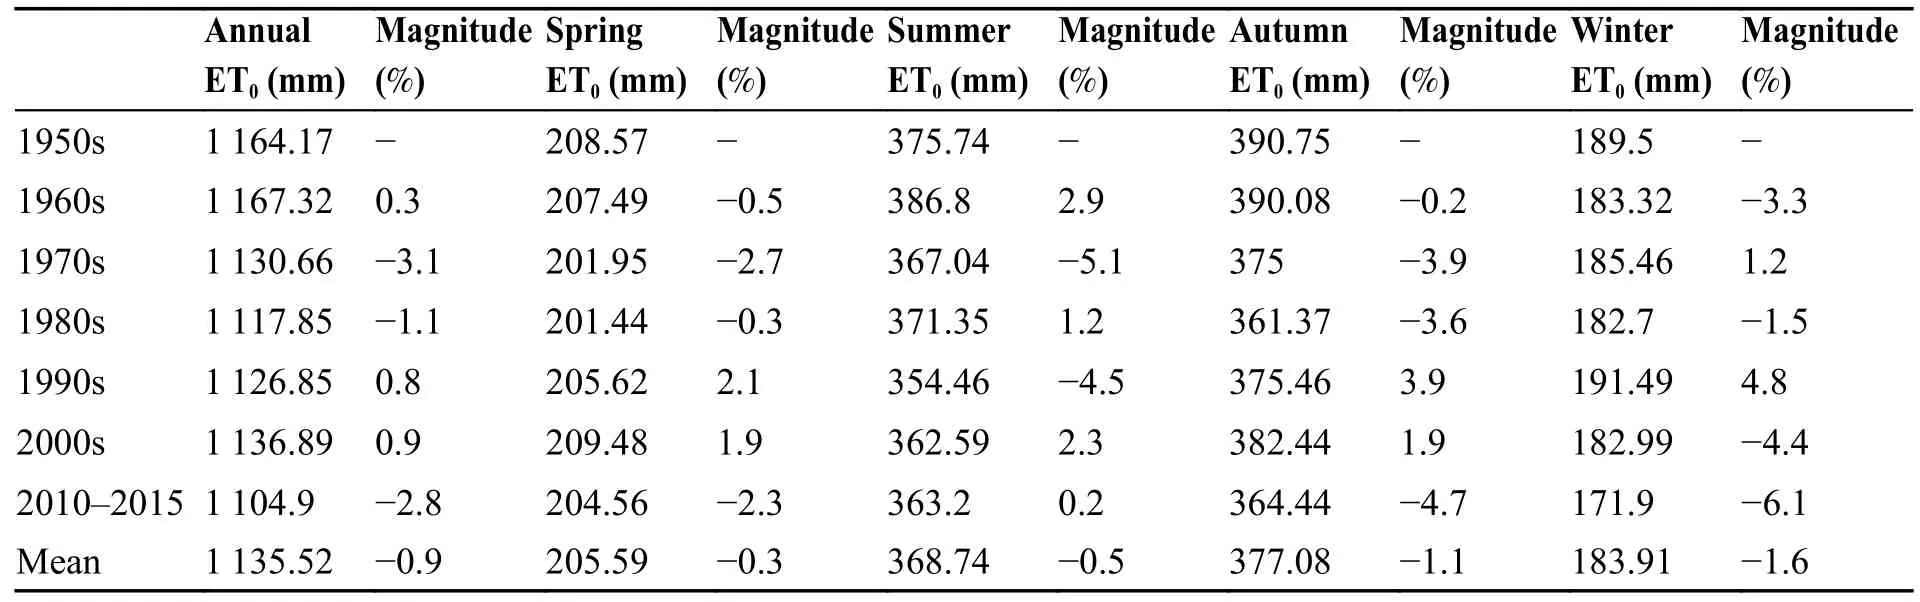
Table 2 Interdecadal variation in the annual and seasonal reference evapotranspiration (ET0) in Guilin,China
3.1.2 Monthly and seasonal scales
As expected,ET0exhibited clear monthly fluctuations,which were influenced by different meteorological variables.Fig.2 presents the monthly series for precipitation,air temperature and ET0for Guilin during 1951-2015.The monthly mean ET0was 95.1 mm,lower than the monthly mean precipitation (157.1 mm) in Guilin.Monthly ET0first increased gradually and continuously from 51.2 mm in January to 146.3 mm in July,and then decreased during the rest of the year,and was overall characterized by a single peak distribution.The monthly ET0variation had a similar shape to the natural change in air temperature;however,the maximum ET0in July was not synchronous with the maximum precipitation in June (Fig.2).In July,ET0reached a maximum with a value of 146.3 mm,whereas the minimum value occurred in January,approximately 51.2 mm.Moreover,the majority of ET0occurred in the period from May to October (Fig.2),accounting for 65.8% of the total ET0.In consistent with this,ET0was higher than100 mm and exceeded the monthly mean ET0between May and October.Interestingly,the maximum seasonal ET0occurred in autumn (444.2 mm) rather than in summer (424.7 mm),while the minimum was observed in winter due to the lower air temperature.As shown in Fig.2,ET0is higher than precipitation between September and December,characterized by relatively high air temperature,which could trigger autumn droughts.
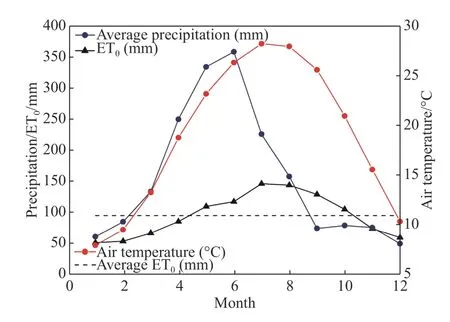
Fig.2 Monthly change of precipitation,air temperature and ET0
Fig.3 and Table 3 present the time series analysis of the seasonal ET0trend in Guilin during 1951-2015.As shown in the figure,ET0showed a decreasing trend with a rate of -4.231,-2.871,and-1.138 mm/10a in summer,autumn and winter,respectively.In spring,it showed a slightly positive trend of 0.134 mm/10a (Fig.3).According to Mann-Kendall analysis,a significant decreasing trend was only observed in summer with statistically significant at the 0.05 level,and the slope in summer was greater than those of the other three seasons (Table 4).In addition,summer ET0accounted for 32.4% of annual ET0(Table 3).Therefore,the significant decreasing trend of annual ET0could be attributed to the decreased summer ET0,which was consistent with the results reported by Wang et al.(2012a),as well as Wang et al.(2017)throughout China.
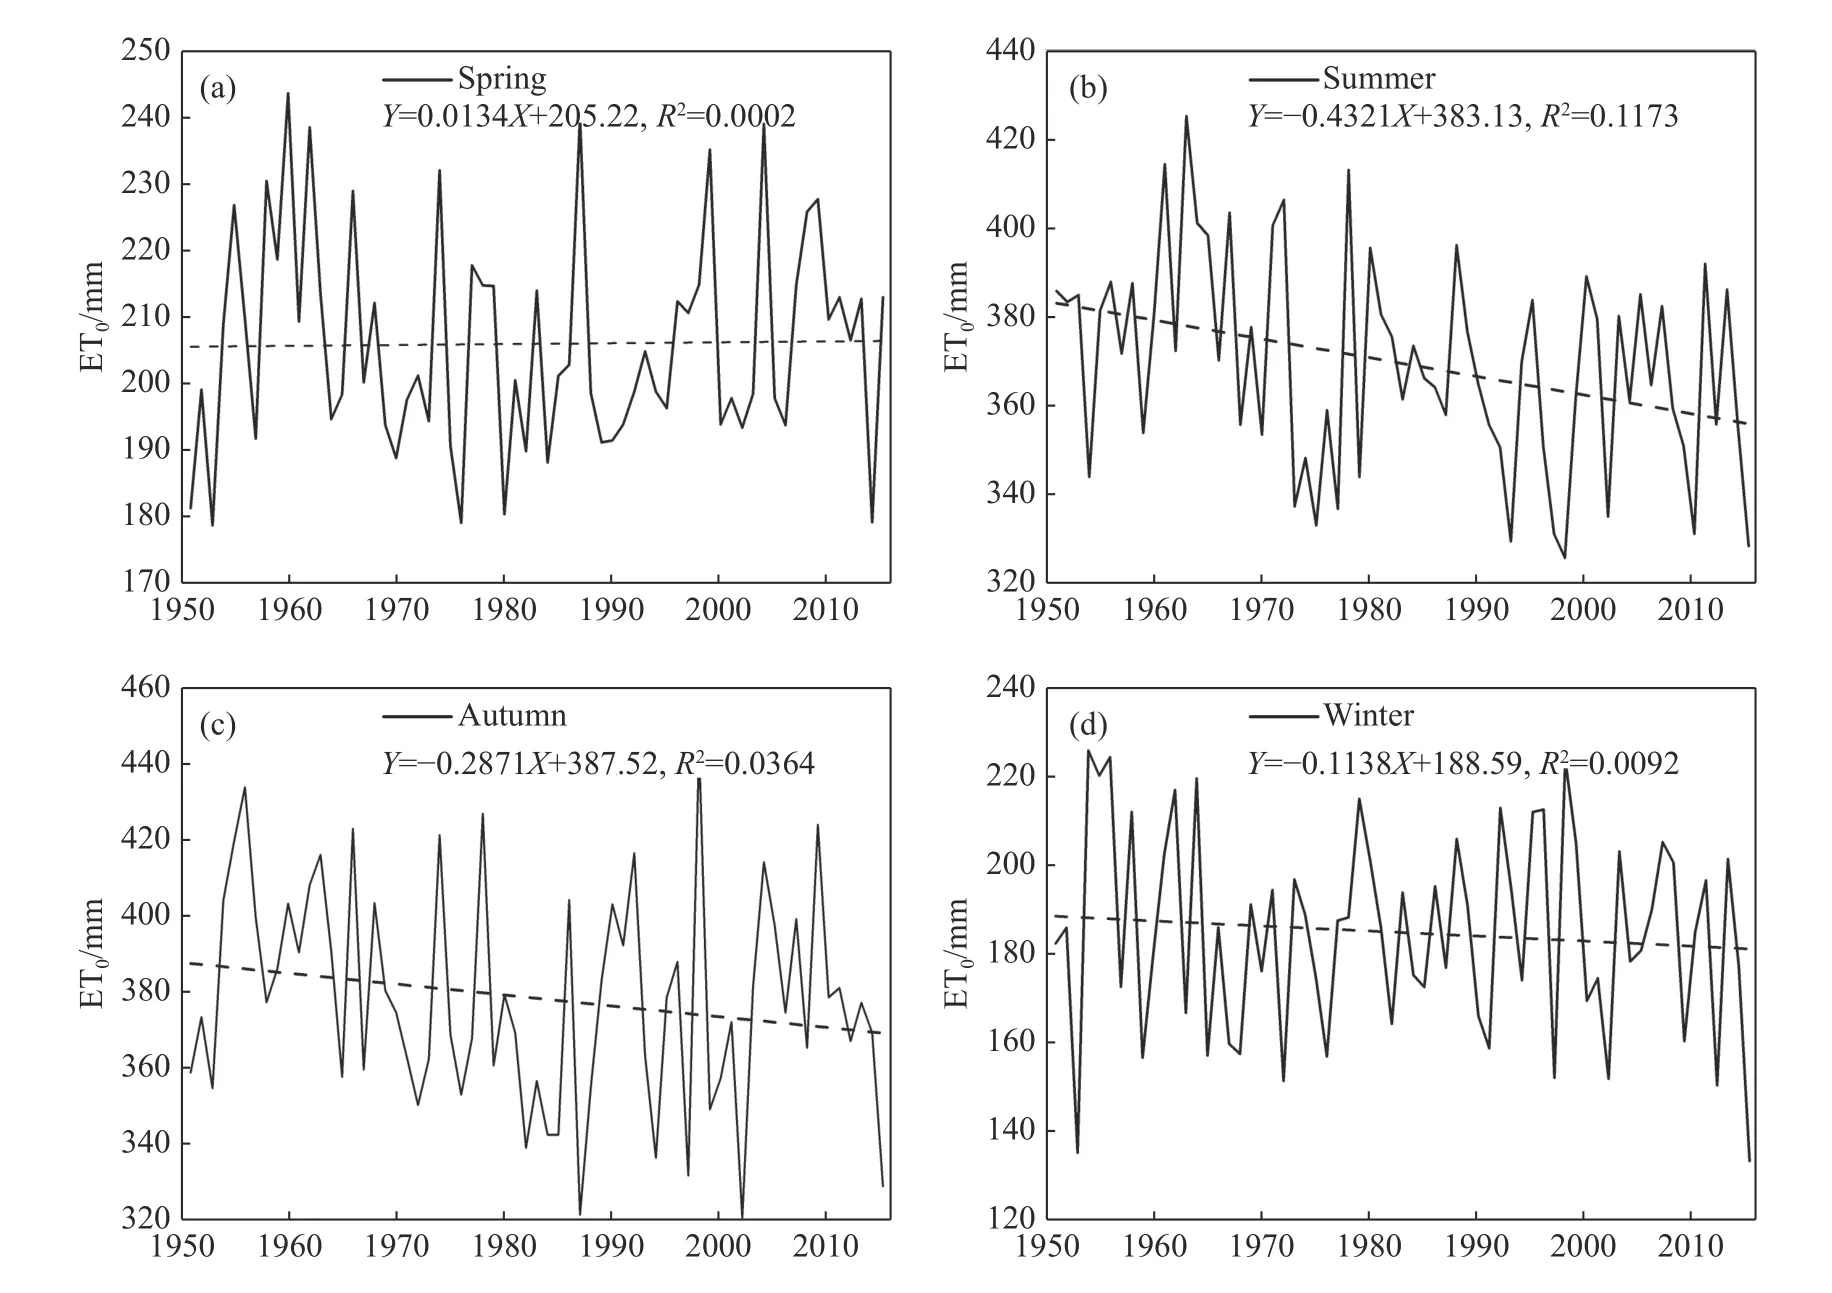
Fig.3 Seasonal variations of ET0 during (a) spring,(b) summer,(c) autumn,and (d) winter in Guilin,China from 1951 to 2015
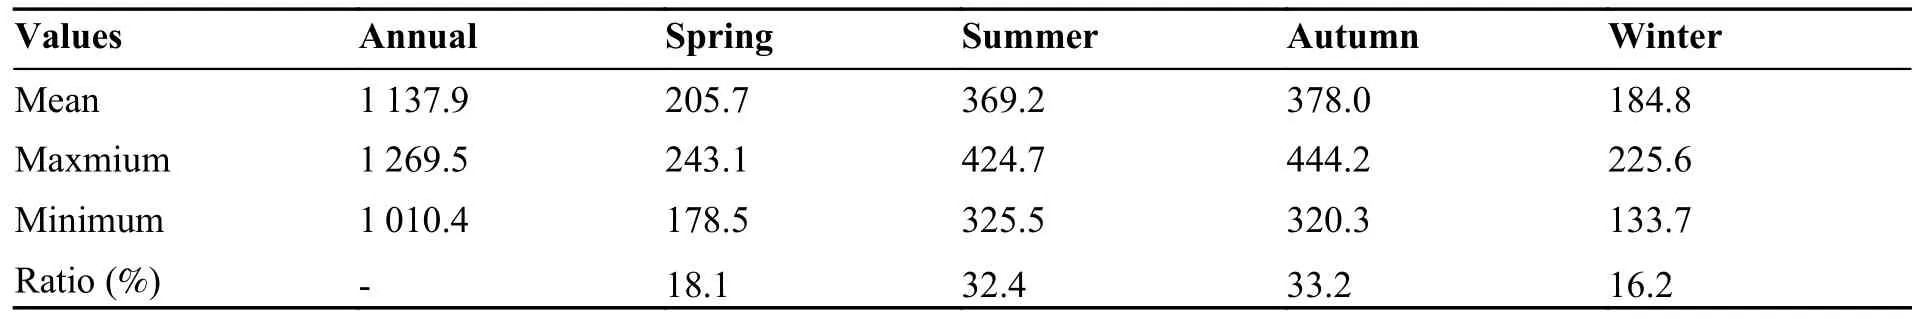
Table 3 Mean,maximum and minimum annual and seasonal ET0 (Unit: mm)
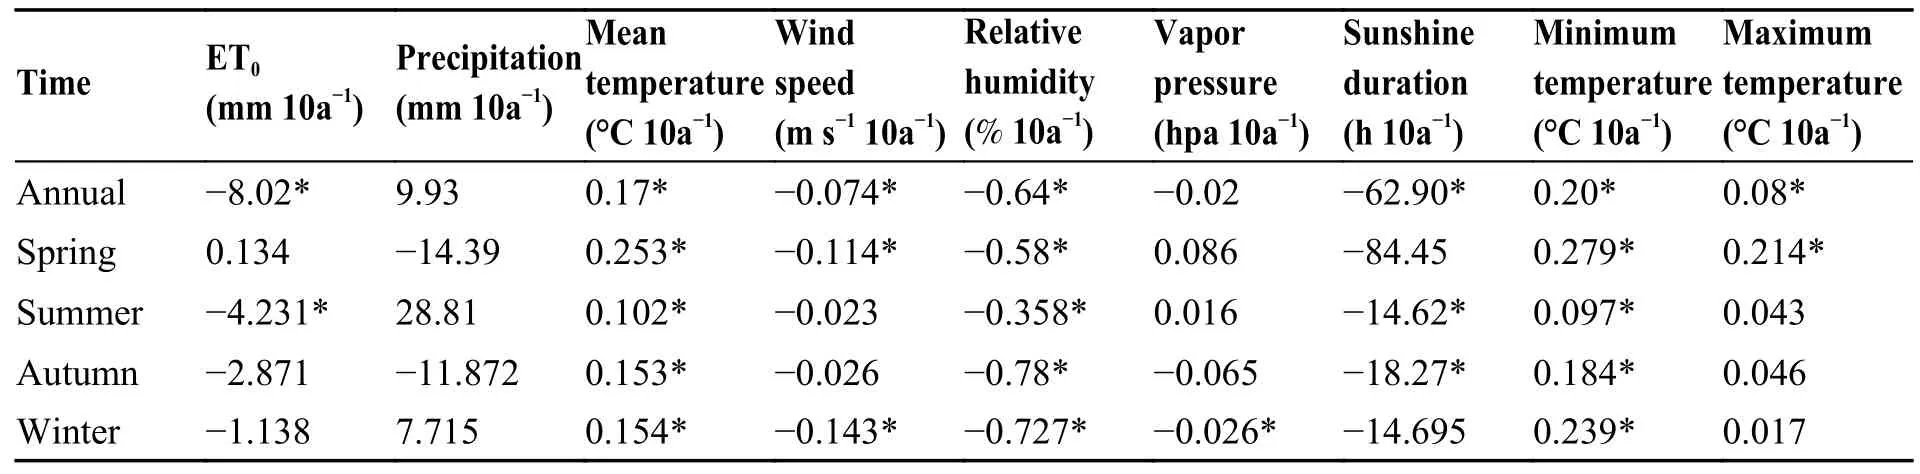
Table 4 Annual,seasonal changing rates of reference evaporation (ET0) and climate factors in Guilin,China
3.2 Temporal trends in the annual and seasonal aridity index
The temporal trends of AI in Guilin on annual and seasonal time scales were analyzed with linear regression and the Mann-Kendall trend test (Fig.4 and Fig.5).The linear regression analysis indicated that the annual AI exhibited a decreasing trend at a rate of -0.000 5/a.However,Mann-Kendall analysis showed the trend for annual AI was insignificant from 1951 to 2015 (p > 0.05),consistent with the results from Southwest China(Zhao et al.2018).This result indicates that the Guilin area has become wetter in recent decades.
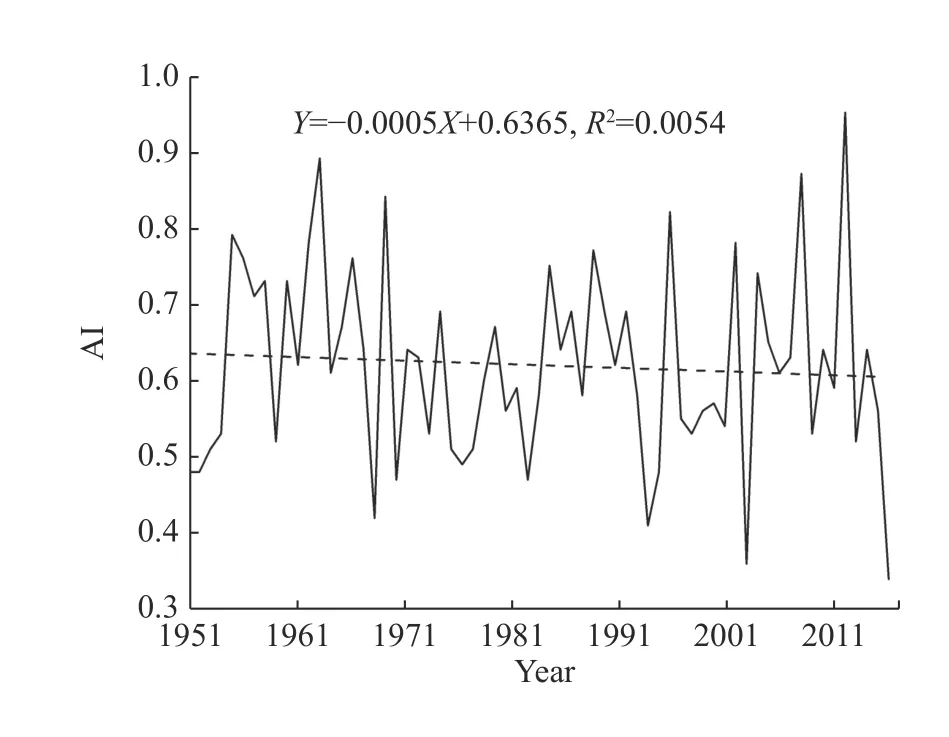
Fig.4 Trend in the annual aridity index (AI) for Guilin,China during 1951-2015.Dotted line represents the linear fitting line
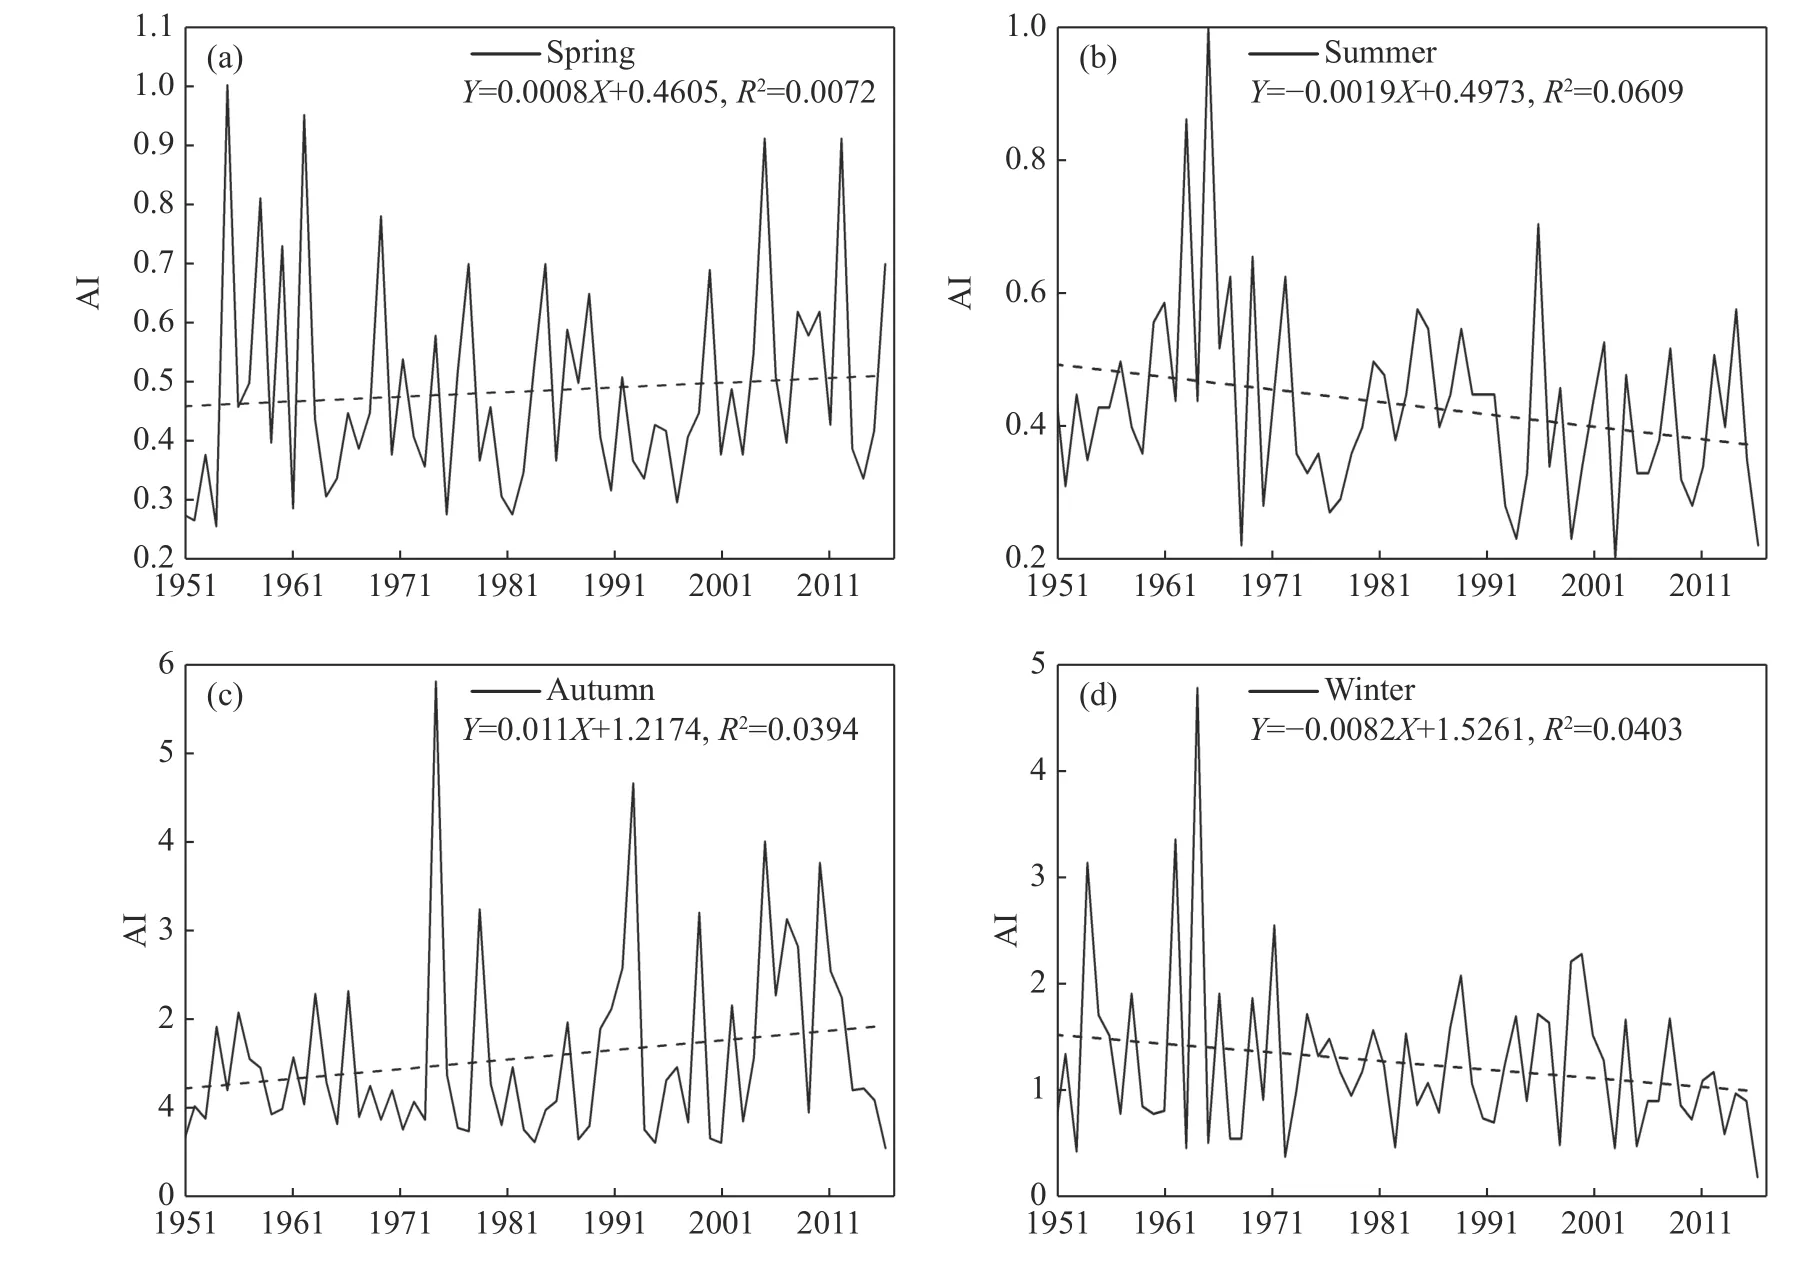
Fig.5 Seasonal variations in the aridity index in (a) spring,(b) summer,(c) autumn,and (d) winter for Guilin,China from 1951 to 2015.Dotted line is the linear trend
The temporal trends of AI in the four seasons were also analyzed with linear regression and the Mann-Kendall test (Fig.5).As showed in Fig.5,increasing trends in AI were observed in spring and autumn,while decreasing trends in AI were detected in summer and winter.The linear regressions revealed a higher average increase in autumn(0.011/a) than in spring (0.000 8/a),indicating that autumn tended to be drier.Meanwhile,the decrease in AI was greater in winter (-0.008 2/a) than in summer,which was ascribed to the differences in the changes of precipitation in different seasons.Furthermore,the Mann-Kendall test revealed that the trends of AI in all seasons were insignificant (p> 0.05),which was consistent with the results of Wen et al.(2018).It can be seen in Fig.5 that autumn AI was higher than that in the other seasons,which ranges from 0.56 to 5.79,with a mean value of 1.58.The autumn with a higher ET0and AI,was characterized by lower precipitation,indicating a higher risk of autumn drought in Guilin.In addition,seasonal drought in Southwest China is markedly magnified by the decreases in precipitation and increases in temperature (Feng et al.2017),which could alter the hydrologic cycle,redistribute water resources,aggravate water shortages and deteriorate ecological conditions.Most importantly,the risk and severity of drought might have become more evenly distributed,with decreased spatial variety (Liu et al.2017).This means that drought will be more widespread throughout Southwest China.
3.3 Trend analysis of meteorological variables
The trend analysis of the meteorological variables during 1951-2015 in Guilin are shown in Fig.6.Tmean,Tminand Tmaxexhibited significantly increasing trends,while sunshine duration,wind speed,and RH showed an obviously decreasing trend(Fig.6).Trend analyses confirmed that Tmean,Tminand Tmaxin Guilin have increased significantly (p <0.05) at the rates of 0.17°C 10a-1,0.20°C 10a-1and 0.08°C 10a-1,respectively.And the increasing rate in Tminwas higher than that of Tmax(Table 4),which was in agreement with the finding of Fan et al.(2016).Conversely,sunshine duration,wind speed and RH decreased significantly (p < 0.05) at the rates of 62.90 h 10a-1,0.074 m s-110a-1and 0.64% 10a-1,respectively.No significant (p >0.05) decreasing trend of mean vapor pressure was found at a rate of -0.02 hpa 10a-1,while annual precipitation had increased insignificantly (p >0.05) at a rate of 9.93 mm 10a-1for the Guilin City.

Fig.6 Annual variability trends of meteorological factors during 1951-2015.(a) precipitation,(b) air temperature,(c) wind speed,(d) relative humidity,(e) mean vapor pressure,(f) sunshine duration,(g) minimum temperature,and (h) maximum temperature.Red dotted line represents linear regression of different meteorological variables,and gray dotted line represents 65-year average value
The seasonal trends of climate variables from 1951 to 2015 are presented in Table 4.On the seasonal scale,significant increasing trends in both Tmeanand Tminwere observed in all seasons (Table 4),which were consistent with the annual temperture trend.The spring,autumn and winter Tmeanand Tminincreased by 0.253°C 10a-1,0.153°C 10a-1,0.154°C 10a-1,and 0.279°C 10a-1,0.184°C 10a-1,0.239°C 10a-1,respectively.Tmaxalso showed an increasing trend in all four seasons,but was significant trend (p < 0.05) only in spring.The significant increasing trend and the maximum changing rate both were observed in spring,which consequently resulted in an increase of ET0by 0.134 mm10a-1in spring over the past 65 years.
It should be noted that RH had a significant decreasing trend (p < 0.05) in all four seasons.In autumn and winter,RH reduced by -0.078,-0.072 7% a-1,and -0.058,-0.035 8% a-1for spring and summer,respectively.Greater decreases were observed in cooler seasons than warmer seasons.Wind speed also exhibited decreasing trends in all four seasons,although only those in spring and winter were significant (p < 0.05) with the rate of 0.114 m s-110a-1and 0.143 m s-110a-1,respectively.Simultaneously,sunshine duration showed a declining trend in all four seasons.According to the Mann-Kendall analysis,the decreasing trend of sunshine duration was significant (p < 0.05) in summer and autumn seasons.As for vapor pressure,there was an increasing trend in spring and summer,while a decreasing trend in autumn and winter,of which only that in winter was significant(p < 0.05) at the rate of 0.026 hpa 10a-1.Precipitation displayed an insignificant fluctuation trend over the past 65 years (Table 4).
4 Discussion
4.1 Factors controlling the change in ET0
To investigate the major factors contributing to the change in ET0,including precipitation,Tmean,wind speed,RH,vapor pressure,sunshine duration,Tmaxand Tmin,correlation analysis combined with linear regression was used to determine the correlations of meteorological variables with ET0(Table 5).Table 5 presents the annual and seasonal correlations of ET0and the aforementioned meteorological variables.The results showed that ET0presented significant positive correlations with sunshine duration,wind speed and Tmax,but was negatively correlated with RH,vapor pressure and precipitation at the annual scale.In addition,there was an insignificant positive correlation between ET0and Tmean,and an insignificant negative correlation with Tmin.The highest contributor to ET0was sunshine duration,with the largest correlation coefficient of 0.784 (Table 5) among the variables.
However,the main factors exhibited great seasonal variations within the study period.In spring,ET0showed significant (p < 0.01) positive correlations with sunshine duration,Tmean,Tminand Tmaxduring 1951-2015,but significant negative correlations with RH (p < 0.01) and precipitation (p <0.05),respectively.In summer,ET0exhibited significant (p < 0.01) positive correlations with sunshine duration,Tmeanand Tmax,and a significant(p < 0.01) negative correlations with precipitation and RH.During autumn and winter,ET0presented significant (p < 0.01) negative correlations with RH,precipitation and vapor pressure.
Considering the trend test and linear regression analysis results,sunshine duration,wind speed and RH decreased over time,which were responsible for the decrease of ET0.However,the increases of Tmean,Tmaxand Tminplayed a contrasting role in enhancing ET0.The values of the regression coefficients also indicated that sunshine duration was the major climatic variable that influences the ET0on the annual scale,followed by wind speed (Table 4).Increasing aerosol and cloudiness resulting from intense human activities in recent decades,may have caused the reductions in solar radiation(Roderick and Farquhar,2002;McVicar et al.2012;Wang et al.2017),which can be regarded as the main causes of the decrease of ET0.Although RH showed a significant decrease trend from 1951 to 2015,a significant (p < 0.01) negative correlation with ET0was also observed,which offset the effect of the decreasing sunshine duration and wind speed on ET0.
Based on the correlation coefficients and the linear trend analysis,it can be concluded that ET0was most influenced by RH and air temperature in spring,but was largely driven by sunshine duration in summer.In autumn,the primary factor was sunshine duration,followed by wind speed.Tminand wind speed were the major climatic factors dominating the variability of ET0in winter.Therefore,the primary causes of ET0changes varied among different seasons,which was because of the combined effects of different meteorological factors.
4.2 The relationships among aridity index,ET0 and precipitation
Fig.7 illustrates the correlations among ET0,precipitation and aridity index from 1951 to 2015 for Guilin.The results showed that AI was positively correlated with ET0with a significant level ofp<0.01 (Fig.7a),and a correlation coefficient of 0.65,which was in accordance with the results from the Loess Plateau Region (Zhao et al.2014).In contrast,AI exhibited a significant negative correlation with precipitation (p < 0.01) and a greater correlation coefficient (0.95) (Fig.7b),indicating that the variation of AI was more sensitive to precipitation (Huo et al.2013;Liu et al.2013;Wen et al.2018;Zhao et al.2018).Nouri and Bannayan(2018) concluded that precipitation changes had the most contribution to seasonal and annual trends of AI in Iran.However,Sun et al.(2016) illustrated that potential evapotranspiration changes played a larger or comparable role in dryness/wetness changes than precipitation over the plateau of west Sichuan province in Southwest China.A similar result was also found by Sun et al.(2017),who suggested that ET0had a critical role in drought events and could amplify drought duration and intensity.Wen et al.(2018) pointed out that the occurrences of the extremely low AI values were mostly affected by the combined fluctuations of the ET0and precipitation.In addition,Tabari and Aghajanloo (2013) demonstrated that the increase of aridity in Iran was the cause of the concurrent occurrences of negative precipitation trends and positive ET0trends.In general,changes in AI are dependent on changes of ET0and precipitation (Zhao et al.2014).Previous studies have confirmed that although ET0is not the dominant controlling factor,it does have an important influence on changes in AI (Huo et al.2013;Wen et al.2018).
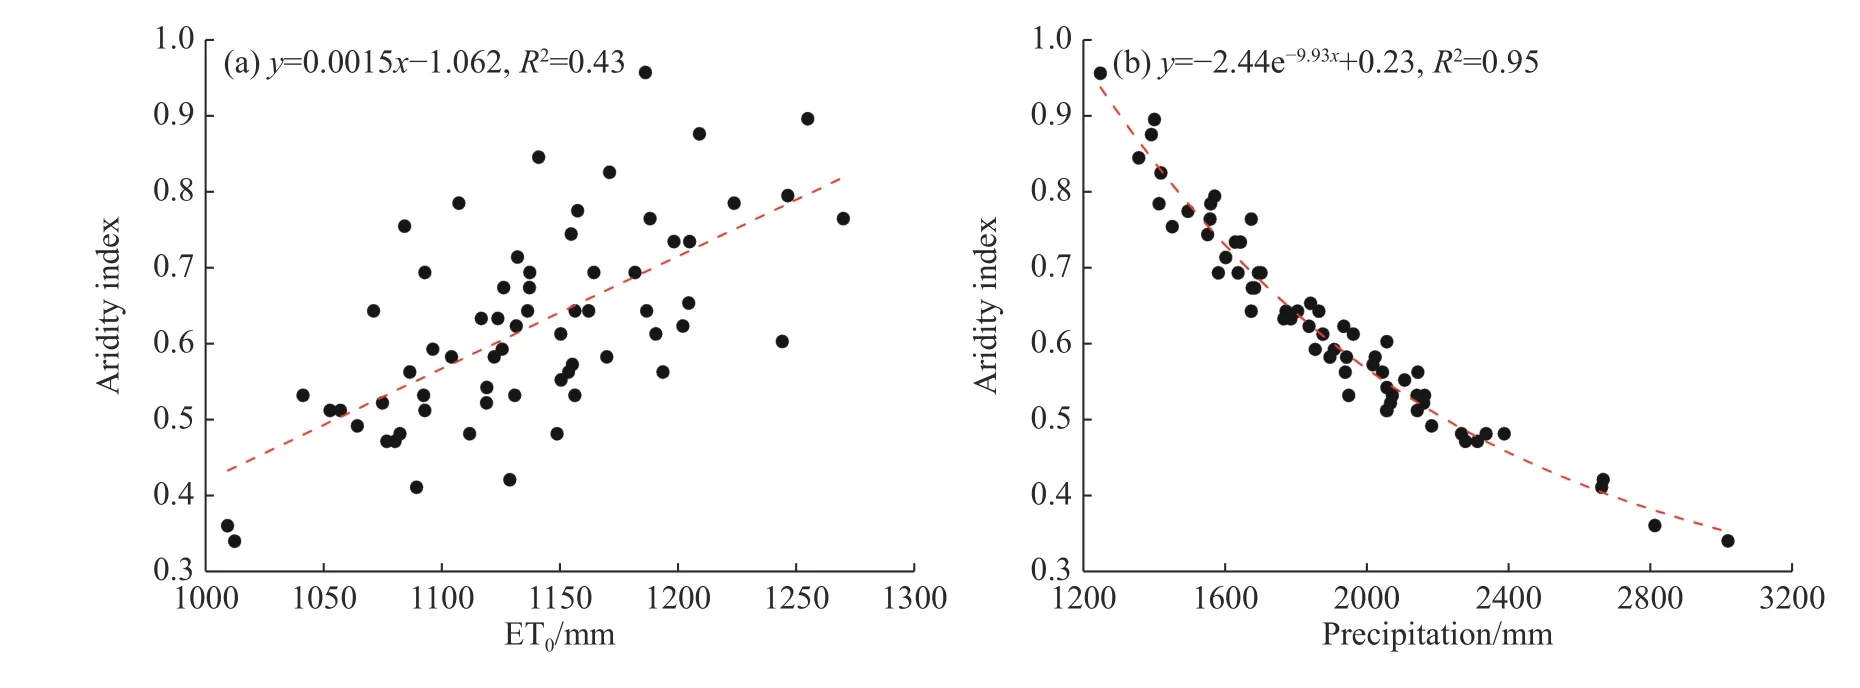
Fig.7 Scatter plots of the (a) relationship between ET0 and aridity index (ET0/P) and (b) precipitation and aridity index for Guilin,China during 1951-2015.Red dashed line is the fitted line
As a result,potential evapotranspiration represents a major water and energy flux,mainly driven by the energy supply,as a result of interactions among a number of physical variables (e.g.net radiation,wind speed,humidity,etc.).However,AI is mainly related to the water supply while other potential factors remain uncertain at this stage.Therefore,as shown above,precipitation was not the main cause of ET0change,although it had a primary control on the AI variations.Chen and Buchberger (2018) investigated the relationships between precipitation and potential evaporation,demonstrating that the two could be independent.These two variables (ET0and AI) probably reflect different thermal processes.However,in the present study,we could not quantitatively assess the contribution of ET0to the changes in AI.Further investigation into the physical mechanisms connecting these variables is still urgently needed.
4.3 Comparison of ET0 trends and the dominant influencing factors
Spatiotemporal variations of ET0in different climate regions have been globally reported over the past decades (Xu et al.2006;Yin et al.2010;Zhang et al.2011;Fan and Thomas,2013;Wang et al.2017;Xu et al.2017).We observed significant decreasing trends in annual ET0during 1951-2015 in Guilin,in agreement with Fan et al.(2016),who also detected significant decreasing trends in the subtropical monsoon zone during 1956-2015.The decreasing annual ET0was largely due to the reduction in summer ET0(p < 0.05).Moreover,the decline of sunshine duration contributed the most to decreasing ET0in tropical and subtropical monsoon zone (Yin et al.2010;Zhang et al.2011;Fan and Thomas,2018).Therefore,the “evaporation paradox” also exists in Guilin,as air temperature has significantly increased while ET0obviously decreased in the past 65 years.This phenomenon has attracted an extensive number of researchers to study the meteorological causes in recent years.Similar results relating to the most important controlling variables on ET0changes have been demonstrated in other studies.For example,Liu et al.(2016) reported that ET0had a slightly decreasing trend in Southwest China from 1960 to 2010.However,wind speed was the dominant variable driving the change in ET0,which was not compatible with this study.Feng et al.(2017) documented that sunshine hours and wind speed dominated the decreased change in ET0in Southwest China.Zhang et al.(2011) analyzed the sensitivity of ET0to meteorological variables in China,and found that the decrease in ET0was consistent with the decreases in net solar radiation resulting from increasing cloud coverage and aerosol concentration in the eastern and South China.Zheng and Wang (2015) found that decreasing solar radiation contributed the most to the decreasing ET0trend in southern part of China.Xu et al.(2006) indicated that the significant decreasing trend of ET0in the Changjiang (Yangtze River) Catchment was mainly caused by a significant decrease in net total radiation,followed by wind speed.Wang et al.(2007) reported that decreasing sunshine duration was the major cause of reduced potential evapotranspiration south of 35°N.Gao et al.(2016) concluded that although RH was the most sensitive variable responding to the annual change of ET0in a karst area (Guizhou Province,China),sunshine duration was identified as the essential main factor for the decline in annual ET0.Xu et al.(2017) found that RH was the most important meteorological element influencing annual ET0changes,followed by wind speed and sunshine duration.
Overall,there are two main possible driving factors for the decline in ET0or pan evaporation:Decreases in sunshine duration and wind speed(Liu et al.2004b;Wang et al.2007;Yin et al.2010;Wang et al.2012b;Zhao et al.2014;Breña-Naranjo et al.2017;Xu et al.2017;Zhang et al.2018b).However,no consensus has been reached as to the primary cause of the changes in ET0,which varies significantly from geographical region to region.For instance,surface wind speed was principally responsible for the decline of ET0in Australia (Roderick and Farquhar,2004),the Canadian Prairies (Burn and Hesch,2007),and China (Yin et al.2010;Wang et al.2012a;Luo et al.2017;Wang et al.2017;Chai et al.2018).Similarly,Yang et al.(2012) revealed that wind speed in Southwest China had a significant decrease with a rate of 0.24 m s-110a-1during 1969-2009.McVicar et al.(2012) reviewed the global studies of the trend in near-surface wind speed(termed ‘stilling’),and found that stilling was a widespread phenomenon,with a mean change rate of -0.14 m s-110a-1during the past 30 years across the globe.For comparison,in the present study,wind speed has declined significantly at a rate of-0.074 m s-110a-1during the past 65 years,which was lower than the globally averaged value.Notably,Feng et al.(2017) also found that wind speed in Guangxi Province decreased at a rate of -0.06 m s-110a-1,which was consistent with our results.Furthermore,the decreasing rate was approximately close to the average rates of -0.09 m s-110a-1,-0.08 m s-110a-1in China as a whole reported by Yin et al.(2010) and Fan et al.(2016),respectively,while relative lower than the average annual trend magnitude of -0.13 m s-110a-1in China during 1961-2007 estimated by Fu et al.(2011).Regionally,Fan and Thomas (2013)reported that the average decrease of wind speed in Yunnan Province was at a rate of -0.073 m s-110a-1.She et al.(2017) also indicated that the decreasing rate of wind speed in the middle reaches of Yellow River Basin was -0.076 m s-110a-1.These results were similar to our results.It is widely believed that wind speed has weakened in recent decades,the main reasons of which could be global and regional atmospheric circulation and Westerlies change,urbanization,the contrasts of the sea level pressure,near-surface temperature between the Asian continent and the Pacific Ocean,vegetation changes,wind instrument renewal and station shifting (Jiang et al.2010;Yin et al.2010;Fu et al.2011;Yang et al.2012;Wang et al.2017).
By contrast,sunshine duration or solar radiation was identified as the most dominant variable influencing ET0in the Yellow River Basin (Liu et al.2004a;Zhang et al.2015),Yangtze River Basin(Xu et al.2006;Wang et al.2007),West Liao River Basin (Gao et al.2017),upper and lower reaches of the Yellow River (Liu and Zeng,2004),Southwest China (Fan et al.2016),Yunnan Province (Fan and Thomas,2013),and central Sichuan(Feng et al.2014).In particular,Feng et al.(2017)and Zhao et al.(2018) concluded that the combined effects of the significant decrease in sunshine duration and wind speed dominated the changes in ET0in Southwest China,which offset the effect of air temperature and humidity.Increasing aerosols and air pollution,released by intense human activities and rapid urbanization in recent decades,played a potential role in the decrease of sunshine duration (Zhang et al.2011;She et al.2017;Wang et al.2017).In our study area,a significant decreasing trend of sunshine duration was observed,which was in agreement with the findings of Fan et al.(2016) and Wang et al.(2017),who reported that the decrease in sunshine duration contributed to the decreasing ET0in the subtropical monsoon zone of China.
As a comparison,Table 6 summarizes the variation trends of ET0or pan evaporation in China according to previous studies.In this study,the average change in ET0in Guilin for the period of 1951-2015 was -8.02 mm 10a-1,very close to the average declining ET0rate of -8.56 mm/10a from eight climate regions across China from 1961 to 2008 as found by Yin et al.(2010).Moreover,Wang et al.(2017) demonstrated that a significant decreasing trend was experienced throughout China with a slope of -6.84 mm/10a,lower than in the present study.However,the declining ET0trend for Guilin was greater than the global decreasing ET0rate of -1.31 mm 10a-1from 26 regions as reviewed by McVicar et al.(2012).The possible reason may be that the study regions included different regions with various climatic and topographical characteristics.According toTable 6,we found that the decreasing trend of ET0in Guilin during 1951-2015 was slightly higher than that of China reported by Liu et al.(2012) and Wang et al.(2017),but much higher than the results of Liu et al.(2004b) and Fan et al.(2016).Regionally,the rate of decrease in ET0in Guilin was lower than the regions of Yellow River Basin(Zhang et al.2015),Yangtze River Basin (Xu et al.2006),Loess Plateau (Zhao et al.2014),Tibetan Plateau (Wang et al.2014),Qinghai-Tibetan Plateau (Zhang et al.2018b) and Northwest China(Huo et al.2013).These regions are mainly distributed in the northwest arid region and Tibetan Plateau alpine region,and decreasing wind speed and RH were considered to be the primary factors contributing to the decreased ET0in arid and semiarid regions (Yin et al.2010;Zhang et al.2011).However,the decreased trend of ET0in Guilin was higher than that of Yunnan Province (Fan and Thomas,2013),Guizhou Province (Gao et al.2016) and Southwest China (Sun et al.2016;Zhao et al.2018).These regions are mainly distributed in southwestern areas of China,characterized by similar climatic conditions and mountainous land features.The decreased sunshine duration was regarded as the key factor to control ET0changes in such subtropical and tropical humid regions.Exceptionally,several studies found an increase in ET0in northeastern and northwestern regions of China,including the Heihe River Basin (Du et al.2016),most part of the Wei River Basin (Zuo et al.2012),Songhua River Basin (Wen et al.2014) and upper and middle reaches of the Yellow River Basin (Liu et al.2010).Significant increases in air temperature and decreases in RH were the main causes for the increasing trends of ET0in these regions.In conclusion,these differences in the changing trends of ET0in different regions were likely mainly be attributed to the geographic position,study periods,data sources,estimation method and so forth.
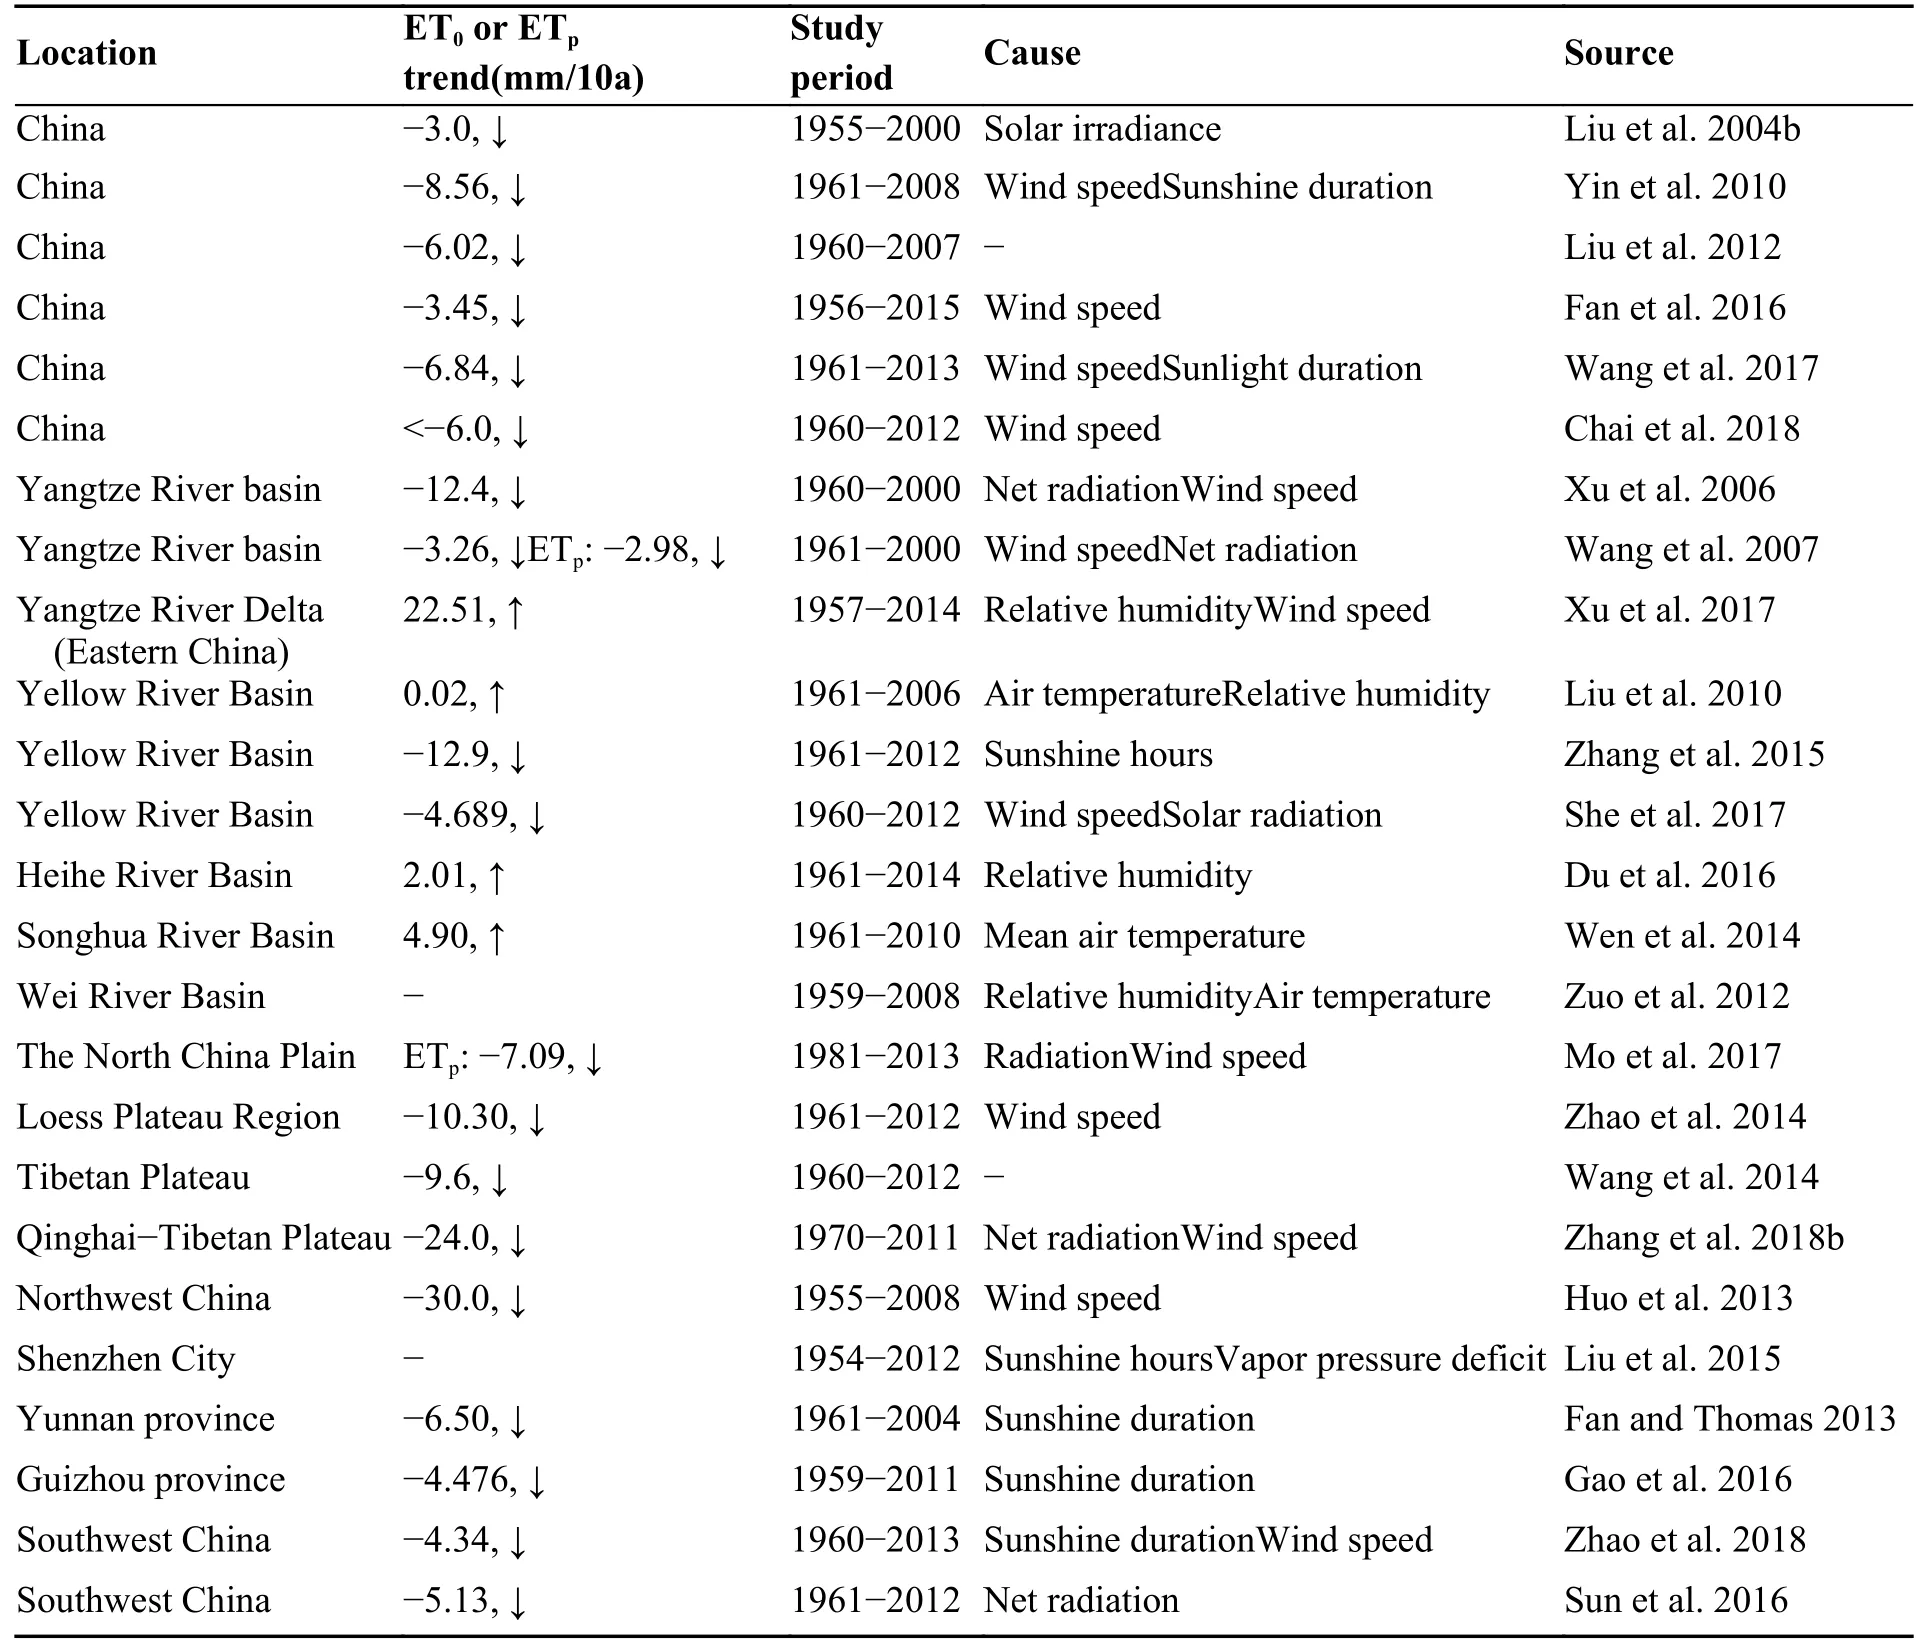
Table 6 Summary of previously estimated ET0 or pan evaporation (ETp) trends in China,and the primary causes of the trend
5 Conclusions
(1) Annual ET0in Guilin displayed a statistically significant decrease trend during 1951-2015,which was consistent with the evapotranspiration trend in Southwest China and the whole China.The significant decrease in summer ET0was the main contributor to the decrease in annual ET0.The sunshine duration and wind speed were the main controlling factors affecting the annual variations of ET0in Guilin.
(2) AI showed an insignificant declining trend of-0.000 5/a,characterized by the increasing trends in spring and autumn and decreasing trends in summer and winter.The changes of precipitation were the dominant factor influencing the variability of AI.
(3) ET0play a minor role in the changes of AI,however,it is an important factor for dryness/wetness variations throughout Southwest China.The drought events in karst areas were essentially not controlled by ET0,but the seasonal variations of ET0had an important implication for the seasonal drought or water shortage,as the limitations of the water and energy supply derived by the intense evaporation.Systematical and quantitative analysis of the relationship between ET0and AI under extreme/high-frequency drought conditions,and its causes are needed in future studies.
Acknowledgements
The study was financially supported by the Fundamental Research Funds for Central Public Welfare Research Institutes,CAGS (SK202208,SK202 209,SK202005,SK202009),and China Geological Survey Project (DD20221752).Special thanks to editors for the detailed and extremely valuable comments and suggestions,which have greatly improved this manuscript.
Highlights:
● The temporal variations of ET0and AI from 1951 to 2015 were analyzed.
● Annual ET0displayed a significant decrease,mainly contributed to the significant decline of summer ET0.
● The decline in ET0was primarily dominated by the sunshine duration.
● AI showed a nonsignificant declining trend of-0.000 5 a-1.
● Precipitation was the dominant factor influencing the variability of AI.
杂志排行

地下水科学与工程(英文版)的其它文章
- Thermodynamic transport mechanism of water freezing-thawing in the vadose zone in the alpine meadow of the Tibet Plateau
- Using time series analysis to assess tidal effect on coastal groundwater level in Southern Laizhou Bay,China
- Determination of total sulfur in geothermal water by inductively coupled plasma-atomic emission spectrometry
- Carbon,nitrogen and phosphorus coupling relationships and their influencing factors in the critical zone of Dongting Lake wetlands,China
- Multivariate analysis and geochemical investigations of groundwater in a semi-arid region,case of superficial aquifer in Ghriss Basin,Northwest Algeria
- Transformation of ammonium nitrogen and response characteristics of nitrifying functional genes in tannery sludge contaminated soil