Thermodynamic transport mechanism of water freezing-thawing in the vadose zone in the alpine meadow of the Tibet Plateau
2022-09-28GangQiaoFengdanYuWenkeWangJunZhangHuaqingChen
Gang Qiao ,Feng-dan Yu ,Wen-ke Wang ,Jun Zhang ,Hua-qing Chen
1 Key Laboratory of Groundwater and Ecology in Arid and Semi-arid, CGS, Xi’an 710054, China.
2 Observation and Research Station of Groundwater and Ecology in Yulin Shaanxi, DNR, Yulin 719053, Shaanxi Province, China.
3 School of Water Conservancy and Environment, Chang’an University, Xi’an 710054, China.
Abstract: High altitude,cold and dry climate,strong solar radiation,and high evapotranspiration intensity have created an extremely fragile ecological and geological environment on the Tibet Plateau.Since the heat in the vadose zone is primarily generated by the external solar radiation energy,and evapotranspiration is contingent on the consumption of vadose heat,the intensity of evapotranspiration is associated with the intensity of solar radiation and the heat budget in the vadose zone.However,the spatial and temporal variation of heat budget and thermodynamic transfer process of the vadose zone in the frigid region are not clear,which hinders the revelation of the dynamic mechanism of evapotranspiration in the vadose zone in the frigid region.With the moisture content of the vadose zone in the alpine regions being the research object,the paper conducts in-situ geothermal observation tests,takes meteorological characteristics into consideration,and adopts the method of geothermal gradient and numerical computation to analyse the temporal and spatial variation rule of heat budget and thermodynamic transmission process of the vadose zone in the high and cold regions.The results show there is a positive correlation between air temperature,ground temperature,and water content of the vadose zone in both thawing and freezing periods.According to the change law of geothermal gradient,the thermodynamic transfer process of the vadose zone has four stages: slow exothermic heating,fast endothermic melting,slow endothermic cooling,and fast exothermic freezing.From the surface down,the moisture freezing rate of the vadose zone is slightly higher than the melting rate.This is of great significance for understanding the evapotranspiration dynamic process of the vadose zone and protecting and rebuilding the ecological and geological environment in the high and cold regions.
Keywords: Freeze-thaw action;Thermodynamic;Evapotranspiration;Moisture in the vadose zone;Tibet plateau.
I ntroduction
Climate change has disrupted the water and heat balance of the Tibet Plateau,a place hailed as the“Water Tower of China”,leading to changes such as an increase in average temperature,a decrease of permafrost active layer thickness,and rising snow line (Peng and Gao,2011;Dong et al.2013;Cheng et al.2008;Mau Rer and Bowling,2014;Wang et al.2013;Zhao et al.2021).Since the heat in the vadose zone mainly comes from the external solar radiation energy,evapotranspiration is contingent on the consumption of vadose heat (Dai et al.2018;Wan et al.2004;Wang et al.2018;Wang et al.2017;Zhou et al.2015).Meanwhile,the heat budget in the vadose zone determines the phase state of water migration and transformation(Li et al.2019).Therefore,the internal relationship between the water phase state and evapotranspiration is a tricky issue in the study of evapotranspiration in cold and arid regions.In recent years,thanks to the exploratory studies on the measurement and technologies of evapotranspiration (Wang et al.2017;Yang et al.2020;Zhong et al.2018;Kadkhodazadeh et al.2022;Hao et al.2016;Ghiat et al.2021),calculation methods and parameters(Chen et al.2019;Lu and Zheng,2018;Qiao et al.2014;Wang et al.2016;Dimitriadou and Nikolakopoulos,2022;Taheri et al.2022),and evapotranspiration laws in different regions (Wang et al.2018;Qiao and Wang,2014;Cao et al.2011;Cui et al.2020;Dinesh et al.2022;Yang et al.2022;Huang et al.2021),major progress has been achieved.For example,Xi et al.(2020) analyzed evapotranspiration in the Manas River Basin.Gao et al.(2020) used an improved dual-source model to simulate evapotranspiration in populus euphratica forests.Wang et al.(2018) observed evapotranspiration of riverside wetland in a cold area with a vorticity covariance instrument,which is the most accurate observation method of actual evapotranspiration at present.Zhang et al.(2018)used data from multiple sources to simulate daily evapotranspiration in the Heihe River Basin.Some scholars believe that the shallow depth of the constant temperature zone in the distribution area of geothermal resources on the Qinghai-Tibet Plateau is conducive to the transformation of solid water into liquid water in the vadose zone (Wang et al.2017;Wang et al.2021).However,very few evapotranspiration studies are based on the thermodynamic process of water freezing-thawing in the vadose zone.
Biomass per unit area,an important indicator of ecological environment quality,is closely related to liquid water content in the vadose zone.In this paper,only water in the vadose zone with a buried depth of less than 0.6 m in the alpine meadow area is taken as the research object.Through the in-situ tests of ground temperature and water observation in the vadose zone,combined with the meteorological characteristics,geothermal gradient,and numerical calculation method,the temporal and spatial variation of heat budget and thermodynamic transfer process of the vadose zone in the alpine region are studied.Based on the observed data,the migration process of the water freezing-thawing front in the vadose zone with time is analyzed,and then the thermodynamic mechanism of water freezing-thawing in the vadose zone is revealed.It is of great significance to understand the dynamic process of evapotranspiration and to protect and rebuild the ecological geological environment in the cold region.
1 Materials and methods
As is shown in the geographical location map in Fig.1,the research area is in Guoluo Prefecture of Qinghai Province on the Tibet Plateau,near the source of the Yellow River.It belongs to the alpine humid shrub canyon area at an altitude of 4 300 m,with the cutting depth of the gully reaching 150 m and the thickness of the vadose zone being 0.2-0.6 m.The upper part of the vadose zone is grass blanket cold frozen rugose soil,and the lower part is silt sand and sand gravel weathering crust.The zonal vegetation is kobresia and shrub alpine meadow,and the root system can be found in the shallow area of 0.15 m.The region is marked by a cold climate,developed permafrost,scarce soil and nutrients,and an extremely fragile ecological and geological environment.
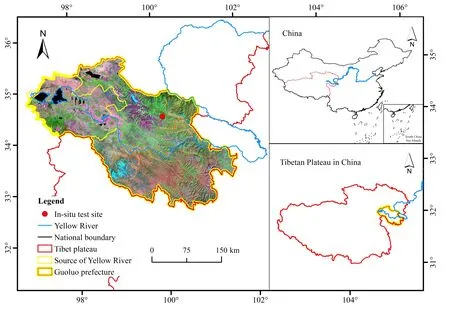
Fig.1 The geographical location map
1.1 Observation indicators
To have a more comprehensive understanding of the water freezing-thawing process in the vadose zone under the influence of external geographical and meteorological environment,this paper selected the native alpine meadow with flat terrain and thick soil layer for in-situ observation experiments.The meteorological elements observed include temperature,air humidity,net radiation,wind speed,wind direction,precipitation,and so on.The observed water and heat parameters include ground temperature and water content at 0.1 m,0.2 m,0.3 m,0.45 m,and 0.6 m of the vadose section.All parameters were observed synchronously at an interval of 30 minutes.The lithology of the vadose zone and installation position of probes are shown in Fig.2.
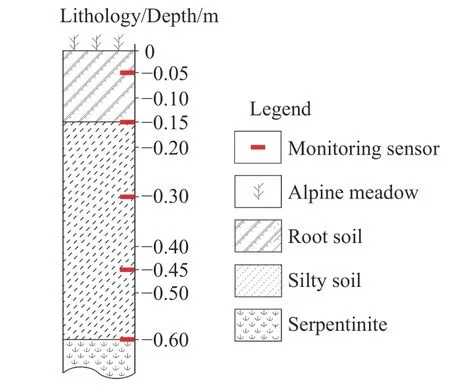
Fig.2 Lithology of vadose zone and probe location
1.2 Data processing
Excel 2021 and SPSS 20.0 were used to analyze the soil temperature variability of different soil layers.This paper took monthly average data spaced 30 minutes for analysis to find the changing patterns.To analyze the temporal and spatial distribution characteristics of ground temperature and water content of the vadose section more accurately,the observed data were divided 0.02 m apart to obtain the water content of each section node.
2 Results
Water freezing-thawing action in the vadose zone is affected by the changes in air temperature,ground temperature,and precipitation.Therefore,this paper uses these three indicators to analyze the mechanism of water freezing-thawing action in the vadose zone.
2.1 Characteristics of average temperature and precipitation
The average annual temperature of the test site is only -0.96°C,with the highest temperature recorded in August at 6.3°C and the lowest in January at -11.7°C.The annual precipitation of the test site is 643.5 mm,higher than the annual average of 465 mm,and the precipitation is most abundant from April to October,with a total of 586 mm.Among them,the period between May and September sees the most rainfall in the form of liquid water and the period from October to the next April has the heaviest snowfall of 49 mm in total.The precipitation varies greatly between June and September,with rainfall being 145 mm and 119 mm respectively,as shown in Fig.3.
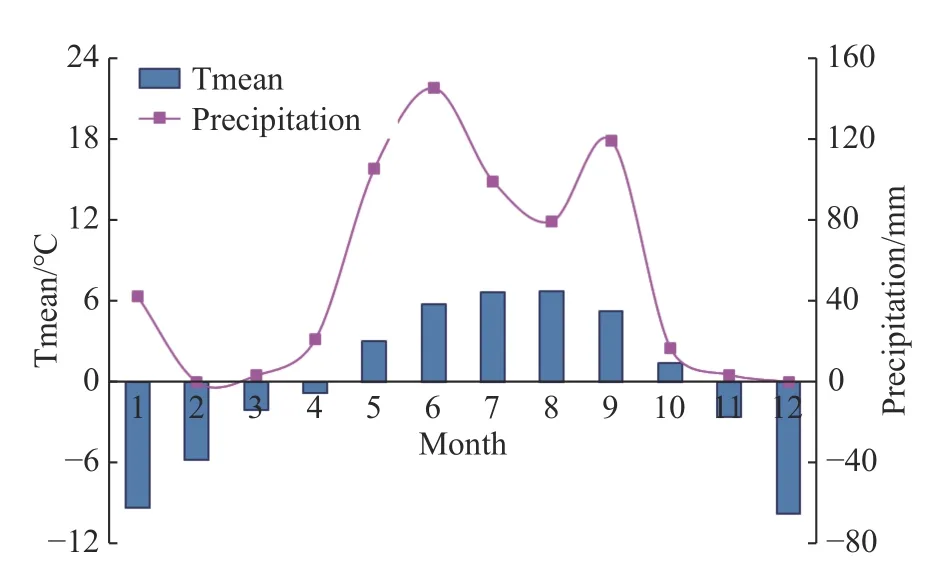
Fig.3 Curve of mean air temperature and precipitation at the test site
2.2 Geothermal characteristics
The ground temperature curve Fig.4 of the vadose zone in the test site shows that April and November are the critical time for positive and negative changes in ground temperature at the soilair interface.The near-surface temperature from April to October is greater than 0°C.January and June are critical time for positive and negative transition of ground temperature at 0.6 m of the vadose zone,and the ground temperature from June to December is greater than 0°C.Heat transfers from the surface down to the 0.6-meterthick vadose zone,with a time lag of 2 months.
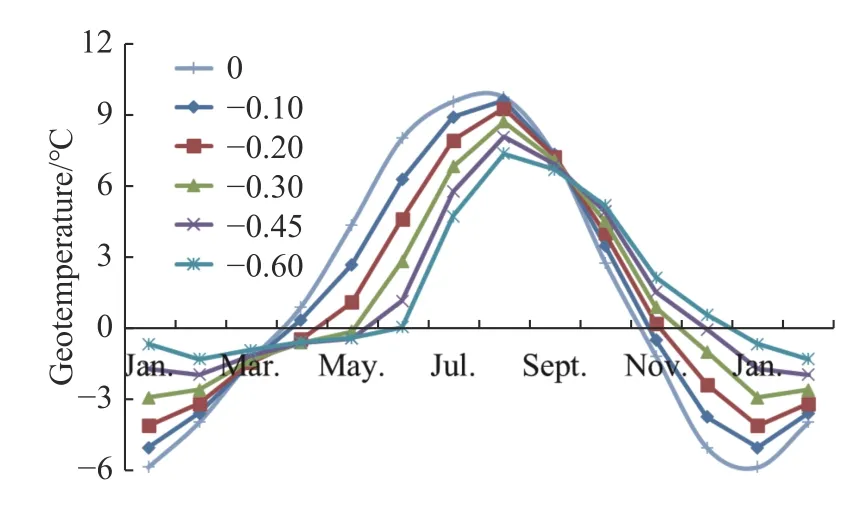
Fig.4 Temperature curve of vadose zone at the test site
The highest ground temperature at 0.6 m near the surface and the lower boundary appear in August,10.2°C and 7.5°C respectively,while the lowest ground temperature appears in January,-6.1°C and -0.58°C respectively.The pattern is consistent with that of the air temperature.
3 Discussion
3.1 Thermodynamic transmission process and driving force
According to the second law of thermodynamics,the heat transfer mode in the vadose zone media is mainly heat conduction driven by temperature gradient.Therefore,this paper divides the thermodynamic transfer process in the vadose zone into four stages by analyzing the space-time characteristics of the geothermal gradient and taking into consideration the meteorological and environmental conditions.
(1) Slow heat release and storage stage (January-March)
In January,despite being at the lowest point of the year,air temperature and ground temperature begin to rise.Although geothermal still stays below 0°C and the vadose water is in solid form,the absolute value of the geothermal gradient starts to decrease and the heat release rate declines.The geothermal gradient is the lowest in March,i.e.the heat release rate of the vadose zone reaching the minimum,as shown in Fig.5.At the same time,the vadose zone is mainly exothermic,lacking the heat required for evapotranspiration.The evapotranspiration effect is extremely weak.
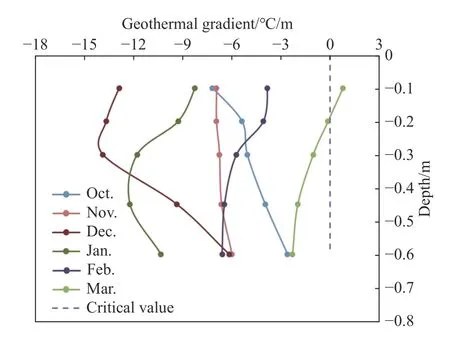
Fig.5 Diagram of Geothermal gradient during the exothermic period (below 0°C/m)
(2) Rapid endothermic melting stage (April-June)
In April,with the further increase in ground temperature,the near-surface ground temperature goes from below 0°C to above 0°C,and the vadose zone turns from slow heat release to rapid heat absorption.In addition,heat is gradually transferred from the surface downward to form the water melting front of the vadose zone.In June,the melting front moves to 0.6 m of the lower boundary of the vadose zone,and the transformation of solid water to liquid water is completed.At this point,the geothermal gradient reaches the maximum,that is,the heat absorption rate of the vadose zone reaches the maximum,as shown in Fig.6.At the same time,the vadose zone absorbs enough heat for evapotranspiration.With the increase of the geothermal gradient,evapotranspiration tends to increase.
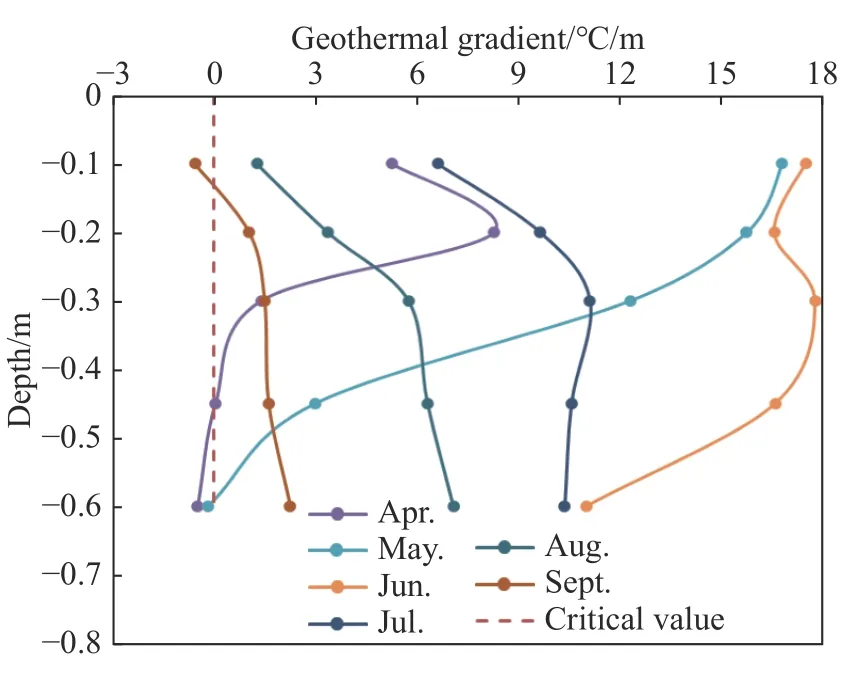
Fig.6 Diagram of geothermal gradient during the endothermic period (above 0°C/m)
(3) Slow endothermic cooling stage (July-September)
In July,the geothermal gradient begins to decrease gradually,and the heat absorption rate of the vadose zone goes down,but as the zone continues to absorb heat,the temperature keeps rising until the ground temperature peaks in August.After September,the geothermal gradient declines gradually and the rate of vadose heat absorption hits the bottom,as shown in Fig.5.The water in the vadose zone mainly exists in liquid form.The vadose zone can absorb heat to provide energy for evapotranspiration.With the decrease of the geothermal gradient,evapotranspiration tends to decrease.
(4) Rapid exothermic freezing stage (October-December)
In October,the vadose zone turns from gradual heat absorption into a quick release heat,with a decreasing ground temperature.In November,nearsurface geothermal falls to below 0°C,transferring heat down from the surface,releasing heat and forming the vadose water freezing front.In December,the frozen frontal gas moves to 0.6 m on the border,At this point,the absolute value of the geothermal gradient,i.e.the rate of heat release from the zone,reaches the maximum,as shown in Fig.4.At the same time,the vadose zone is mainly exothermic,devoid of the energy required by evapotranspiration.Evapotranspiration is extremely weak.
With a further decrease of ground temperature to the lowest point in January of the next year,the water thermodynamic transfer process of the vadose zone enters the first stage of slow heat release and heat storage again,thus completing a full thermodynamic process of water freezingthawing in the vadose zone.
To sum up,the transition period of heat absorption and release from vadose zone is April and October each year respectively,while the extreme period of heat absorption and release from the vadose zone is June and December respectively.
3.2 Thermodynamic transfer mechanism of water freezing-thawing in the vadose zone
The water melting stage of the vadose zone lasts from April to June,while the freezing stage is from October to December.Then,what are the spatial and temporal distribution characteristics of front migration during water thawing and freezing in the vadose zone? The following is to reveal the thermodynamic transfer mechanism of water freezing and thawing in the vadose zone by analyzing the thermodynamic process of water thawing and freezing and using the external meteorological driving factors for in-depth analysis.
A numerical calculation method is used to calculate the ground temperature and water content of the vadose zone during the thawing and freezing period.To accurately identify the spatial and temporal distribution characteristics of ground temperature and water content,the observed data of the profile were divided at an interval of 0.02 m to obtain the data of each section node,as shown in Fig.7 to Fig.10.
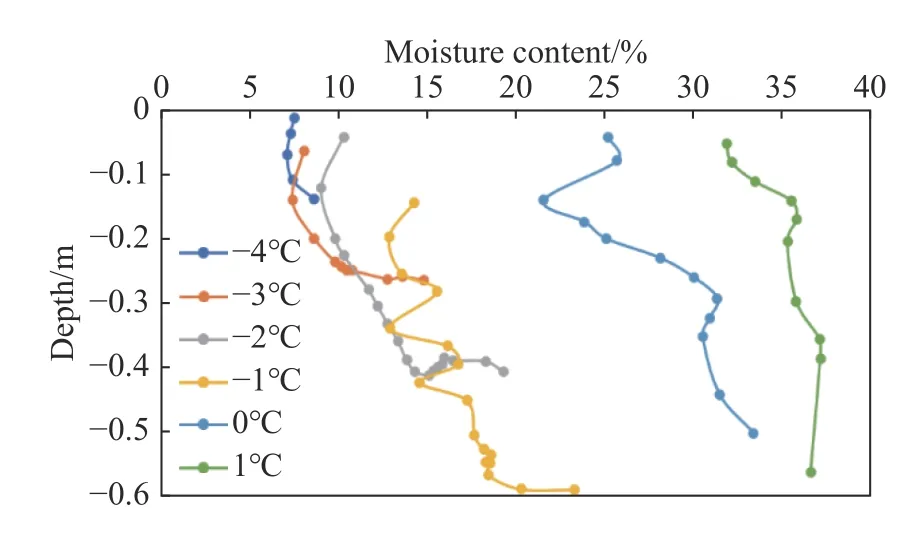
Fig.7 Spatial distribution curve of ground temperature and water content in the thawing period
The spatial distribution curves of ground temperature and water content of the vadose zone during the water melting period are shown in Fig.7,which illustrates the water content of the vadose zone at different buried depths.The moisture content is 7%-18% when the ground temperature is below 0°C,and 32%-37% when it is greater than 0°C.The water content of the Vadose zones with a ground temperature lower than 0°C have less moisture content than those higher than 0°C.The water content of the vadose zone at 0°C ranges from 20%-32% at different buried depths.
In Fig.8,the spatial distribution curves of ground temperature and water content of the vadose zone during the freezing period,shows that the water content under different burial depths ranges from 7% to 27% and that of the vadose zone over 0°C is from 32% to 37%.Vadose zones under 0°C have less water content than those of vadose zones over 0°C,and that of the vadose zone under different burial depths is 28%-32%.
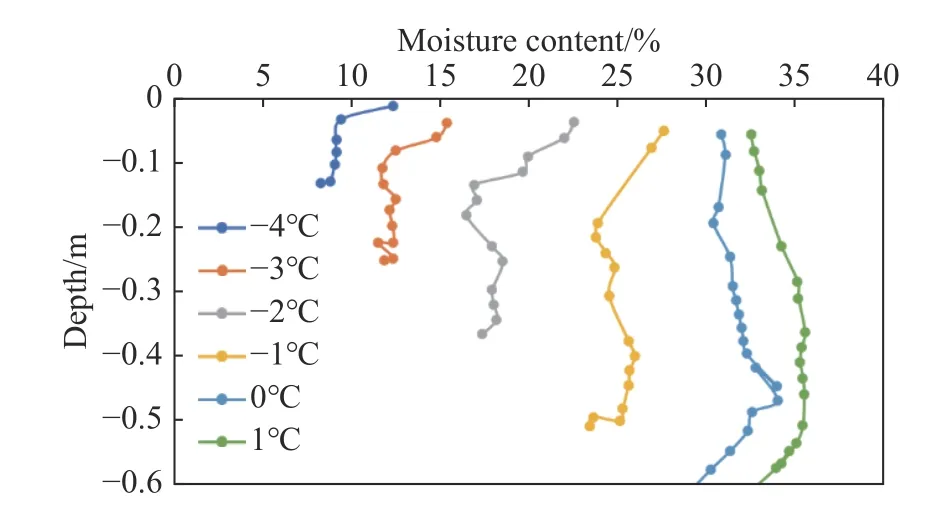
Fig.8 Spatial distribution curve of ground temperature and water content in the freezing period
Therefore,in both thawing and freezing periods,the variation of water content in the vadose zone is positively correlated with ground temperature.The range of water content in the vadose zone with different burial depths below 0°C is 7%-28%.
3.3 Migration rule of the frozen-thawing front with moisture in the vadose zone
From April to June,the melting period of water in the vadose zone is marked by the rise of ground temperature from below 0°C to above 0°C,which is the critical temperature value in melting.October to December is the freezing period,and the sign of water freezing is the ground temperature dropping from above 0°C to below 0°C.Similarly,0°C is also the critical temperature value of freezing.The migration curves of thawing and freezing fronts are shown in Fig.9 and Fig.10.It can be seen from the figure that the migration positions of water thawing and freezing fronts in the vadose zone are linearly distributed with time,and the time required for water thawing in the vadose zone is slightly longer than the freezing time.
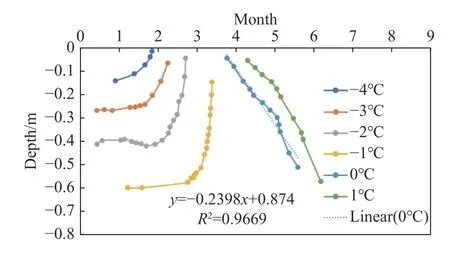
Fig.9 Migration curve of moisture thawing front in the vadose zone
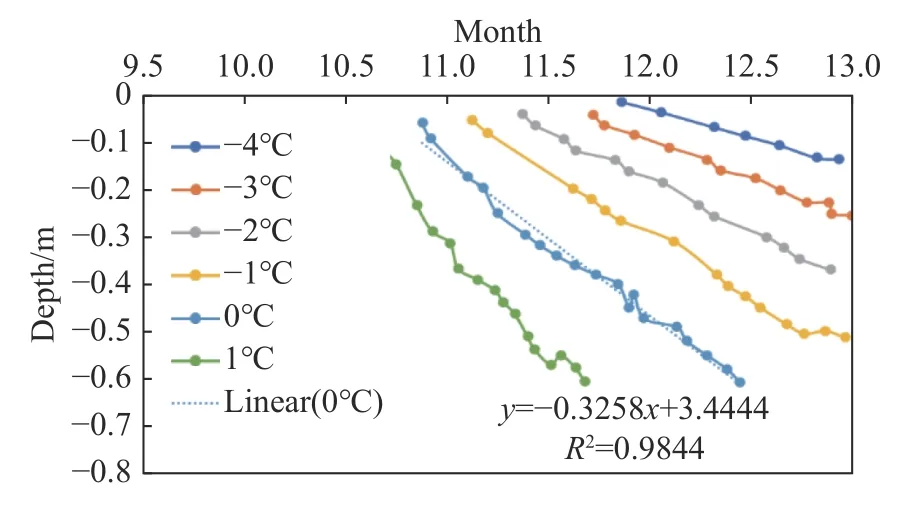
Fig.10 Migration curve of moisture freezing front in the vadose zone
(1) Migration equation of water melting front in the vadose zone
Water melting front migration equation of vadose zone:


The water in the vadose zone begins to melt from the surface down in early April,and the melting front migrates to 0.6 m at the lower boundary of the vadose zone at the end of May,as shown in Fig.9.The duration was 45-60 days,and the average melting rate was 10 mm/d.
(2) Migration equation of frozen front in the vadose zone
Expression of moisture frozen front migration equation in the vadose zone:

At the end of October,water in the vadose zone begins to freeze downward from the surface.In mid-December,the frozen front migrates to 0.6 m of the lower boundary,lasting 30-45 days with an average freezing rate of 15 mm/d,as shown in Fig.10.
(3) Migration equation of water freeze-thaw front in the vadose zone
By combining the equation of water melting and freezing fronts in the vadose zone,the paper obtains the expression of water freezing-thawing front migration in the vadose zone:

Where:y1is the equation of the water melting front in the vadose zone,whiley2is the equation of the water freezing front.x1andx2are decimal months,with the range being the freezing-thawing time of water.y1andy2are buried depths,with the range being the freezing-thawing depth of the test site.The unit is meters.
3.4 Hydrothermal evolution trend of vadose zone under climate change
This study shows that air temperature is positively correlated with water content and geothermal temperature in the vadose zone.Therefore,it can be predicted that water content and geothermal temperature in the vadose zone will increase correspondingly in the future based on the upward trend of annual average temperature from 1959 to 2020.The rising geothermal temperature is conducive to the transformation of solid water into liquid water in the vadose zone.The curve of annual potential evapotranspiration and the average temperature are shown in Fig.11.In order to prevent the heat loss in the alpine meadow and the dispersion loss of liquid water required for the growth of the meadow,it is suggested that the artificial reforestation meadow should be covered with plastic films to preserve heat and conserve water.
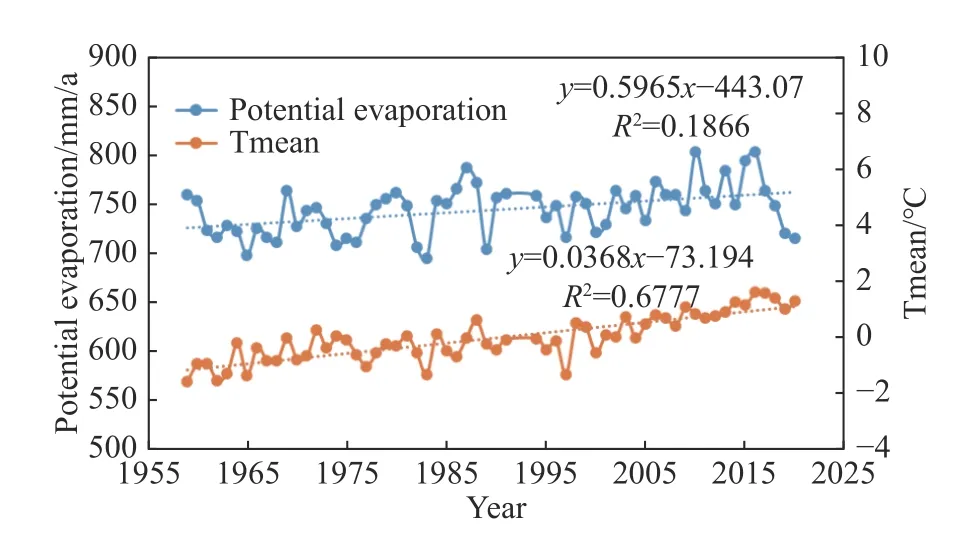
Fig.11 Curves of annual potential evapotranspiration and average temperature
4 Conclusions
This paper draws the following conclusions through research:
(1) April and November are the critical time for the positive and negative transition of ground temperature at the soil-atmosphere interface,while January and June are the critical time for the positive and negative transition of ground temperature at the depth of 0.6 m in the vadose zone.The temperature is positively correlated with the ground temperature.
(2) The thermodynamic transport process of the vadose zone has four stages: Slow exothermic heat storage,rapid endothermic melting,slow endothermic cooling,and rapid exothermic freezing according to the variation rule of the geothermal gradient in a complete hydrological year.There is a positive correlation between the ground temperature and water content of the vadose zone in both thawing and freezing periods.
(3) From the surface down,the water melting time of the vadose zone is from early April to the end of June with a melting rate of 10 mm/d,while the freezing time is from the beginning of October to mid-December,with a freezing rate of 15 mm/d.The freezing rate is slightly higher than the melting rate.
(4) Based on the positive correlation between average air temperature,water content,and ground temperature of the vadose zone,it can be predicted that,as air temperature increases,the water content,ground temperature,and potential evapotranspiration intensity will rise.Therefore,the artificial reforestation meadow should be covered with films for heat preservation and water conservation.
Acknowledgements
This work was supported by the National Natural Science Foundation of China (41877199),the Key Research and Development Program of Shaanxi Province (2021ZDLSF05-01),the Key Scientific and Technological Innovation Team of Groundwater Hydrological Process and Supergene Ecology in Arid Regions of Shaanxi Province (2019TD-040),the Key Research and Development Program of Shaanxi (2022SF-327),the Science and Technology Program of Inner Mongolia Autonomous Region (2021GG0198),and the Project of China Geological Survey (1212011220224,DD20221751,DD20211393,DD20190504).
杂志排行
地下水科学与工程(英文版)的其它文章
- Evaluation of groundwater resource potential by using water balance model: A case of Upper Gilgel Gibe Watershed,Ethiopia
- Transformation of ammonium nitrogen and response characteristics of nitrifying functional genes in tannery sludge contaminated soil
- Multivariate analysis and geochemical investigations of groundwater in a semi-arid region,case of superficial aquifer in Ghriss Basin,Northwest Algeria
- Carbon,nitrogen and phosphorus coupling relationships and their influencing factors in the critical zone of Dongting Lake wetlands,China
- Temporal variations of reference evapotranspiration and controlling factors: Implications for climatic drought in karst areas
- Determination of total sulfur in geothermal water by inductively coupled plasma-atomic emission spectrometry
