In situ study of calcite-III dimorphism using dynamic diamond anvil cell
2022-09-24XiaZhao赵霞ShengHuaMei梅升华ZhiZheng郑直YueGao高悦JiangZhiChen陈姜智YueGaoLiu刘月高JianGuoSun孙建国YanLi李艳andJianHuiSun孙建辉
Xia Zhao(赵霞) Sheng-Hua Mei(梅升华) Zhi Zheng(郑直) Yue Gao(高悦) Jiang-Zhi Chen(陈姜智)Yue-Gao Liu(刘月高) Jian-Guo Sun(孙建国) Yan Li(李艳) and Jian-Hui Sun(孙建辉)
1CAS Key Laboratory for Experimental Study under Deep-sea Extreme Conditions,Institute of Deep-sea Science and Engineering,Chinese Academy of Sciences(CAS),Sanya 572000,China
2University of Chinese Academy of Sciences,Beijing 100049,China
3Department of Mechanical Engineering,National University of Singapore(NUS),Singapore 117575,Singapore
Keywords: calcite-III,dimorphism,dynamic diamond anvil cell,in situ Raman spectroscopy,pressurizing rate
1. Introduction
As the main carbon carriers, carbonate minerals control the migration of carbon in different geochemical reservoirs.[1-4]Calcite (CaCO3), the most common carbonate mineral, has over 12 proven structural polymorphs, such as calcite-I-calcite-VII(cc-I-cc-VII),aragonite,and pyroxene CaCO3.[2,5-12]Although it is accepted that calcite reacts with enstatite in the upper mantle to form dolomite,[13]the diamond inclusions and ancient subduction zone rocks suggest that calcite could exist at the top of the lower mantle.[14-16]Under the mantle pressure and temperature condition, calcite must undergo a substantial phase transition to adapt the changes in pressure and temperature with the depth.[2,5,6,11,17,18]Owing to its pressure sensitivity,structural phase transitions in calcite may also be used as geobarometers.[19]Thus,phase transition in calcite is of great importance in understanding the structure and dynamics of the Earth.
The pressure-induced phase transition of cc-III dimorphism at room temperature has been extensively studied.[2,20-24]Despite a long history of investigation, the transition process among the dimorphisms of calcite,cc-III in triclinic and cc-IIIb in pseudomonoclinic triclinic structure,remains unclear. On the one hand, some researchers claimed that the cc-III and cc-IIIb can coexist in the same pressure range. For example, Liu and Mernagh identified the coexistence of cc-III and cc-IIIb at a pressure of 5.2 GPa, based on the observation of different cell parameters and Raman vibrational modes.[20]The coexistence was later confirmed by Merliniet al. but at a lower pressure of 3 GPa in polycrystalline samples.[21]Yuanet al. further determined the coexisting pressure range to be 1.97 GPa-3.38 GPa.[25]On the other hand,several researchers observed that each phase exists separately in different pressure ranges. For example,Pippingeret al. found that the pressure ranges for the existence of cc-IIIb and cc-III are 2.14 GPa-3.14 GPa and 3.42 GPa-5.42 GPa,respectively,at a temperature of 298 K,and the pressure ranges change to 2.2 GPa-3.71 GPa and 3.84 GPa-4.45 GPa,respectively,at a temperature of 283 K.[22]In both cases,the cc-IIIb and cc-III do not coexist. Furthermore, there are also studies suggesting that cc-IIIb may appear or disappear repeatedly with the increase of pressure,which complicates the issue even more. Koch-Muelleret al. found experimentally that the cc-IIIb first appears at 2.2 GPa, then disappears at~3 GPa due to the transition to cc-III,and finally reappears at~5 GPa.[24]The first-principle simulation also indicated that the transition between cc-IIIb and cc-III can oscillate as pressure increases from cc-IIIb to cc-III at 4.3 GPa and then from cc-III to cc-IIIb at 14.9 GPa.[23]These findings are summarized in Fig.1.In order to clarify the coexistence of cc-III and cc-IIIb, it is necessary to conduct further research.
In addition,the Earth’s interior is persistently in the process of dynamic evolution, including seafloor spreading and plate subduction.[26-29]Some geological zones,such as those around fault zones during earthquakes or adjacent areas during volcanic eruptions, may be squeezed at a high pressurizing rate. Accordingly, the physical and chemical properties of the constituent minerals including calcite in the relevant Earth interior should be affected by these dynamic processes. For example, different carbonates (dolomite, aragonite,calcite,magnesite)were found in different high-pressure(HP) metamorphic rocks (metapelite, marble, eclogite) from the Western Tianshan subduction zone.[30]Rapid magma ascents contacted calcite inclusions within quartz phenocrysts at Santa Rita, New Mexico (USA).[31]However, up to now,the studies aiming at exploring the physical and chemical processes in the Earth’s interior,whether mineral physics or mineral chemistry,were mainly carried out under static conditions,and the dynamic research is almost blank. Undoubtedly, it is of great scientific significance to carry out dynamic research of the high-pressure phase transition of calcite under the conditions of temperature and pressure simulating mineral occurrence environment in geological processes.

Fig.1. Summary of previous results of coexistence of cc-III and cc-IIIb at room temperature. Merlini et al. (2012) found that both cc-III and cc-IIIb can be stable in a pressure range of 2.5 GPa-15 GPa.[2] Later(2014), they observed the coexistence of these two phases at a pressure of ~3 GPa.[21]
The spectral analysis provides useful information about the phase transitions in solids. Specifically, Raman scattering occurs when monochromatic light interacts with molecular vibrations inside a crystal. With the spectrum being able to record any change in bonding structure, Raman spectroscopy is used extensively in the study of phase transition in calcite.[5,7,20,32-40]The isolated carbonate ion[CO3]2-has four distinct vibration bands: symmetric stretching mode(ν1),out-of-plane bending mode(ν2),asymmetric stretching mode(ν3),and in-plane bending mode(ν4).Carbonate minerals also have two lattice vibration bands reflecting the lattice vibration(translation and oscillation) between Ca2+and [CO3]2-.[41]The Raman spectra of rhombohedral cc-I are characterized by five Raman-active peaks located at 156, 282, 712 (=ν4),1085 (=ν1), and 1434 cm-1(=ν3), respectively.[37]Owing to the high sensitivity in pressure, the change ofν4mode often receives special attention in the spectral analysis of phase changes in calcite. In calcite,the cc-I and cc-II have different crystal structures: the former is rhombohedral (R3c) and the latter is monoclinic(P21/m). The transition from cc-I to cc-II is achieved by shifting Ca2+cations and rotating the[CO3]2-group~11°.[25,42]Correspondingly, theν4mode in the Raman spectrum will split from one peak for cc-I into two peaks for cc-II. The structure of cc-III is less symmetrical than that of cc-II.The change from cc-II to cc-III results from the breaking of the triclinic(P)symmetry within the thermodynamically stable field of cc-III.[2]This change reflected in the Raman spectra is that theν4mode changes from two to more than five peaks, which has been confirmed by Pippingeret al.[22]and Yuanet al.[25]
Diamond anvil cell (DAC) has been used extensively in high-pressure studies due to its capability of being incorporated with spectrum analysis techniques, and the understanding of the calcite phase has been greatly improved with the DAC technique.[6-10,43]However, the observation of detailed structure change is a challenge to the conventional DAC technique.In the conventional DAC,the increase of pressure in the experiment can only be achieved step-by-step mechanically.Because of a large pressure interval produced by discontinuous pressurizing,some transient processes,such as the coexistence of phases,could be easily overlooked. Dynamic loading DAC(dDAC)was developed from the conventional DAC.At a designated rate,it can provide continuous pressurizing. Several dDAC studies[44-48]on mineral phases(including Raman studies on carbon tetrachloride and ice, and x-ray diffraction studies on KCl and zirconium)have demonstrated the prospect of this new technology.
In this study, using the dDAC combined with Raman spectral analysis,we realizein situmonitoring of calcite phase transition upon pressure increasing. Our results confirm the coexistence of cc-III and cc-IIIb,and the pressure range of the coexistence depends on the pressurizing rate. More importantly, our discovery reveals that kinetics plays a key role in controlling the transition, which may provide an insight into the structural transition in calcite.
2. Materials and methods
2.1. Sample composition
All samples for DAC experiments in this study were from the same natural calcite crystal(see Fig.S1). The crystal was colorless and transparent, about 3 cm in diameter. Scanning electron microscopy (SEM) image and x-ray energy dispersive spectrum (EDS) of the crystal were taken on a Phenom ProX microscope (see Fig. S2). The EDS results confirmed the high purity of CaCO3crystal containing only three major elements: calcium,carbon,and oxygen.
2.2. Experimental procedure
High-pressure experiments of the single-crystal calcite were performed at the CAS Key Laboratory for Experimental Study under Deep-sea Extreme Conditions,Institute of Deepsea Science and Engineering, Chinese Academy of Sciences(Sanya, Hainan, China). Experiments were carried out on our dDAC system,which combines piezoelectric actuators and conventional DAC. Conventional DAC was located between pillars and pressure screws(see Fig.S3). The sample assembly was the same as that in a conventional DAC,equipped with two type-IIA low-fluorescence diamonds with 300-µm culets.The sample chamber was a hole of~100µm in diameter,produced by a Drilex-2000 laser punch,located in the center of a stainless-steel gasket of 100µm in thickness. Water was used as a pressure-transmitting medium. In the process of sample assembly,a ruby particle was enclosed with the sample in the sample chamber as a pressure indicator,and the pressure was measured byin situruby fluorescence.[49]
The dDAC device provides controllable loading functions. By setting the target pressure and loading path (i.e.,the times for loading-stay-unloading)in advance through the signal generator, selected loading modes including the designated loading rate could be obtained. The correctness of the input signal was ensured by an oscilloscope(see Fig.S4).
Combined with spectral analysis technology, our highpressure test system has the capability ofin situobservation. The Raman and fluorescence spectra of calcite and ruby were simultaneously collected by a charge coupled device(CCD) detector and an intensified CCD (ICCD) detector, respectively. The Raman spectra from 100 cm-1to 930 cm-1were recorded by an Andor Shamrock SR500i spectrometer equipped with a Leica DM2700 microscope, and a Plan Apo SL Infinity Corrected 20×objective with a numerical aperture value of 0.28. The excitation laser was a 532-nm frequencydoubled Nd:YAG laser. A 1800-gr·mm-1holographic grating coupled with a CCD detector(2000×256 pixels per inch,1 inch=2.54 cm) with a spectral resolution of 1.5 cm-1was used for the Raman spectrum measurement. Raman spectra of calcite at room temperature and atmospheric pressure were recorded to ensure a good instrument condition, and three standard Raman-active peaks were located at 156, 282, and 712 cm-1(=ν4), respectively. A 600-gr·mm-1holographic grating coupled with an ICCD detector(1024×1024 pixels per inch)was used to measure the ruby fluorescence spectra. The exposure time for fluorescence and Raman spectra were about 1 s and 4 s, respectively. The time-resolved Raman spectrogram in the dynamic loading process is shown in Fig.2.

Fig.2. Typical time-resolved Raman spectra for calcite investigated in dynamic loading process.
2.3. Ab initio simulation using density functional theory
To corroborate the experimental Raman spectra,we used Materials Studio to calculate the Raman peaks of cc-III and cc-IIIb. The basic setup was similar to that in Bayarjargalet al.[39]with an 880-eV plane-wave cut-off and Monkhorst-Pack grids[50]of 1×1×1 grid parameters. We also used the same criterion of self-consistency as that in Bayarjargalet al.,[39]and the maximum displacement is 0.005 ˚A.
3. Results and discussion
3.1. Experimental conditions
Eight experiments from five samples (C1, C2, C3, C4,and C5) are performed with dDAC. Experiments are carried out at high pressures and different pressurizing rates. The detailed information for all runs is summarized in Table 1.

Table 1. Pressure and loading rate settings for experiments.
3.2. Raman spectrum analyses
Previous studies revealed that in calcite, the phase transition leads the characteristic modeν4to split(e.g.,from one peak for cc-I to two peaks for cc-II, to more than five peaks for cc-III); the feature is therefore used to identify the phase state in calcite. While there is consensus on the feature ofν4mode of cc-I,cc-II,and cc-III,the feature ofν4for cc-IIIb remains uncertain. In this case, we try to find clues throughabinitiosimulation to reveal the relationship between the bonding structure and the feature of their characteristic modeν4for both cc-III and cc-IIIb.
We perform first-principle simulations based on DFT for the characteristicν4mode of CaCO3at a spectra resolution of 4 cm-1separately at a pressure of 2.2 GPa and 7 GPa. As presented in Fig. 3, cc-III shows seven peaks at 2.2 GPa and eight peaks at 7 GPa,while cc-IIIb exhibits three peaks at both pressures. Therefore, we use the features ofν4mode: three peaks for cc-IIIb and more than seven for cc-III, as the criterion to identify cc-IIIb and cc-III in our analysis. The simulation results are in good agreement with previous observations.For example, Yuanet al. observed that theν4mode in calcite shows 3 sharp peaks in cc-IIIb,and splits into 5 peaks in cc-III.[25]Similarly, Pippingeret al. found that theν4mode in calcite changes from 4 to 7 peaks in the process of phase transition from cc-IIIb into cc-III.[22]
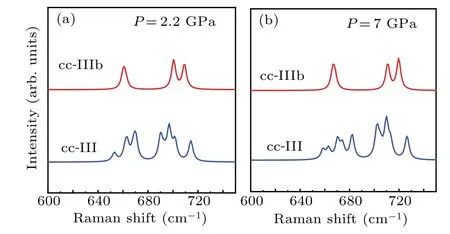
Fig.3. Curves of characteristic ν4 mode of calcite,by first-principle simulation,for cc-III and cc-IIIb at P=2.2 GPa(a)and 7 GPa(b).
3.3. Transition from cc-I to cc-II and from cc-II to cc-III
Although this study focuses on the dimorphism of cc-III,the transition from cc-I to cc-II and from cc-II to cc-III,which are essential steps for the introduction of cc-III,need to be analyzed systematically.
Figure 4 shows the Raman spectra recorded from run DD0012, indicating the transition of calcite from cc-I to cc-II. When the pressure rises to about 1.8 GPa, the vibration mode ofν4splits into two peaks(713.5 cm-1and 718.8 cm-1)from one(715.5 cm-1),which indicates the occurrence of the phase transition from cc-I to cc-II. The same phenomenon is observed in other runs, but the transition pressure is slightly different.
The transition of calcite from cc-II to cc-III can be observed in the Raman spectra collected from run DD0006 as shown in Fig.5. In the phase of cc-II,the doubletν4peaks are located respectively at 712.3 cm-1and 721.3 cm-1at 2.2 GPa.When the pressure reaches 2.7 GPa,the doubletν4mode splits into eight peaks,located at 679.3,693.1,698.3,712.9,723.7,733.0,741.8,and 748.2 cm-1,respectively. This indicates the transition from cc-II to cc-III,and there is a transient process before the completion of phase transition, in which cc-II coexists with cc-III(e.g.,atP ≈2.4 GPa). Experimental results regarding the transitions, from cc-I to cc-II and from cc-II to cc-III,obtained from all runs are summarized in Table 2.

Fig. 4. Raman spectra recorded from run DD0012 under dynamic loading pressurizing. At P ≈1.8 GPa,the vibration mode of ν4 splits from one peak to two peaks,indicating the transition of calcite from cc-I into cc-II.

Fig.5. Raman spectra collected from run DD0006 under dynamic loading pressurizing.The vibration mode of ν4 splits from two peaks at P ≈2.2 GPa to eight peaks at 2.7 GPa, indicating the transition of calcite from cc-II to cc-III.There is a transient process before the completion of phase transition at ~2.4 GPa,in which cc-II coexists with cc-III.

Table 2. Pressure conditions (P, in unit of GPa) for the stability of each phase and coexistence of cc-III dimorphism in calcite.
Our results show that the transition pressures from cc-I to cc-II and from cc-II to cc-III are around 1.5±0.3 GPa and 2.5±0.3 GPa,respectively. Although the transition pressure from cc-I to cc-II is consistent with most of previous studies,[5,24,42,51,52]the transition pressure from cc-II to cc-III agrees only with some of the results[20,25]at a pressure of about 2.5 GPa. We attribute the discrepancy between this study and others in the transition pressure from cc-II to cc-III to the ambiguity of the cc-III and cc-IIIb dimorphisms. In some researches, cc-II is preferentially transformed into cc-IIIb rather than cc-III as pressure increases.[22-24]As a result,the transition pressure from cc-II to cc-III cannot be compared with their results,because the transition did not occur in their studies.
3.4. Coexistence of cc-III and cc-IIIb
As mentioned above,the dimorphism of cc-III is the focus of this study, and more attention is paid to the coexistence of cc-III and cc-IIIb. These two phases,based on the analyses of their vibrational characteristics, can be recognized from theirν4mode,with seven or more peaks for cc-III and three for cc-IIIb. Figure 6 shows the Raman spectra in the pressure range for the coexistence of cc-III and cc-IIIb. AtP ≈3.1 GPa,the characteristicν4mode exhibits eight peaks, located respectively at 679.3, 693.1, 699.5, 711.2, 724.5, 733.8, 742.2, and 747.9 cm-1, indicating that the calcite is in cc-III phase. As the pressure increases,theν4mode changes continuously. AtP ≈3.3 GPa, the peak located at 710.8 cm-1disappears, indicating the beginning of the phase transition from cc-III into cc-IIIb. At 6.7 GPa, theν4mode shows mainly three peaks at 699.1, 745.0, and 750.7 cm-1, marking the completion of the phase transition from cc-III to cc-IIIb. From that point on,a few weak external modes appear or disappear with pressure increasing, but theν4mode remains almost unchanged,indicating that calcite is stable in cc-IIIb phase.In the pressure range between 3.3 GPa and 6.4 GPa,however,the peaks representing cc-III diminish and the feature for cc-IIIb emerges,which can be considered as the coexistent pressure range of cc-III and cc-IIIb. Similar results are obtained in all other runs,which are summarized in Table 2.

Fig. 6. Raman spectra recorded from run DD0006 under dynamic-loading pressurizing. The ν4 mode changes from eight peaks at 3.1 GPa into three peaks at 6.7 GPa, indicating the phase transition of calcite from cc-III to cc-IIIb. Between these two pressures,two phases coexist.
Through continuously pressurizing andin situspectroscopic observations,we confirm the coexistence of cc-III and cc-IIIb. Although the coexistent pressure range varies slightly run by run,our observations are consistent with previous studies in which coexistence was also found.[2,20,21,25]
3.5. Influence of pressurizing rates on phase transition
In order to evaluate the influence of pressurizing rate on the phase transition of calcite, experiments are carried out at different pressurizing rates. The effect of pressurizing rate on the phase transition of calcite is displayed in Fig.7.
As shown in Fig. 7, at different pressurizing rates, the transition pressures from cc-I to cc-II and from cc-II to cc-III are~1.5 GPa and~2.5 GPa,respectively,indicating that the transition pressures are not influenced by the pressurizing rate. In comparison,the transition pressures from cc-III to cc-IIIb are~9.9,~6.9,~6.1,and~4.5 GPa for the pressurizing rate of 0.006,0.012,0.021,and 0.056 GPa/s,respectively.The transition pressure decreases with the increase of pressurizing rate,showing a remarkable pressurizing rate dependence.
Furthermore, it is found that the pressure range for the coexistence of cc-III and cc-IIIb is also dependent on the pressurizing rate. As shown in Fig. 7, as the pressurizing rate increases from 0.006 GPa/s to 0.056 GPa/s, the pressure range for the coexistence of cc-III and cc-IIIb decreases from~7 GPa to~1.5 GPa. The higher the pressurizing rate, the narrower the coexistence pressure range of cc-III to cc-IIIb is.
Our results show that part of the phase transition process of calcite is related to the pressurizing rate,while the other part is independent of the pressurizing rate. This phenomenon can be explained from the perspective of energy.
In thermodynamics, a system tends to be in an energy“well”(that is, the Gibbs energy is the lowest)to remain stable. In order to adapt to the changes of thermodynamic conditions(such as pressure),the system must find new energy well accordingly. Although thermodynamics provides the driving force to bring the system from one well to another, effective activation energy(Qeff)is required to overcome an energy barrier (Q) for completing the transition. In other studies,[53]it is found that theQeffdecreases exponentially with the pressurizing rate. The points mentioned here are schematically illustrated in Fig.S5 for later discussion.
Comparing with the transition of calcite from cc-I to cc-II, and cc-III, the coexistence of cc-III and cc-IIIb can be regarded as a metastable state with a lower energy barrier for the next transition. If the transition between the two states with a highQ, even if theQis reduced toQeffdue to the influence of pressurizing rate, the reduced part of the energy,ΔQ=Q-Qeff≪Q, is still too small to affect considerably the transition process. So,the effect of the pressurization rate is not obvious. However,for the metastable state of the coexistence of cc-III and cc-IIIb with a lowQ, any change of ΔQresulting from the influence of pressurizing rate(say,ΔQ~Qcan be significant. The higher the pressurizing rate,the lower the energy barrier is,and the easier it is to pull the system out of the metastable state. This is very consistent with our observations shown in Fig.7.
Our results suggest that the coexistence of cc-III and cc-IIIb depends on the pressurizing rate and may provide clues to the explaining of the lack of observed coexistence in some static studies. In the conventional DAC, each stage of stepby-step pressurization is commonly completed in a very short time, that is, the pressurizing rate is very high. As shown in Fig. 7, the higher the pressurizing rate, the narrower the coexistence pressure range is. Since the pressurizing rate in stepwise-loading DAC can be several orders of magnitude higher than the fastest pressurizing rate in this study, it is not surprising that the coexistence, if any, of cc-III and cc-IIIb is overlooked in those researches carried out by the conventional DAC.
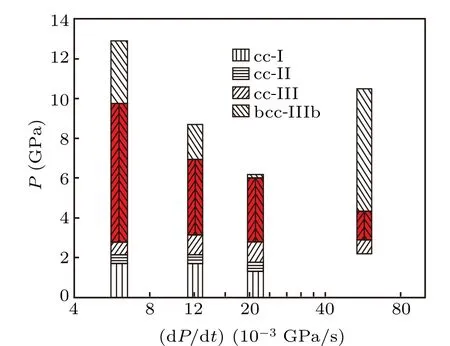
Fig.7. Variations of transition pressures on calcite phase with the pressurizing rate for cc-I,cc-II,cc-III,and cc-IIIb. The portion of the coexistence of cc-III and cc-IIIb are highlighted and the pressurizing rate is log-scaled.
4. Conclusions
Using the d-DAC, the phase transitions in calcite, from cc-I to cc-II, cc-III, and cc-IIIb, are investigated based onin situexperiments. A number of new findings are revealed,especially about the coexistence of cc-III dimorphism,which are summarized as follows.
(i)At room temperature, the phase transitions of CaCO3from cc-I to cc-II and from cc-II to cc-III occur at~1.5 GPa and~2.5 GPa,respectively.The pressures of these transitions are independent of the pressurizing rate.
(ii)The transition pressure from cc-III to cc-IIIb is pressurizing rate dependent. As the pressurizing rate increases from 0.006 GPa/s to 0.056 GPa/s, the transition pressure decreases from 9.8 GPa to 4.5 GPa.
(iii)The transition from cc-III to cc-IIIb is a sluggish process. Before the complete transition from cc-III to cc-IIIb,those two phases can coexist in a certain pressure range,which is dependent on the pressurizing rate. The higher the pressurizing rate,the narrower the pressure range for the coexistence of the two phases is.
(iv)The dependence of the coexistence of cc-III to cc-IIIb on pressurizing rate may result from the influence of pressurizing rate on the activation process by reducing energy barrier.The higher the pressurizing rate, the lower the energy barrier is,and the easier it is to pull the system out of the metastable state.
This study marks some of the first attempts ofin situRaman spectroscopy of mineral phase transition in dynamic loading DAC. It reveals that the phase transition of solid can be pressure-rate-dependent, providing new insights into the understanding of the structural changes of minerals in the dynamic environment.
Acknowledgements
We are indebted to Junwei Li for his technical help in the experiment. We want to thank High Performance Computing(HPC),NUS for providing technical support in part of our simulation work.
Project supported by the Fund from the Chinese Academy of Sciences (Grant No. QYZDY-SSW-DQC029)and the National Natural Science Foundation of China(Grant No.41674097).
猜你喜欢
杂志排行
Chinese Physics B的其它文章
- Characterizing entanglement in non-Hermitian chaotic systems via out-of-time ordered correlators
- Steering quantum nonlocalities of quantum dot system suffering from decoherence
- Probabilistic quantum teleportation of shared quantum secret
- Spin–orbit coupling adjusting topological superfluid of mass-imbalanced Fermi gas
- Improvement of a continuous-variable measurement-device-independent quantum key distribution system via quantum scissors
- An overview of quantum error mitigation formulas