Spin–orbit coupling adjusting topological superfluid of mass-imbalanced Fermi gas
2022-09-24JianFeng冯鉴WeiWeiZhang张伟伟LiangWeiLin林良伟QiPengCai蔡启鹏YiCaiZhang张义财ShengCanMa马胜灿andChaoFeiLiu刘超飞
Jian Feng(冯鉴) Wei-Wei Zhang(张伟伟) Liang-Wei Lin(林良伟) Qi-Peng Cai(蔡启鹏)Yi-Cai Zhang(张义财) Sheng-Can Ma(马胜灿) and Chao-Fei Liu(刘超飞)
1School of Science,Jiangxi University of Science and Technology,Ganzhou 341000,China
2School of Physics and Electronic Engineering,Guangzhou University,Guangzhou 510006,China
Keywords: topological superfluid,mass-imbalanced,spin-orbit coupling,Fermi gas
1. Introduction
Topological superfluids provide a new quantum phase of matter and attract extensive interest in many physical systems,[1]and the spin-orbit coupling(SOC)is a key ingredient for the observation of topological superfluid states.[2]The ultracold Fermi gas is highly controllable and is an ideal platform to observe the topological superfluid state experimentally.[3-5]For the non-polarized Fermi gas near a wide Feshbach resonance, the SOC enhances the effect of the system interaction on the Fermi pairing. Thus, the crossover behavior also appears in the Bardeen-Cooper-Schreiffer (BCS) side.[6,7]In addition, it is proposed that the topological superfluid phase can be stabilized in spin polarized Fermi gas if there is the influence of SOC.[8-12]In the absence of SOC, the polarized Fermi gas can display the phase separation near the wide Feshbach resonance due to the competition between the imbalance of the number of particles and the pairing interaction.[13-15]In the presence of SOC, the phase separation of the polarized Fermi gas has richer structures,in which the topological nontrivial superfluid states exist.[9-12,16]For example, two types of topological superfluid with two or four gapless points may be stable in the SOC polarized Fermi gas.[5,10,16]
Most investigation of ultracold Fermi gas with SOC focus on the mass-balanced cases.[17-28]Differently, the twospecies (mass-imbalanced) Fermi-Fermi degenerate mixture would show more special properties,[29-40]It is found that Feshbach resonance can occur in the6Li-40K mixture,[29]and this result plays an indispensable role in exploring the multibody physics of strongly interacting regions and opens up a way for people to study mixed Fermi materials. Recently,the mixture of161Dy-40K offers an ideal platform with mass imbalance and strong interaction,[32]and it can effectively inhibit the elastic loss near the resonance. Undoubtedly, if the SOC is applied to the Fermi mixtures with different masses,the combined interactions will induce some special properties in the superfluid phase diagram, the phase separation region and quantum phase transitions between various superfluid states.[9,33]A systematical exploration of the topological superfluid phase in the SOC Fermi mixtures will improve the current understanding of the controllability of ultracold-gas platform.
It is a hot topic to find out the existence regions of different quantum phases in ultracold Fermi gases. Mass-balanced Fermi gas with SOC has shown rich phase structures, such as conventional superfluid states,topological superfluid states and various phase separations.[10-12]Meanwhile, it is found that the mass-imbalanced effect has a great influence on its phase diagram.[9,33]Furthermore, the thermodynamic potential is usually used to judge various quantum phases.[10-12]These studies enrich our understanding of various quantum phases. But there is rarely direct illumination about how the combined interaction of SOC and imbalanced mass affects the thermodynamic potential and the corresponding phase diagrams.Undoubtedly,for the mass-imbalanced ultracold Fermi gases, it will provide a deeper understanding to find out the influence of SOC on the thermodynamic potential and the existence regions of various corresponding quantum phases.
In this paper, we study the topological superfluid phase transition of 2D mass-imbalanced Fermi gas with SOC. We use BCS-type mean-field theory to investigate the effect of SOC on the ground state phase diagram. Due to the presence of sub-stable or unstable solutions of the gap equation,we directly minimize the thermodynamic potential.[9-12]We find that there is only one topologically nontrivial superfluid state, which is always protected by an excitation gap away from its phase boundary. This is in agreement with previous calculations.[3,5,12]Clearly, it is not possible to have a spin-orbit field to interconvert different kinds of atoms,and it is not possible to create spin-orbit coupled massimbalanced systems with a mixture of two substances. But the mass-imbalanced systems can be loaded on the single twocomponent Fermi gas into the spin-dependent optical lattice,making the components have different effective masses.[33]
This paper is organized as follows: In Section 2, we present the model of a 2D two-component Fermi gas with SOC of unequal masses. We introduce the mean-field theory and obtain the Hamiltonian of the system. In Section 3,we firstly obtain the thermodynamic potential of the Fermi gas by numerical calculations. And then we detailedly analyze the minimum of the thermodynamic potential and indicate the conditions for the existence of each type of superfluid state.We also show the phase diagram of the system and analyze the effect of each factor on the ground state. Finally, we compare our results with others. Section 4 is our conclusion.
2. Model
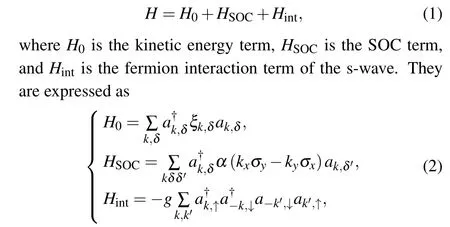
We consider a 2D two-component Fermi gas with unequal masses and the Rashba SOC. The Hamiltonian of the system contains three terms, i.e., the kinetic energy term, the SOC term and the interaction term. The total Hamiltonian of the system can be written as
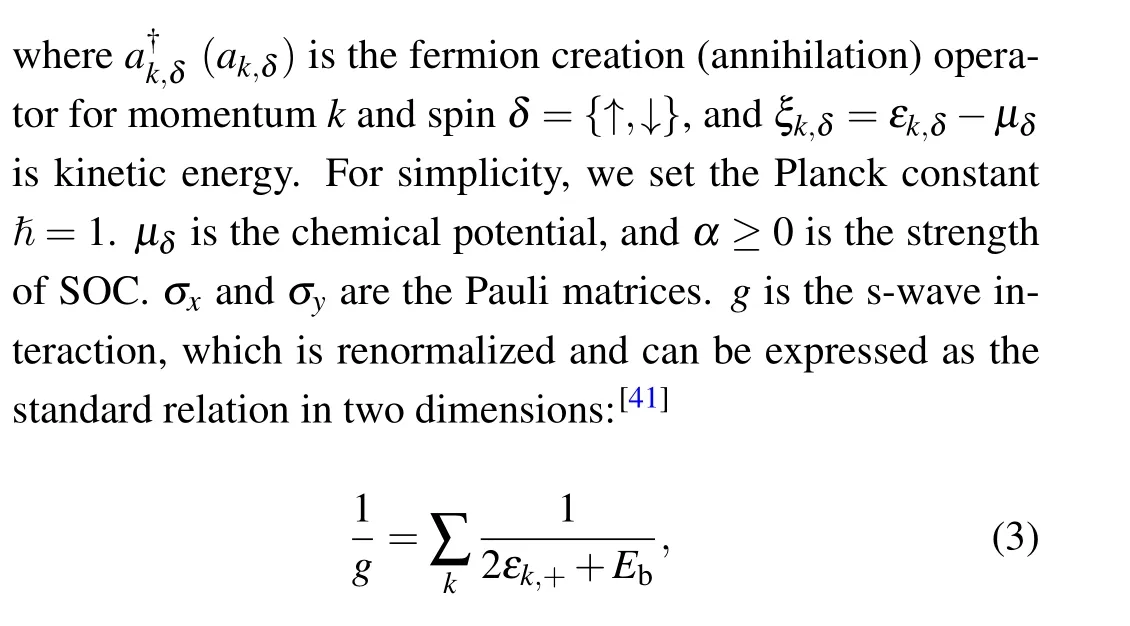
whereEb>0 is the binding energy of the two-body bound state of the two-dimensional SOC system. We can adjust it through Feshbach resonance. When it increases from zero,the system transitions from BCS to Bose-Einstein condensate(BEC).εk,±=(εk,↑±εk,↓)/2,m±=2m↑m↓/(m↓±m↑),m+is twice the reduced mass of the Fermi gas of spin↑and spin↓,ifm-→∞,it representsm↑=m↓.
We use the mean-field approximation to treat the interaction term. In this paper,we neglect the Fulde-Ferrell-Larkin-Ovchinnikov(FFLO)phase,in which the centroid momentum is not . This is motivated by the fact that the FFLO phase is stable only in a narrow parameter region, and hard to be observed in experiments.[10,11,42]The order-parameter of Fermi superfluid pairing is defined as

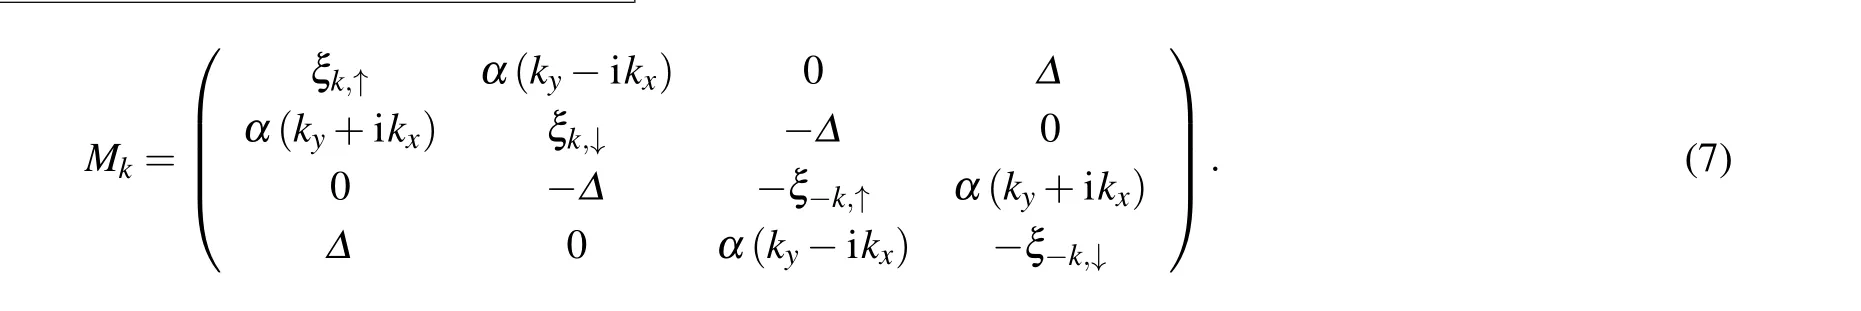
where

3. Results and discussion
3.1. Thermodynamic potential of the system

In Fig.1(a),we firstly indicate the thermodynamic potential when the superfluid order-parameters change. Note that we only adjust the SOC strengthαand fix all other parameters,and the values arec=0.1 andEb/EF=0.5. The thermodynamic potential of the system is the double-well structure atα=0.1. In fact, forα <0.25, the thermodynamic potential has a double-well structure with the minimum value near zero. Forα >0.25, the thermodynamic potential will start to change from the double-well structure to a single-well one,and the minimum value is far from 0. The first-order phase transition almost occurs atα ≈0.25,where the two minimum values of the double-well structure will be equal, and the position of the minimum starts away from 0, as shown by the red dotted line in Fig.1(a). Forα=0.5, the thermodynamic potential will completely evolve into the single-well structure.When the SOC strength continues to increase, we find that the position of minimum value of the thermodynamic potential will increase,i.e.,shift to the right. This indicates that the superfluid order-parameterΔof the ground state of the system will increase with the increase of SOC.
In the above results, we randomly choose some parameters which can represent the general principle of thermodynamic potential. If we change these parameters,the properties of the thermodynamic potential will follow the above general principle. Certainly,the critical point will change.
In Fig.1(b),we continue to examine the thermodynamic potential by adjusting the chemical potentialµ. Whenµ=-0.3,the thermodynamic potential is a monotonically increasing function, and the minimum value appears nearΔ= 0.When the chemical potential increases toµ=0.1,the thermodynamic potential almost becomes the double-well structure.In fact, we find that the critical value appears atµ ≈0.22,where the two minimum values of the double-well structure will be equal. Forµ >0.22, the double-well structure will continue to evolve into a single-well one. The minimum value will firstly appear at the right well before the double-well structure disappears. In this study,we mainly focus on the position of the minimum value. Forµ=0.5,the thermodynamic potential has become the single-well structure.
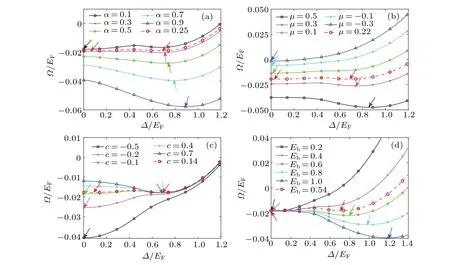
Fig. 1. The thermodynamic potential as a function of the superfluid order-parameters under various SOC strengths, chemical potentials and reduced mass ratios. The arrow points to the position where the minimum value of each thermodynamic potential appears. (a)The affection of SOC strength. Other parameters are fixed at µ/EF =0.2, c=0.1 and Eb/EF =0.5. The critical value appears at αm+/kF =0.25. (b)The affection of chemical potential. Other parameters are fixed at αm+/kF =0.2, c=0.1 and Eb/EF =0.5. The critical value appears atµ/EF=0.22. (c)The affection of reduced mass ratio. Other parameters are fixed at αm+/kF=0.2,µ/EF=0.2 and Eb/EF=0.5. The critical value appears at c=0.14. (d) The affection of binding energy. Other parameters are fixed at αm+/kF =0.2, µ/EF =0.2 and c=0.1. The critical value appears at Eb/EF=0.54. We choose the Fermi energy EF as the energy unit,and set the difference of chemical potential h=EF.The corresponding momentum unit is defined as kF,and EF=k2F/2m+.
In Fig.1(c),we change the reduced mass ratio to examine the thermodynamic potential. Whenc=-0.5,the thermodynamic potential is a monotonically increasing function. When the reduced mass ratio increases,the thermodynamic potential will tend to form the double-well structure firstly. Forc=0.1,the double well is obvious. Similarly,a critical value appears atc ≈0.14 and the two minimum values of the double-well structure will be equal. Forc >0.14,the location of the minimum value will appear at the right well. After that, the left well will be raised and will eventually evolve into a singlewell structure. Forc=0.4, the thermodynamic potential has become the single-well structure.
In Fig. 1(d), we change the two-body bound energy to check the thermodynamic potential. WhenEb=0.2,the thermodynamic potential is a monotonically increasing function.When the two-body bound energy increases, the thermodynamic potential will tend to the double-well structure. ForEb=0.4,the thermodynamic potential has become the doublewell structure. The critical value appears atEb≈0.54 and the two minimum values will be equal.ForEb>0.54,the location of the minimum value of potential well will move away from 0 and appear at the right well. ForEb=1,the thermodynamic potential will become the single-well structure.
We now study the relationship between the superfluid order-parameter and the reduced mass ratioc. In Fig. 2(a),whenα= 0 andcis less than a certain critical value, the superfluid order-parameter will disappear. Whenαis very small, the superfluid order-parameter is hard to be obtained numerically. The main reason comes from the calculation accuracy. The superfluid order-parameter will move away from 0,as shown by the solid line ofα=0.2,α=0.4,andα=0.6 in Fig.2(a1). In fact,as long as the SOC strength is not 0,the superfluid order-parameter should not be 0.[8]Here,the black curve indeed shows that the results are not 0 in Fig.1(a)[see the arrow atΔ=0]. In addition, we also find that the orderparameters of the four solid lines ofα=0,α=0.2,α=0.4 andα=0.6 have an obvious jump behavior,which is induced by the shift of the minimum thermodynamic potential from the left well to the right one. The jumping behavior would completely disappear whenα ≥0.8,and the solid line transfers to be the continuous growth.
The jumping behavior in Fig.2(a1)is completely related to the structure of the thermodynamic potential in Fig.1. For example, we have pointed out that the jump behavior disappears whenα= 0.8. In fact, the thermodynamic potential would become the single-well structure whenα=0.8. As the strength of SOC increases,the position of the minimum value of the double well will gradually closer and evolve into the single well eventually. The magnitude of the order-parameter jump represents the distance that the minimum value of the double well is equal,as shown in Fig.2(a2).

Fig.2. The relationship between the superfluid pairing order-parameter Δ and the reduced mass ratio c=m+/m-. (a1)SOC strength changes.Other parameters are fixed at µ/EF =0.2, and Eb/EF =0.5. (a2) Critical cases under different SOC strength. (b1) The binding energy changes. Other parameters are fixed at µ/EF =0.2, and αm+/kF =0.1. (b2) Critical cases under different binding energy. We choose the Fermi energy EF as the energy unit,and set the difference of chemical potential h=EF. The corresponding momentum unit is defined as kF,and EF=k2F/2m+.

However, whenEb=0.4, the observable topological superfluid state would occur.Similarly,whenEb=0.2,the jump behavior disappears. At this time, the ground state of the system is topological-superfluid, and the observable topological superfluid area would also increase significantly. In the NSF (NTSF) area, we findα →0, and the superfluid orderparameter decays exponentially. If we increase the value ofαto the transition area between the topological superfluid state and the normal superfluid one,the superfluid order-parameter will increase rapidly.
Similar to Fig.2(a2),we describe the trend of change between the two minimum values of the double well in the critical cases of different binding energy in Fig. 2(b2). We find that the binding energy is contrary to SOC,and the greater the binding energy,the farther away the two minimum values are.In Fig. 2(b1), there is a continuous curve, corresponding to only one minimum value in Fig.2(b2),whenEb=0.2. In the rest of the case there is a jump behavior in Fig.2(b1),so there are two minimums in Fig.2(b2),and the distance between the two minimum values represents the corresponding jump amplitude.
3.2. Ground state phase diagram of the system
In the above discussion,we point out that the system has lots of local minimum. Thus, there is phase separation in the case of the fixed number of particles. For convenience,we fix the chemical potential to avoid the phase separation. In the VAC region, the superfluid order-parameterΔis zero in this case. Sinceµ <-0.5, the chemical potentialsµ↑andµ↓of the two components are both less than 0 in the system. Therefore, there is no normal state in the phase diagram, and the corresponding state is replaced by the vacuum state.[12]
Now we give a phase diagram withα-µ, where the reduced mass ratio is fixed but not 0, and the difference of chemical potentialhis also fixed. The red solid curve in Fig.3 represents the first-order phase transition.Usually,there are two topological superfluid states in the three-dimensional system[9-11]and the two-dimensional NIST SOC system.[16]Here,our results are special,and there is only one topological superfluid state in the two-dimensional Rashba SOC system.

Fig. 3. The phase diagram on the α-µ plane. The binding energy of the two bodies is set as Eb/EF =0.5 and the reduced mass ratio is c=0.1. The red ‘×’ represents the NTSF state, the blue ‘°’ represents the TSF state,the black‘∗’represents the SF state,and the blank area represents the VAC state. The red solid curve represents the firstorder quantum phase transition. The four dashed lines I-IV indicate the one-dimensional phase diagram of the superfluid order-parameter Δ changing with the strength of SOC α. The detailed results are shown in Fig.4. We choose the Fermi energy EF as the energy unit, and set the difference of chemical potential h=EF. The corresponding momentum unit is defined as kF,and EF=k2F/2m+.
Under the condition of local density approximation, in Fig.3,the phase passing by the vertical line from top to bottom is the phase transition process of the system from the center to the edge of the well. The phases passing by the horizontal line from left to right represent the phase transition process of the system as the SOCαstrength increases. And the paired state still exists under the limit of strong polarization, which is similar to the two-dimensional Rashba SOC system.[12,18]In Fig.3,we can also find that the normal superfluid state occupies most of the whole phase diagram,mainly in the upper left region. The topological superfluid state exists in the region where the chemical potential and SOC strength are small.If the chemical potential and SOC strength are small enough,the topological superfluid cannot be observed. If the chemical potential and SOC are not very strong, the topological superfluid state will have a stable interval in the middle of the phase diagram, which provides the possibility for experimental observation of this quantum phase.
Figures 4(a),4(b),4(c),and 4(d)show the phase diagrams of the variation of the ground state order-parameters pointed by the dashed lines I,II,III and IV in Fig.3. In Fig.4(a),all of the system are the normal superfluid state. In Fig.4(b),we choose the chemical potential ofµ/EF=0.25. When SOC increases, the order-parameter of the ground state of the system exhibits a jump behavior. The red solid circle stands for the position of the first-order phase transition, and the two sides of the phase transition are two different states. At this time, the topological superfluid state cannot be observed. In Fig.4(c),when the chemical potential isµ/EF=0.1,the observable topological superfluid state occurs in the system.And the region of the unobservable topological superfluid becomes larger. With the decrease of the chemical potential, the jump behavior of the order-parameter disappears and becomes the continuous curves. At this time, the phase boundary is separated by the secondary phase transition in Fig. 4(d). These results in fact consistent with the potential well structure we mentioned in Fig.1.
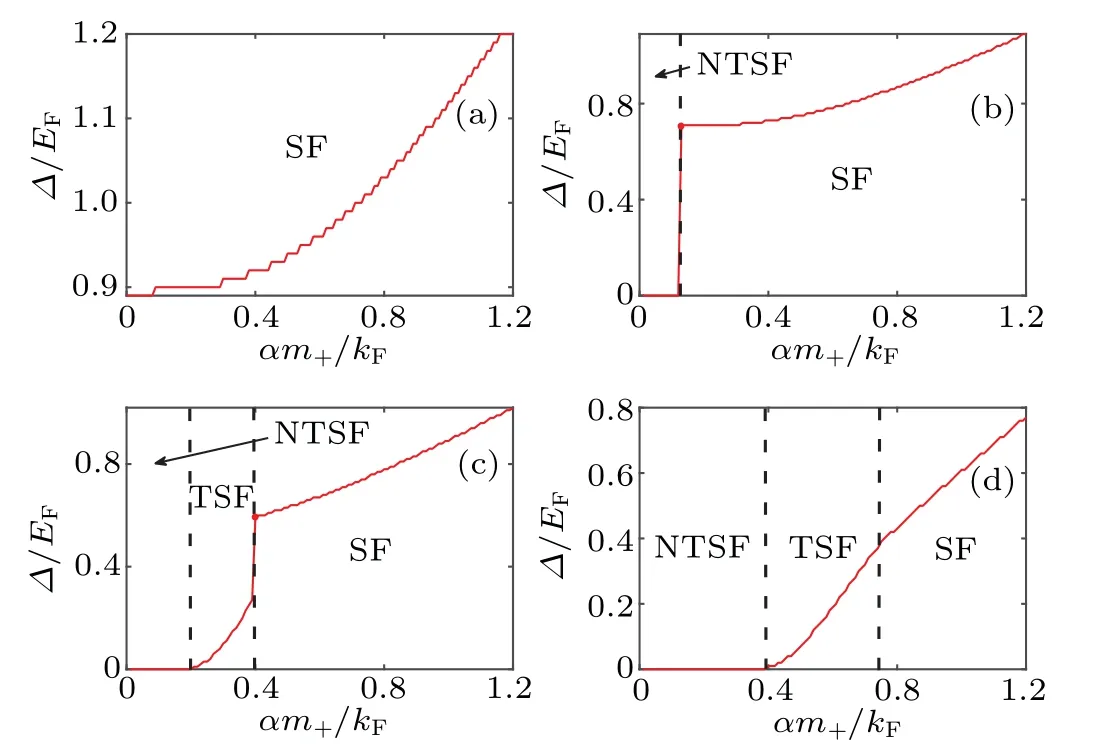
Fig. 4. The phase diagrams of the superfluid order parameter changing with the strength of SOC. (a) µ/EF =0.55, (b) µ/EF =0.25, (c)µ/EF=0.1,and(d)µ/EF=-0.35. The binding energy Eb/EF=0.5,the reduced mass ratio c=0.1,and the red dots approximately indicate the position of the first-order phase transition.
We further show the phase diagrams of the system onα-µwith various reduced mass ratiocand binding energyEb.In Fig.5,when the binding energy isEb/EF=0.5,the system displays the BCS side at this time. We can adjust the reduced mass ratio to obtain its influence on the ground state phase diagram of the system.
Note that the region of the reduced mass ratiocis-1<c <1. We would like to obtain the phase diagrams of the system under the extreme conditions, and we setc=-0.99 in Fig.5(a)andc=0.99 in Fig.5(d),respectively. We find that there is a stable interval under the two extreme cases for the topological superfluid. When the reduced mass ratio is small enough, the NSF phase appears in the phase diagram. Moreover, there is no first-order phase transition from superfluid state to topological superfluid state, and the thermodynamic potential changes continuously at the boundary. When we increase the reduced mass ratio from-0.99 to-0.5,we can find that the topological superfluid state shifts to the middle of the phase diagram,as shown in Fig.5(b).
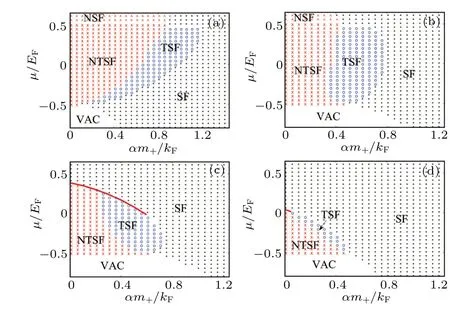
Fig. 5. The phase diagrams on the α-µ plane has different reduced mass ratios, fixing binding energy Eb/EF =0.5, where(a)c=-0.99,(b) c=-0.5, (c) c=0, (d) c=0.99, the red ‘∧’ represents the NSF state,and the red‘×’shows the NTSF state,the blue‘°’represents the TSF state,the black‘∗’represents the SF state and the blank area represents the VAC state. The red solid line represents the first-order quantum phase transition.We choose the Fermi energy EF as the energy unit,and set the difference of chemical potential h=EF. The corresponding momentum unit is defined as kF,and EF=k2F/2m+.
As the reduced mass radio increases to 0,the NSF phase disappears. And the topological superfluid region is occupied by the normal superfluid state in Fig.5(c). The above results indicate that there is the competitive relationship between the pairing mechanism of the topological superfluid and the reduced mass ratio. It is worth noting that when the reduced mass ratio approaches 1, the topological superfluid state will not completely disappear,i.e.,there is still a stable observable region in Fig.5(d)[see the blue circles].
In order to show the changes of the system’s ground state during the transition from BCS to BEC, we further plot the phase diagrams onα-µplane for various cases of binding energy in Fig.6. Figure 6(a)shows the results ofEb/EF=0.25,and Fig. 6(b) indicates those ofEb/EF= 0.7. Comparing Figs.6(a)and 6(b),the unstable superfluid(NSF region)completely disappears and changes into the SF state. Most regions of the topological superfluid(TSF and NTSF region)disappear in Fig. 6(b). Obviously, the TSF state in Fig. 6(c) is different from that in Fig.5. The stable topological superfluid state completely disappears when the binding energy increases toEb/EF=0.95. Then the unstable region will also disappear.Finally, only the stable superfluid state exists [see Fig. 6(d)].These results show that the chemical potential and the SOC have an effect on the superfluid pairing,and they will change the pairing mode of particles and the properties of the ground state of the system at the BCS side whenc=0.1,but they have no effect at the BEC side.

Fig. 6. Phase diagrams with different binding energies on the α-µplane, fixing reduced mass ratio c=0.1, where (a) Eb/EF =0.25, (b)Eb/EF=0.7,(c)Eb/EF=0.95,(d)Eb/EF=1.2,the red‘∧’represents the NSF state, and the red ‘×’ represents the NTSF state, the blue ‘°’represents the TSF state,the black‘∗’represents the SF state,the blank area represents the VAC state,and the red solid line represents the firstorder quantum phase transition. We choose the Fermi energy EF as the energy unit, and set the difference of chemical potential h=EF. The corresponding momentum unit is defined as kF,and EF=k2F/2m+.

Fig.7. Phase diagrams on the Eb-c plane with different SOC strengths,where (a) αm+/kF = 0.2, (b) αm+/kF = 0.6, (c) αm+/kF = 1, (d)αm+/kF =2.5, red ‘×’ represents table NTSF states, blue ‘°’ represents the TSF state, the black ‘∗’ represents the SF state, and the red solid line represents the frist-order quantum phase transition.We choose the Fermi energy EF as the energy unit,and set the difference of chemicalpotentialh=EF.The corresponding momentum unit is defnied as kF,and EF=k2F/2m+.
In Fig. 7, we plot the phase diagrams onEb-cplane to further study the change of the ground state phase diagrams during the transition from BCS to BEC. In Fig. 7(a), a large part of the phase diagram is occupied by the NTSF state when the strength of SOC isαm+/kF=0.1. The bigger the reduced mass ratio is,the larger the region of the observable topological superfluid is. Increasing the reduced mass ratio at the BCS side can increase the observable topological superfluid region[see Fig. 7(a)]. Whenαm+/kF=0.6 [see Fig. 7(b)], most of the region of the unobservable topological superfluid is replaced by the observable ones. When we increase the strength of SOC, the TSF state will continue to decrease until the entire region is occupied by the SF state. When the strength of SOC is small,the topological superfluid state is easy to occur for smallc. When SOC is up toαm+/kF=1,the topological superfluid state will not appear at the BEC end for any of the reduced mass ratio[see Fig.7(c)]. When SOC is large enough(αm+/kF≥2.5)[see Fig.7(d)],only normal superfluid states appear in the phase diagram. The above results indicate that the greater the strength of SOC is,the stronger the suppression of the reduced mass ratio to the topological superfluid is.
3.3. Discussion
Finally, we would like to compare our results with the previous work. In the 2D mass-balanced Fermi gas with SOC,Ref.[11]has reported the optimal parameter region for obtaining the topological superfluid phase and the phase separation structure of paired energy gap. The influence of population imbalance is suppressed by SOC,and the phase separations of superfluid phase are unstable under strong SOC.[12]Compared with them,we consider the influence of imbalanced mass. So,our results extend the existence region of topological superfluid and offer more options for the experimental observation of topological superfluid with mixed Fermi gas. Compared with the 3D case,[10]our results show that the first-order phase boundary between the conventional superfluid phase and topological superfluid phase in 2D is significantly increased. We indicate directly the first-order phase transition in the phase diagrams according to thermodynamic potential and pairing order parameter. In the SOC mass-imbalanced Fermi gases,population balance can emerge in both conventional superfluid and topological superfluid phases when imbalanced mass is large enough.[33]Here,we describe systematically the change of the thermodynamic potential of the ground state of the mass-imbalanced system. The results can directly show the origin of the phase diagrams,which is rarely indicated in previous studies.
In this work,we have considered the 2D two-component Fermi gas with imbalanced masses and the Rashba SOC.The imbalanced masses here is factually the effective masses.[43,44]So,we actually deal with the two components of spin up and spin down of Fermi gas. The consideration is mainly based on Ref.[33], where they clearly pointed out that the imbalanced masses could be designed by loading a two-component Fermi gas into a spin dependent optical lattice. Thus,SOC does not be used on different atoms but on the same Fermi atom with different hyperfine states.
Furthermore, it is interesting to fulfill a special theoretical prediction about some experimental phenomena and give some parameter regions about those phenomena. In this paper, we mainly theoretically study the variation trend of thermodynamic potential of mass imbalanced Fermi gas under different parameters and the stability range of topological phases. We consider a very ideal model without any thermal effects. In fact,it is very difficult to observe these topological phases.[45,46]The thermal effects may cause the experimental results to be different from the theoretical prediction. In Refs.[9,16],they even did not provide some special parameter regions for observing the topological phases in the real experiments. Here, our results are similar to those in Refs. [9,16]and are of reference value for real experiments. But we do not know how to effectively control the thermodynamic potential and mass imbalance of Fermi gas in real experiments. Thus,we also do not give some special parameter regions for the real experiments.
4. Conclusion
We have studied the influence of SOC, mass difference,and two-body binding energy on the ground state phase diagrams of two-dimensional Fermi gas during the evolution of BCS-BEC.We have indicated detailedly the stable regions of topological superfluid and normal superfluid under various parameters,and have shown the unstable regions where they are difficult to be observed. We found that the thermodynamic potential can display the double-well structure, and the superfluid order-parameter has a jump behavior. We detailedly pointed out first-order phase transition between the topological superfluid region and the normal superfluid one. There will always be stable observable topological superfluid state regions under weak pairing interaction by adjusting other parameters. When the strength of SOC is small,the topological superfluid state can be better observed whencis reduced. Excessive pairing interaction strength and SOC strength can restrain the formation of topological superfluid. This study gave a comprehensive account of the existing regions of different superfluid states, and provided a theoretical reference for the experiments to observe topological superfluid and superfluid.
Acknowledgements
Project supported by the National Natural Science Foundation of China(Grant Nos.11875149,11874127,52061014,and 61565007), the Youth Jing-gang Scholars Program of Jiangxi Province,China and the Program of Qing-jiang Excellent Young Talents, Jiangxi University of Science and Technology.
杂志排行
Chinese Physics B的其它文章
- Erratum to“Accurate determination of film thickness by low-angle x-ray reflection”
- Anionic redox reaction mechanism in Na-ion batteries
- X-ray phase-sensitive microscope imaging with a grating interferometer: Theory and simulation
- Regulation of the intermittent release of giant unilamellar vesicles under osmotic pressure
- Bioinspired tactile perception platform with information encryption function
- Quantum oscillations in a hexagonal boron nitride-supported single crystalline InSb nanosheet