High Chern number phase in topological insulator multilayer structures: A Dirac cone model study
2022-09-24YiXiangWang王义翔andFuXiangLi李福祥
Yi-Xiang Wang(王义翔) and Fu-Xiang Li(李福祥)
1School of Science,Jiangnan University,Wuxi 214122,China
2School of Physics and Electronics,Hunan University,Changsha 410082,China
Keywords: topological insulator multilayer,Chern number,phase diagram
1. Introduction
The quantum anomalous Hall(QAH)insulator,or called the Chern insulator,has aroused the ongoing interests in condensed matter physics, where the dissipationless chiral currents can flow in a zero magnetic field.[1-3]It was first observed in magnetic topological insulator(TI)thin films[4]that are formed by an intricate interplay between the ferromagnetism due to the magnetic-doping and the intrinsic spin-orbit coupling.[5]The magnetic-doping breaks the time-reversal symmetry (TRS) in the system and can open a small Dirac mass gap in the topological surface states.[6]In these systems,the unavoidable inhomogeneity of the magnetic-doping would lead to the complex magnetic orders.[7,8]As a consequence,the QAH effect can only be observed at extremely low temperature, which is about several tens of milikelvin, one to two orders of magnitude below the Curie temperature of the magnetic dopants.[4,8-12]When the crystalline structure and magnetic order are self-organized into a well-ordered topological superlattice, the QAH insulator can be observed at much higher temperature.[13,14]

On the other hand,as the bulk states of the TIs are gapped,a highly simplified Dirac cone model was initially proposed to explain the QAH behavior in the magnetic TI thin film.[5]The model was later developed to describe the magnetic-doped TI and ordinary insulator multilayers that can host the 3D Weyl semimetal(WSM)phase.[21,22]In the Dirac cone model,only the Dirac cone degrees of freedom on each TI surface were retained,with the intralayer and interlayer Dirac cone hoppings being included;while the bulk electronic dynamics were completely ignored.This was demonstrated to be valid by comparing the model parameters with the DFT band calculations.[23]Furthermore, the Dirac cone model was used to explore the dependence of the QAH behavior on the film thickness, the magnetic configuration as well as the stacking sequences of the TI layers.[23]
Motivated by these progresses,here we try to investigate the high-Cbehavior in the magnetic-doped TI multilayer structures from the point of view of the Dirac cone model.We focus on the Chern number phase diagram,where the Chern number is calculated by capturing the evolution of the phase boundaries with the parameters.[16,19]For comparison,we also consider another two TI multilayer structures as well as the 3D TI superlattice structures. Our main findings are as follows:(i) Within the Dirac cone model, the high-Cbehavior is attributed to the band inversion of the renormalized Dirac cones that is driven by the exchange splitting,along with which the spin polarization at theΓpoint gets increased. In the highest-Cphase, the occupied states are fully down-spin polarized at theΓpoint. (ii) To explain the observation that the Chern number decreases with the decreasing middle magnetic-doped layer thickness,[15]we assume that the related intralayer Dirac cone hopping changes from negative to positive.Based on this assumption, it is interesting to find that at certain magneticdoping, the Chern number can also get increased when the layer thickness decreases. (iii) For another two TI multilayer structures,the band inversion cannot be achieved for all negative-mass Dirac cones even when the magnetic exchange splittings are very strong.(iv)For the 3D TI superlattice structures,besides the high-Cphases,the WSM phases can appear and span broad parameter regions.Our work can provide more insights on the high-Cbehavior realized in the TI multilayer structures,which may pave the way for the future topological electronic devices.
2. Model and method
The experimental configuration of the TI multilayers[15]is plotted in Fig.1. It stacks along thezdirection and includes the alternating magnetic-doped and undoped TI layers, with the layer number in the plot beingN1= 3 andN2= 2, respectively,so the undoped TI layer is sandwiched between the doped TI layers.
We use the Dirac cone model to describe the dynamics of the TI multilayer structures. In the model,the linear Dirac cones are assumed to be present on both the top and bottom surfaces of the magnetic-doped TI layer as well as the undoped TI layer. The Hamiltonian is written as(¯h=1)[21-23]
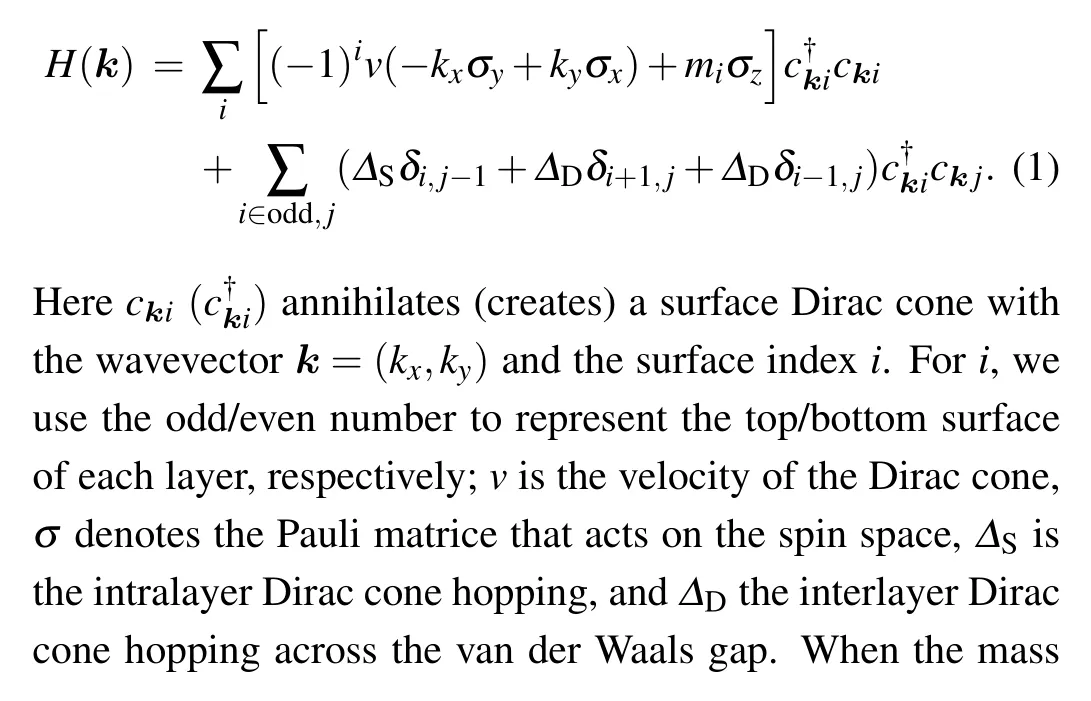
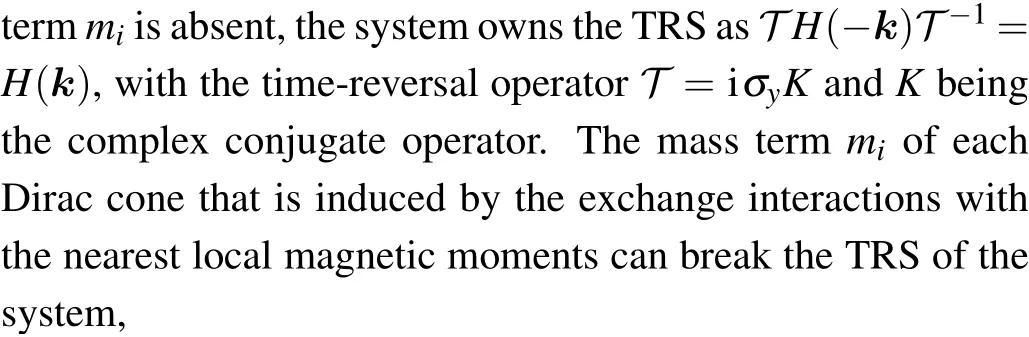
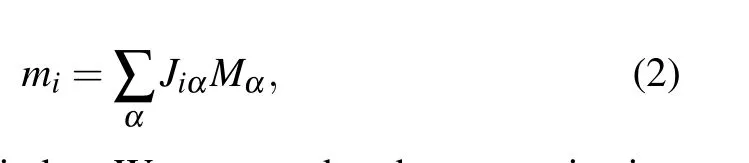
whereαis the layer index. We assume that the magnetization is along thezdirection,so thatMα=1 in the magnetic-doped layer, andMα=0 in the undoped layer. As shown in Fig. 1,each surface Dirac cone has one nearby magnetic-doped TI layer, which may be the same layer with the exchange splittingJiα=JSor the adjacent layer with the exchange splittingJiα=JD. The Dirac cones localized on different surfaces can be coupled by the Dirac cone hoppings and exchange splittings and thus get renormalized. Note that the hoppings beyond the nearest-neighbor Dirac cones are neglected because they are minor[23]and will not change the main conclusions in this paper. In our calculations,we take-ΔS=1 as the unit of energy and set the parameterδ=JD/JS.
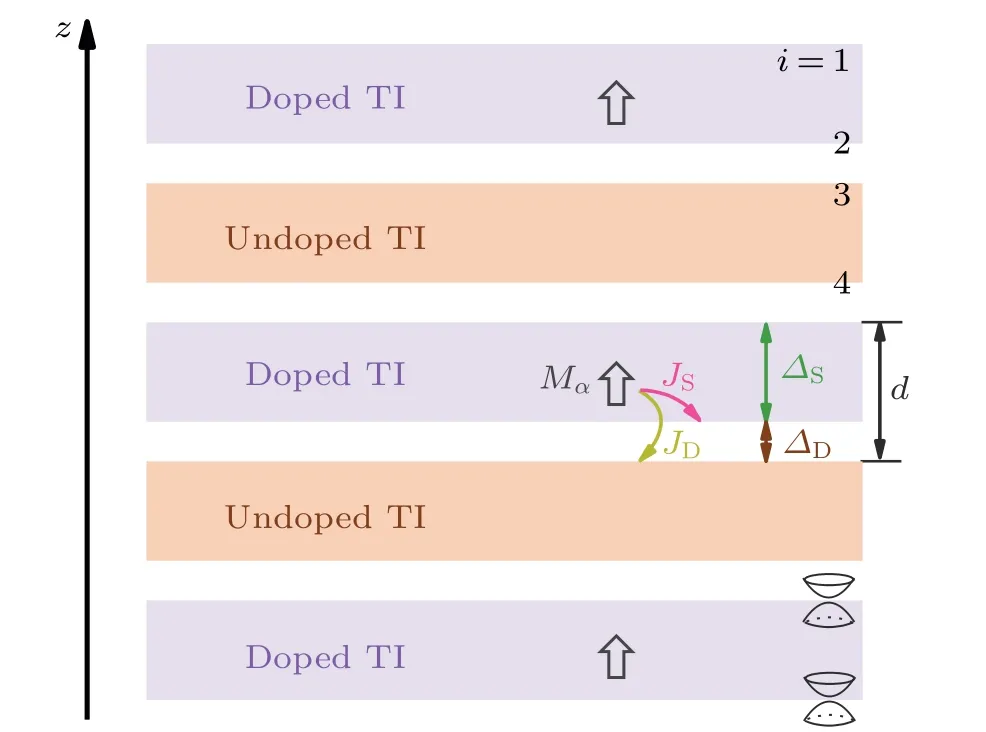
Fig. 1. Schematics of the TI multilayer structure, including the alternating magnetic-doped(N1 =3)and undoped(N2 =2)TI layers. The magnetization in the magnetic-doped TI layer is along the z direction and the interlayer distance is denoted by d. The Dirac cone hoppings ΔS and ΔD, and the exchange splittings JS and JD are indicated by the arrows. Without hoppings and exchange splittings,the Dirac cones are localized on the top and the bottom surface of each TI layer.
To calculate the Chern number in the TI multilayer structures, we follow the previous works[16,19]and try to judge the Chern number by exactly capturing the evolution of the phase boundaries with the parameters, as the Chern number change is closely connected to the gap closings. To help the Chern number judgment,two limiting cases need to be considered: (i)JS=0 of no magnetic-doping case,where the TRS is preserved and the Chern number must be vanishing, with the renormalized Dirac cones always appearing in pairs with opposite masses; (ii)ΔD=0 of the limiting isolated-layer case,where the mass of each renormalized Dirac coneMican be calculated analytically and then the Chern number is obtained.As the Dirac cones on all surfaces own the positive chiralityχi=1 and each Dirac cone can contribute a componentCito the Chern number,we have

Compared with the common Chern number calculations by using Kubo’s formula[1]or Fukui’s algorithm,[24]where the exact diagonalization is needed to obtain the eigenenergy and eigenstate for each wavevector in the Brillouin zone(BZ),the above method requires much less computational resources and time, and is expected to be extended to the antiferromagnetic configuration as well as other topological systems.
3. Magnetic-doped TI thin film

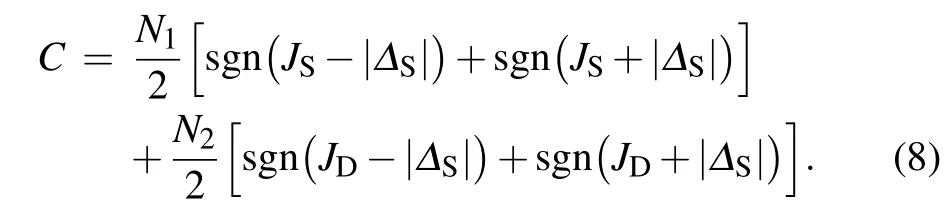
which becomes block diagonalized. It shows that the chirality of the renormalized Dirac cones in the upper/lower block remains the same as in Eq. (4), but the Dirac cone mass in the upper/lower block will get reduced/increased by the intralayer Dirac cone hopping. Then,the Chern number of the system is obtained as
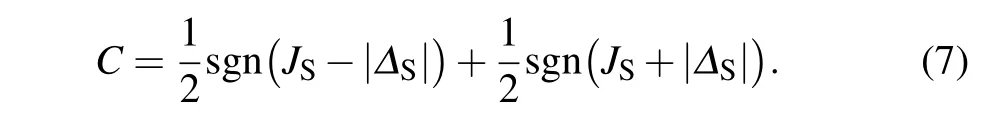
We can see that(i)whenJS<|ΔS|,the Dirac cone mass is negative in the upper block and positive in the lower block, and thus the Chern numberC=0; (ii) whenJS>|ΔS|, the Dirac cone mass in the upper block becomes positive,thus the band inversion occurs andC=1. Thus in a magnetic-doped TI thin film, the nontrivialC=1 phase can be observed only when the magnetic-doping reaches a certain ratio, which is consistent with the experimental observations in the Cr-doped or Vdoped (Bi,Sb)2Te3thin film.[4,9-12]Note that the Dirac cone model cannot support the high-Cphase in the TI thin film,which, though predicted in theory,[16,19,26]but to our knowledge,has not yet been reported in experiment.
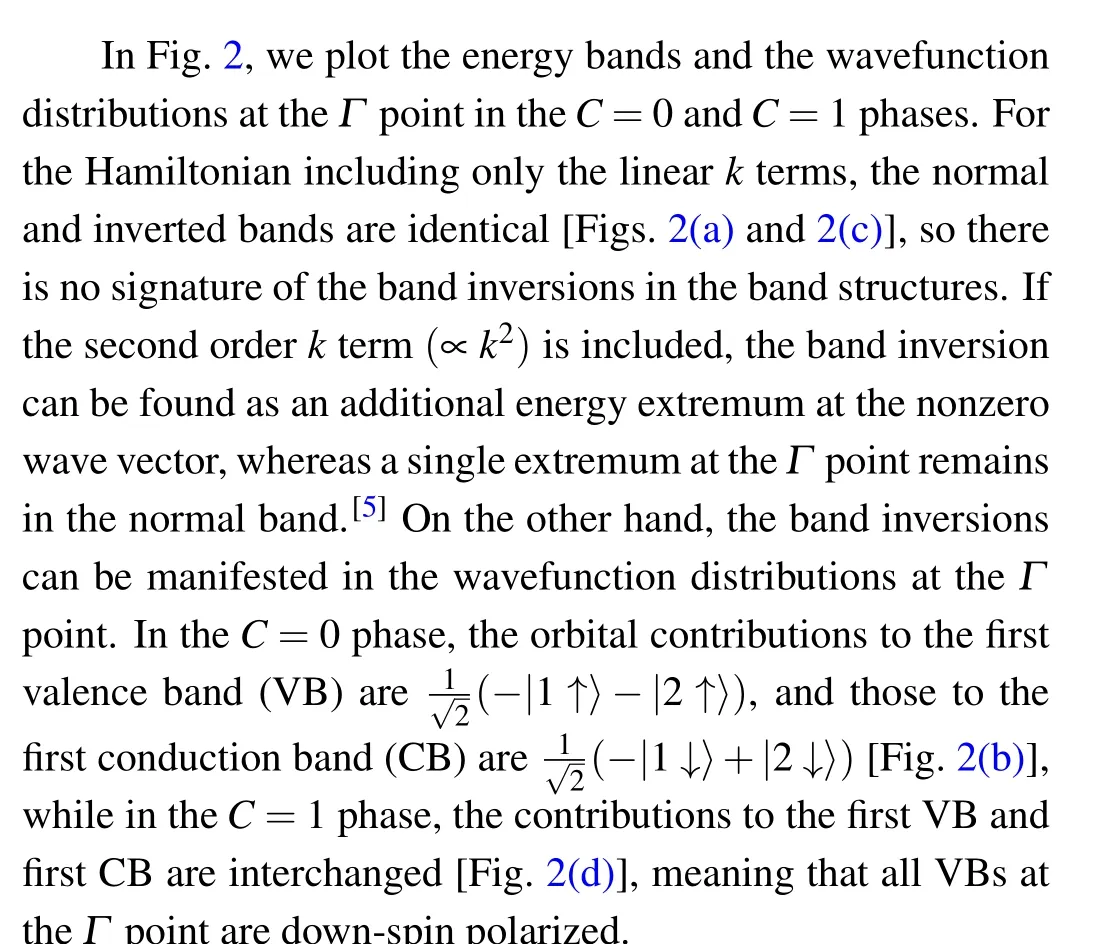
Fig. 2. The energy bands ε ~vkx when setting ky =0, and the wavefunction distributions at the Γ point on each Dirac cone in the magneticdoped TI thin film. We choose JS =0.4 in(a)and(b),and JS =1.6 in(c)and(d). In the wavefunction distributions,the blue and orange bars denote the upspin and downspin contributions,respectively,and the bar heights are proportional to the weights of the distributions. For clarity,the neighboring distributions are shifted vertically by 0.8.
4. TI multilayer structures
Next, for the TI multilayer structures, the Chern number phase diagrams are plotted in the parametric space (JS,ΔD)in Fig. 3, with the layer numberN2increasing from 1 to 5 in(a)-(e)andN1=N2+1. Experimentally, tuning the parametersJSandΔDis quite feasible,as the exchange splittingJSis expected to increase with the magnetic-doping or to increase with the decreasing temperature, and the interlayer hoppingΔDis expected to increase when the van der Waals gap is narrowed by the external pressure.[23,27]In the phase diagrams,the contour scale represents the magnitude of log10Δ, whereΔis the energy gap of the lowest bands and the bright blue lines denote that the gap is closed.
Figure 3 shows that the Chern numberCcan increase from zero up to its highest valueC=N1+N2. WhenJS=0 of no magnetic-doping case, the Chern number always vanishes due to the presence of the TRS.On the other hand,whenΔD=0 of the isolated-layer case,similar to Eq.(7),the Chern number of the TI multilayer structures is obtained as
We can see that when the exchange splittingJSincreases,the negative massJS-|ΔS| of the Dirac cone in the magneticdoped TI layer becomes positive at the critical pointJS=|ΔS|,which isN1-fold degenerate; whereas the negative massJD-|ΔS|of the Dirac cone in the magnetic-undoped TI layer becomes positive at the critical pointJD=|ΔS|, which isN2-fold degenerate. Thus, the Chern number evolutions withJSare as follows:(i)WhenJS<|ΔS|,the Chern number vanishesC=0. (ii) When|ΔS|<JS<|ΔS|/δ,C=N1. (iii) WhenJS>|ΔS|/δ, the Chern number increases to its highest valueC=N1+N2,where the band inversions occur for all negativemass Dirac cones.
When the interlayer hoppingΔDis nonvanishing, the Dirac cones in different TI layers will get coupled and further renormalized, which thus breaks the Dirac cone degeneracy. The renormalized Dirac cones may not be localized in one TI layer, but extended to all layers [see Figs. 4(a) and 4(b)]. As a result, with the increasingJS, the band inversion occurs successively for the renormalized Dirac cones. Each time a phase boundary is crossed, the band inversion occurs for one negative-mass Dirac cone and the Chern number will be changed by one. WhenΔDincreases, we can see that all phase boundaries originating fromJS=|ΔS|/δmove to largerJS.On the other hand,for the phase boundaries fromJS=|ΔS|,only one will move toJS=0,meaning that the region spanned by theC=0 phase is shrinking so that a minor magnetic doping can drive the transition from theC=0 phase toC=1,while the remainingN1-1 ones all move to largerJS.

Fig.3. Phase diagrams of the TI multilayer structures in the parameter space(JS,ΔD),with the Chern number C and the spin polarization η at the Γ point being labeled as(C,η). The contour scale represents the magnitude of log10Δ,where Δ is the energy gap of the lowest bands,and the bright blue lines denote that the gap is closed. We choose the parameter δ =0.6,the layer number N2=1-5 in(a)-(e)and N1=N2+1.
In the phase diagrams, if the magnetic-doping is small,the value of the critical pointJS=|ΔS|/δatΔD=0 will become larger. However,if the magnetic-ordered septuple layer is formed,such as in MnBi2Te4,[28]where the exchange splitting is greatly strengthened,δwill be expected to be close to 1 and thus the critical point will be close toJS=|ΔS|. In the experiment,[15]the thicknesses of the magnetic-doped and undoped layers are taken asd=3 nm andd=4 nm,respectively.The different TI layer thicknesses and properties can lead to the unequalΔSin the different layers, which will not change the basic physics and the structure of the phase diagrams(see Appendix A).
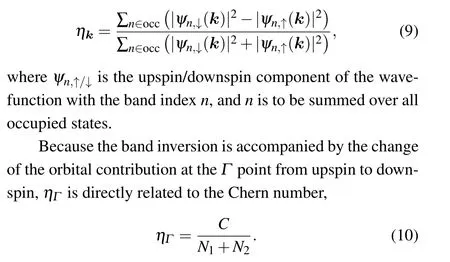
Next,we study the wavefunction distribution and the spin polarization in the TI multilayer structures. The spin polarizationηkis defined as

We also investigate the spin polarization at nonzero wave vectors. In Fig. 4(c), when settingky=0,ηis plotted as a function ofvkx,where the different lines correspond toJSincreasing from 0.12 to 3.6. We can see that,althoughηkmay increase with|kx| around theΓpoint, it decreases when|kx|is large enough. On the other hand,ηkalways increases withJS. Thus, at the asymptotically strong Zeeman splitting, the system may be driven into the ferromagnetic Chern insulator phase.[29]In the experiment, the spin polarization can be detected by the spin-polarized angle-resolved photoemission spectroscopy.[30]
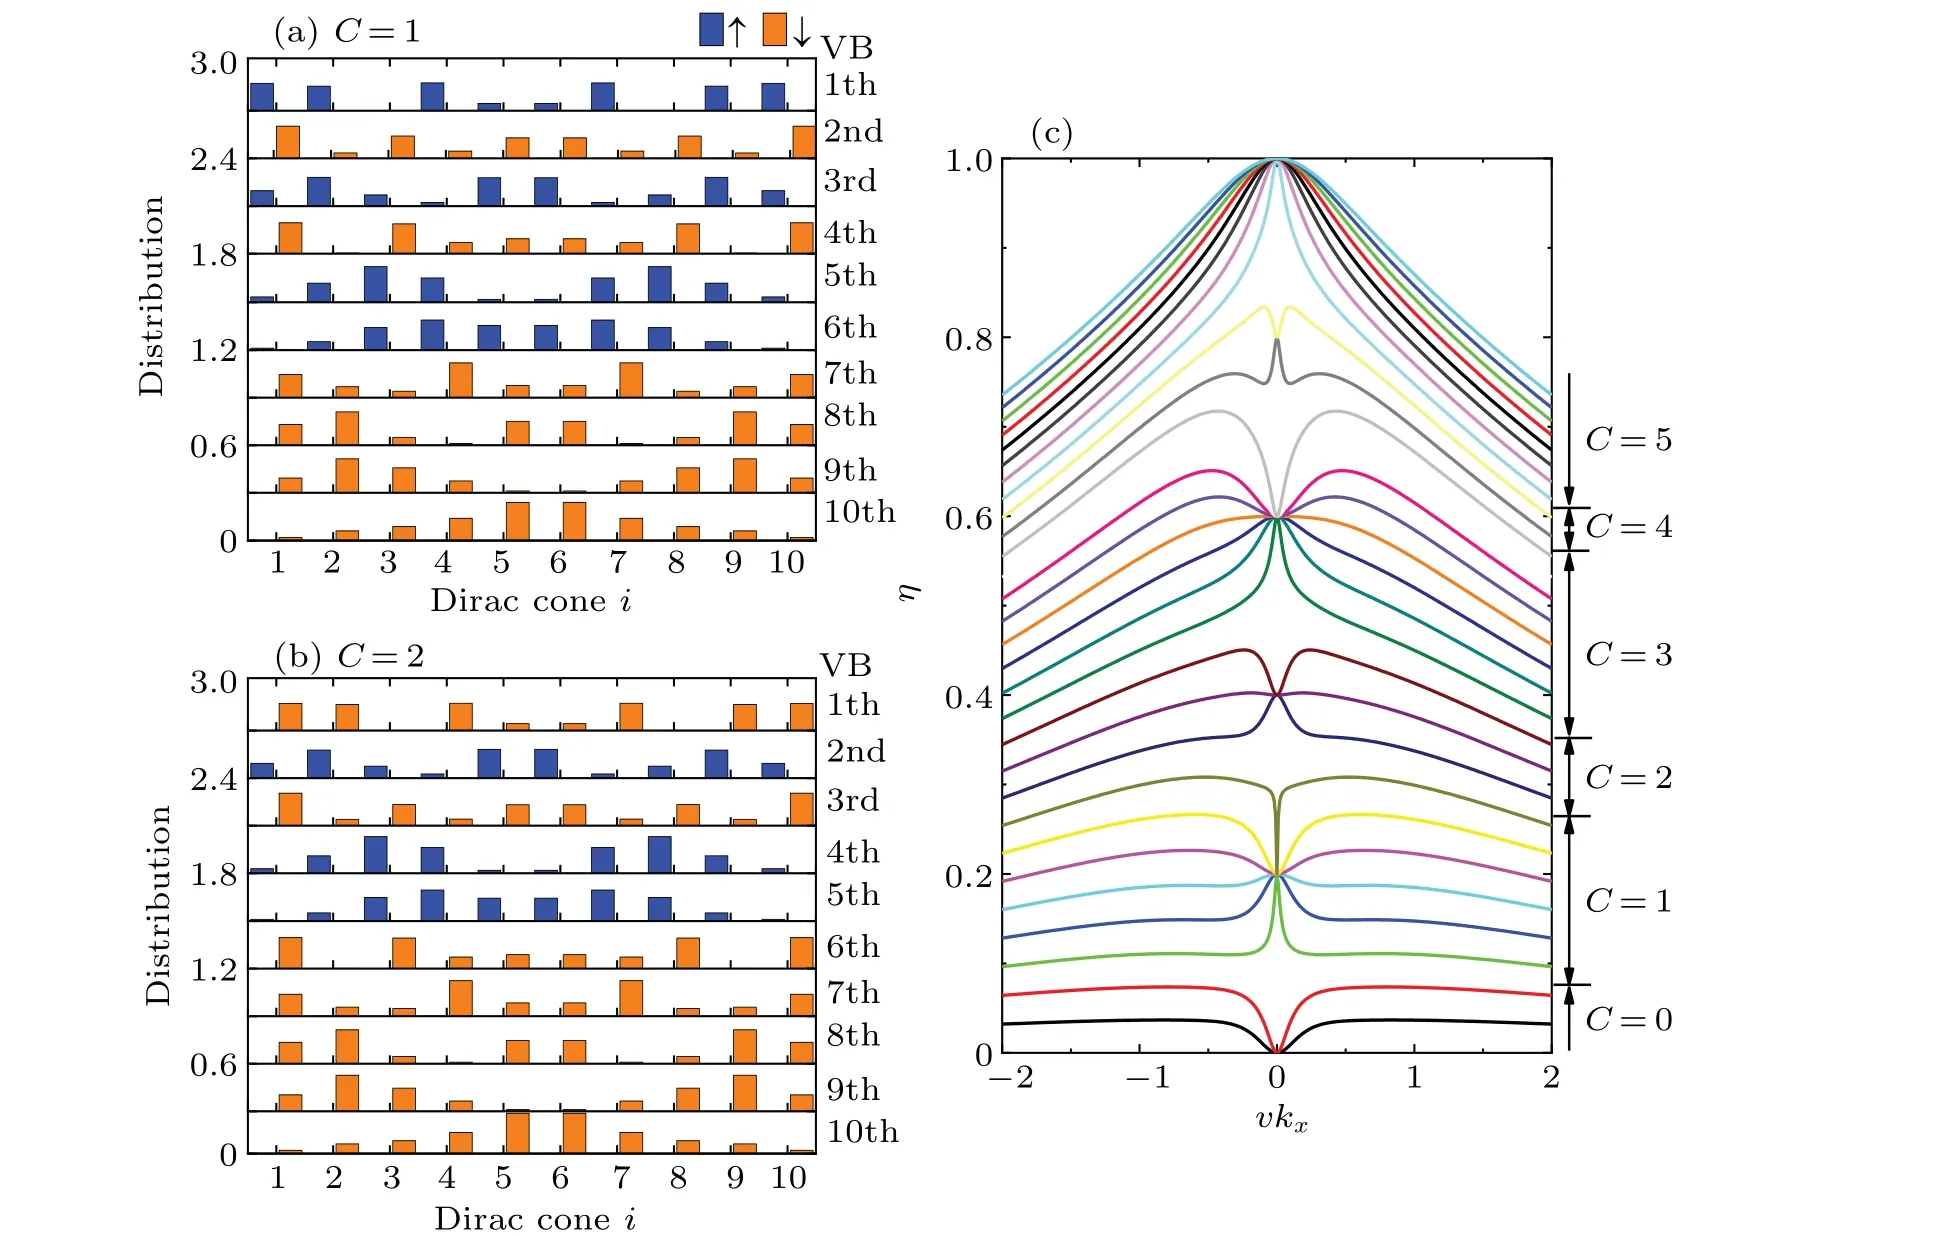
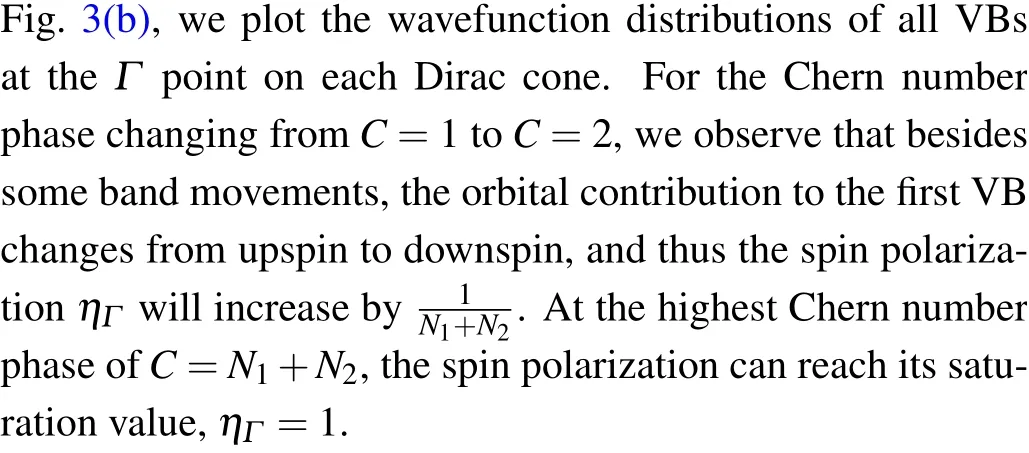
Fig.4. (a)and(b)The wavefunction distributions of all VBs at the Γ point on each Dirac cone in the TI multilayer structures. The blue and orange bars denote the upspin and downspin contributions,respectively,and the bar heights are proportional to the weights of the distributions. For clarity,the neighboring distributions are shifted vertically by 0.3. (c)The spin polarization versus vkx,where JS increases from 0.12 to 3.6 and the corresponding Chern number is labeled on the right. We choose N2=2 and N1=N2+1,ΔD=1,JS=0.84 in(a),JS=1.08 in(b),and ky=0 in(c).
The recent experiment that implemented on the TI multilayers [(Bi,Sb)2-xCrxTe3-(Bi,Sb)2Te3]N2-(Bi,Sb)2-xCrxTe3reported the observations of the high-Cphase withC=N2when the magnetic-doping ratio isx=0.24.[15]According to the above analysis,this suggests that at such a ratio,the band inversion only occurs inN2negative-mass Dirac cones. WhenΔD=0, all these Dirac cones are localized in the magneticdoped TI layers. In Ref. [15], the authors also reported that,for the TI multilayersN1=3 andN2=2, the Chern number can change fromC=2 toC=1 when the middle magneticdoped layer thickness was tuned to decrease fromd=4 nm to zero. They suggested that when the magnetic-doped layer thickness decreases, a pair of nontrivial interface states will disappear, so the Chern number is reduced by one. Here in the Dirac cone model, our observation could be instead explained by assuming that the intralayer hopping within the middle magnetic-doped TI layerΔSmwill change from negative to positive when the layer thickness decreases.This means that when the layer is thick enough, the Dirac cones attract each other so thatΔSmis negative. When the layer thickness decreases and becomes smaller, the Dirac cones become less attractive and even repel each other when a critical thickness is broken through,soΔSmbecomes positive. In our calculations,the chosen model parametersΔS=-1 andΔD>0 are consistent with the above assumptions. Moreover, in Ref. [23], by comparing the model parameters with the DFT band calculations,the authors obtained the oppositeΔSandΔD,which also supports our assumptions.
To see the effect ofΔSmon the Chern number modulation,in Fig.5,the phase diagrams of the TI multilayer structures are plotted in the parameter space(JS,ΔSm),withΔD=0.5 in(a)andΔD=1.5 in (b). We can see that in Fig. 5(a), there is noC=2 toC=1 phase transition along the vertical direction. However, in Fig. 5(b), theC=2 toC=1 phase transition can be captured along the left solid arrow, which agrees with the experiment.[15]More interestingly,in Fig.5(b),when the magnetic-doping increases and the exchange splitting lies within the range 1.51<JS<1.84, there can exist theC=2 toC=3 phase transition, e.g., along the right dashed arrow.Therefore, as long as the layer thickness is not vanishing and the Dirac cones are still present on the surfaces, the Chern number may get increased. The conclusion is quite different from the interface Dirac state mechanism,but also roots in the band inversion of the Dirac cone.

Fig.5. Phase diagrams of the TI multilayer structures in the parameter space of (JS,ΔSm), with the Chern number C being labeled. The contour scale represents the magnitude of log10 Δ, where Δ is the energy gap of the lowest bands. The bright blue lines denote that the gap is closed. We choose the parameter δ =0.6, the layer number N2 =2,N1=N2+1,and ΔD=0.5 in(a)and ΔD=1.5 in(b).
5. Other TI multilayer structures
To make comparisons, we study another two TI multilayer structures,with the Chern number phase diagrams plotted in Fig.6. In Fig.6(a),we choose the layer numbersN1=2 andN2= 3 so that the magnetic-doped TI layers are sandwiched between the undoped ones. In Fig. 6(b), we chooseN1=N2=2 and the number of the magnetic-doped TI layer is equivalent to the undoped layer.
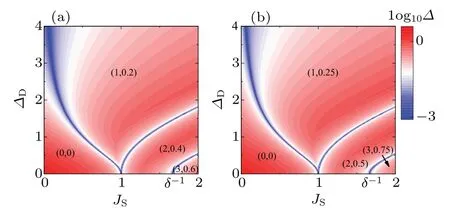
Fig. 6. Phase diagrams of two alternative TI multilayer structures in the parameter space of(JS,ΔD),with the Chern number C and the spin polarization η at the Γ point being labeled as(C,η). The contour scale represents the magnitude of log10Δ, where Δ is the energy gap of the lowest bands and the bright blue lines denote that the gap is closed. We choose the parameter δ =0.6,the layer numbers N1 =2,N2 =N1+1 in(a)and N1=N2=2 in(b).
In the isolated layer case ofΔD= 0, for the topmost undoped TI layer, the masses of the two renormalized Dirac cones are calculated as
For the spin polarizationηat theΓpoint,the results are shown in Fig. 6. We can see that the relation in Eq. (10) of the spin polarization to the Chern number still holds. Comparing Figs. 6(a) and 6(b) with Fig. 3(a), we find that, although the nontrivial Chern number phases span the similar regions,the spin polarizations are quite different. As analyzed above,even when the Chern number takes its highest value,the spin polarization at theΓpoint cannot be saturated in the two TI multilayer structures.
We note that in Fig. 6, the gaps are well opened in the Chern insulator phases. Because the Fermi energy needs to be tuned in the gap,the large gap favors the experimental observations. This conclusion is quite different from our previous work,[16]where the gaps of the Chern insulator phases were found to be too small to hinder the experimental observations.
6. TI superlattice structure
In addition, we study the TI superlattice structure under the periodic boundary conditions in thezdirection. Note that in a unit cell, the topmost and bottommost Dirac cones may have two nearby magnetic-doped TI layers. As more and more magnetic-ordered TIs have been successfully fabricated in experiments,[28,31-33]the TI superlattice considered here may also be realized in the future.
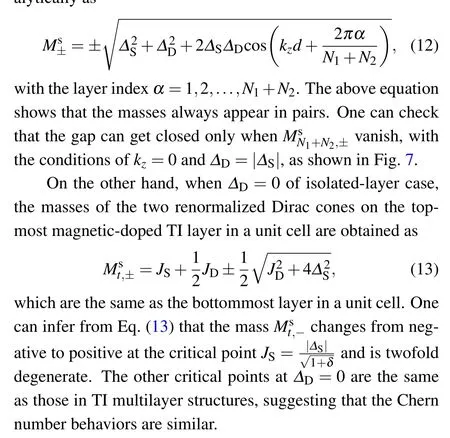
The phase diagrams for the TI superlattice are plotted in Figs. 7(a) and 7(b), where the unit cell includes the same TI layer number as in Figs.3(a)and 3(b),respectively.The bright blue regions denote that the energy gaps are closed so that the system lies in the gapless WSM phase. Figures 7(a)and 7(b)show that the WSM phases can span large parameter regions and separate the distinct Chern insulator phases. This is consistent with the previous studies,[21,23]while it is quite different from the TI multilayer structures, where no WSM phase exists in Fig.3. This is explained such that the wave vectorkzneeds to take a specific value to close the gap so that the WSM phase can be accommodated in the TI superlattice,[21,22]butkz
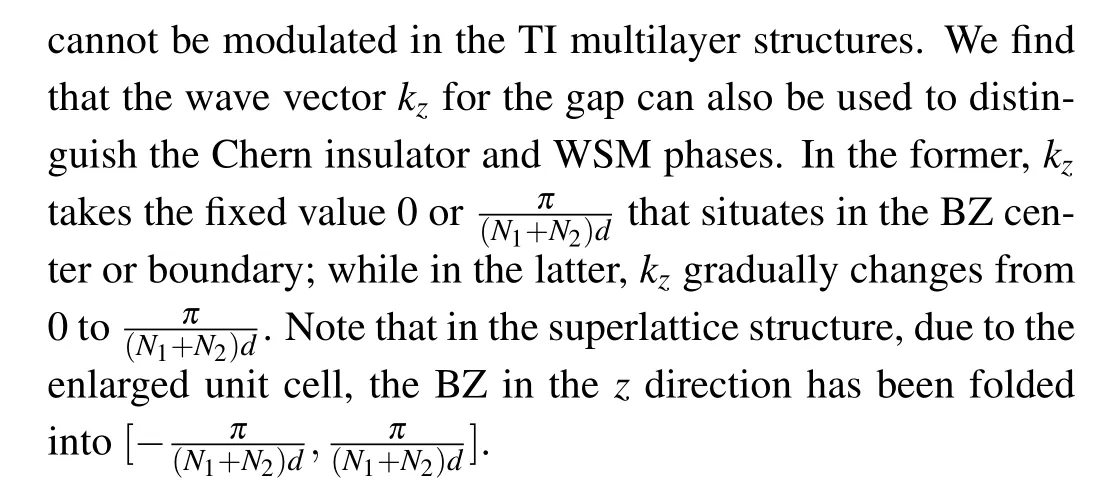

Fig. 7. Phase diagrams of the TI superlattice structures in the parameter space of (JS,ΔD), and the corresponding kz value for the energy gap. In(a)and(b),the Chern number C is labeled and the contour scale represents the magnitude of log10 Δ, where Δ is the energy gap of the lowest bands. The bright blue regions denote that the gap is closed,and the system lies in the gapless WSM phase. We choose the parameter δ =0.6,the layer number N2 =1 in(a)and(c),N2 =2 in(b)and(d),and N1=N2+1.
WhenJS=0 of no magnetic-doping case, the masses of the 2(N1+N2)renormalized Dirac cones can be calculated analytically as
7. Discussion and conclusion
In summary,we have studied the Chern number phase diagrams in the TI multilayer structures using the Dirac cone model, where the Chern number is effectively calculated by capturing the evolutions of the phase boundaries with the parameters. We find that the magnetic doping can drive the band inversion of the Dirac cones and thus induce the high-Cphase transitions. In the highest Chern number phase, the occupied states are down-spin polarized at theΓpoint.
Compared with the previous theoretical works that used the plane wave expansion method on thek·pmodel,[15,16]our results show the following differences: (i) The inverted bands are related to the renormalized Dirac cones. (ii) The Chern number may get increased even when the thickness of the middle magnetic-doped TI layer decreases. (iii)The gaps are well opened in the Chern insulator phase in another two TI multilayer structures. The differences are attributed to the fact that the surface states of each TI layer in the multilayer structures are well captured by the Dirac cone model,but may not be correctly described by the plane-wave expansion method.We hope that these conclusions,especially(ii)and(iii),would be demonstrated in the future TI multilayer experiments.
Besides the magnetic-doped TI multilayers,the magneticordered ones,as well as the factors that cannot be included in the DFT calculations,such as disorder and magnetic field,can also be described by the Dirac cone model. We expect the Dirac cone model to be widely used to explain more emergent phenomena in the TI multilayer structures, such as the axion insulator.[34,35]
Appendix A:Unequal intralayer Dirac cone hoppings
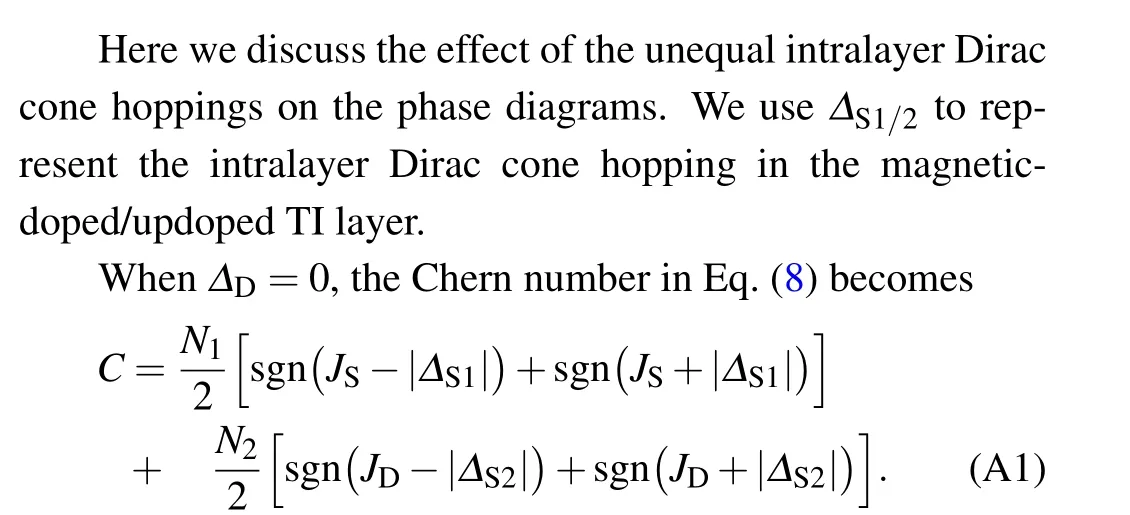
The above Chern number expression shows that the critical points are located atJS=|ΔS1| andJS=|ΔS2|/δ, as shown in Fig. A1(a). More importantly, the structure of the phase diagram in Fig. A1(a) is similar to Fig. 3(b). When settingΔD=0.9,in Fig.A1(b)we plot the phase diagram in the parametric space (JS,|ΔS2|). We observe that as|ΔS2| increases,the left three phase boundaries show minor changes,while the right two phase boundaries will move to higherJS. Thus for the unequalΔS1andΔS2, the qualitative results of the phase diagram remain unchanged.

Fig. A1. Phase diagrams of the TI multilayer structures in the parameter space(JS,ΔD)in(a)and(JS,|ΔS2|)in(b),with the Chern number C and the spin polarization η at the Γ point being labeled as (C,η).The contour scale represents the magnitude of log10 Δ, where Δ is the energy gap of the lowest bands, and the bright blue lines denote that the gap is closed. We choose the parameter δ =0.6,the layer number N2=2,N1=N2+1,ΔS1=-1,and in(a)ΔS2=-0.8,in(b)ΔD=0.9.
Acknowledgments
This work was supported by the National Natural Science Foundation of China (Grant Nos. 11804122 and 11905054),the China Postdoctoral Science Foundation(Grant No.2021M690970),and the Fundamental Research Funds for the Central Universities of China.
杂志排行

Chinese Physics B的其它文章
- Characterizing entanglement in non-Hermitian chaotic systems via out-of-time ordered correlators
- Steering quantum nonlocalities of quantum dot system suffering from decoherence
- Probabilistic quantum teleportation of shared quantum secret
- Spin–orbit coupling adjusting topological superfluid of mass-imbalanced Fermi gas
- Improvement of a continuous-variable measurement-device-independent quantum key distribution system via quantum scissors
- An overview of quantum error mitigation formulas